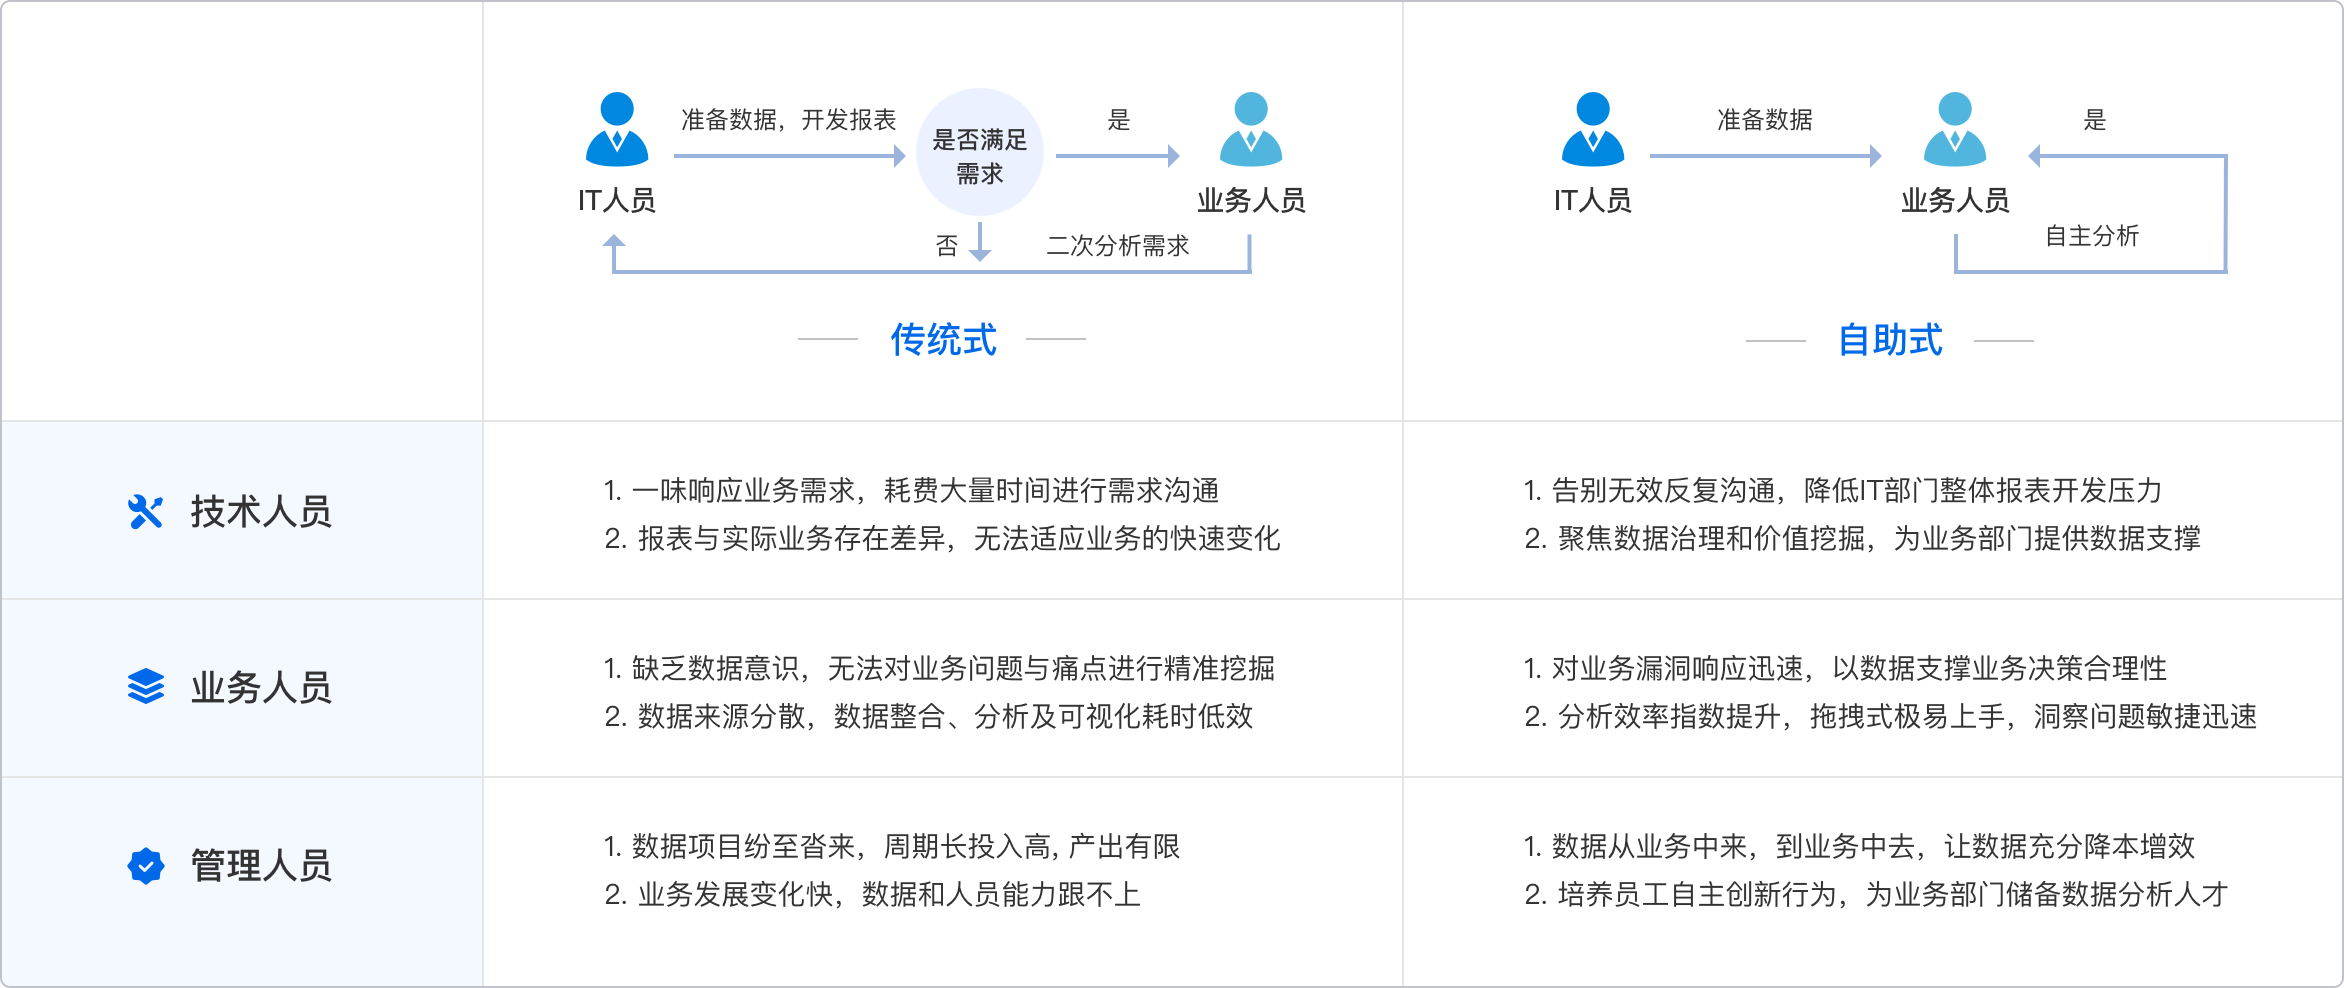
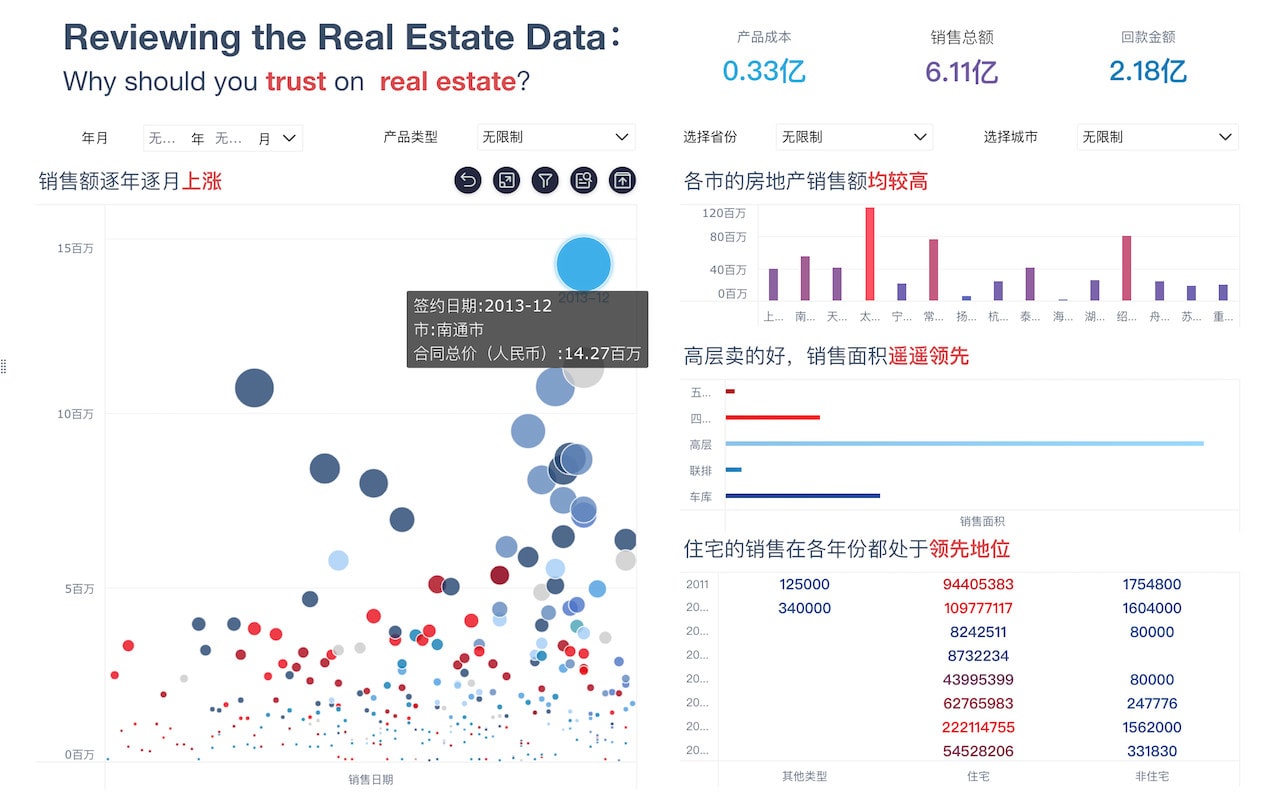
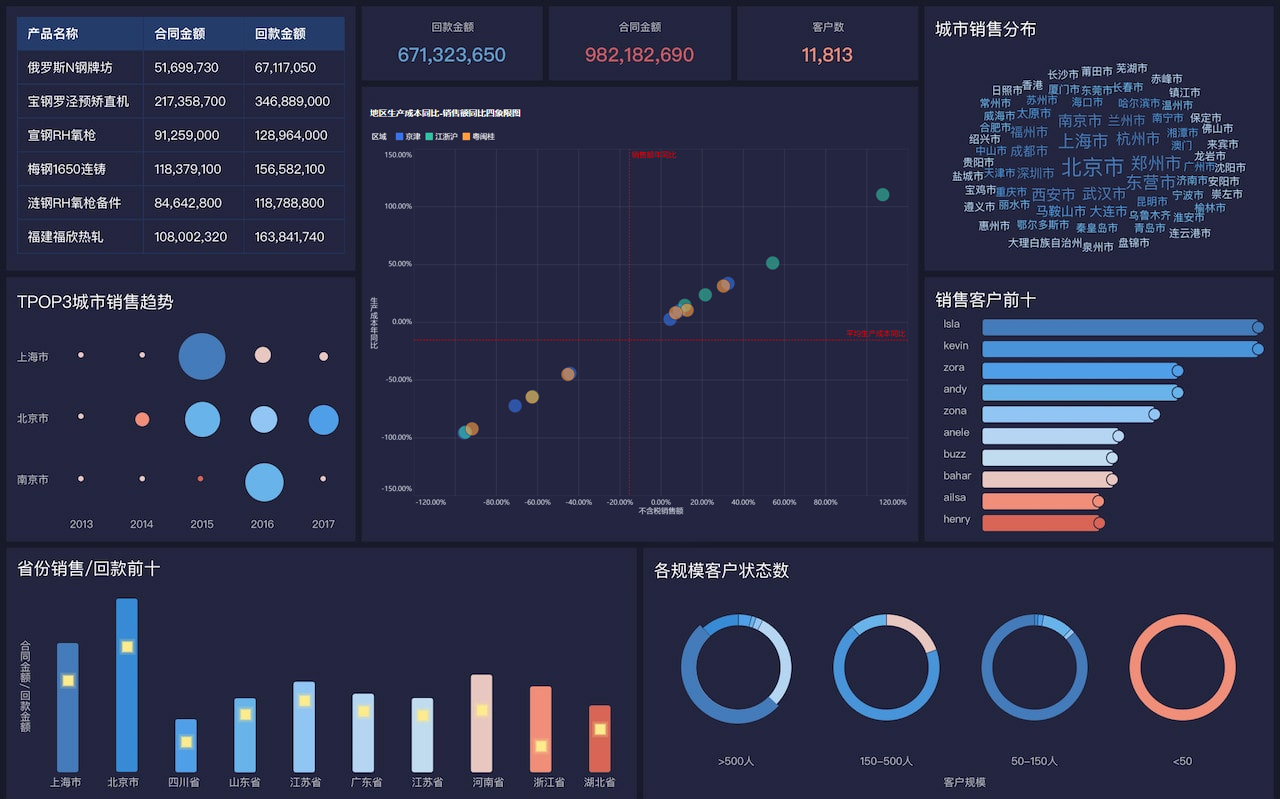
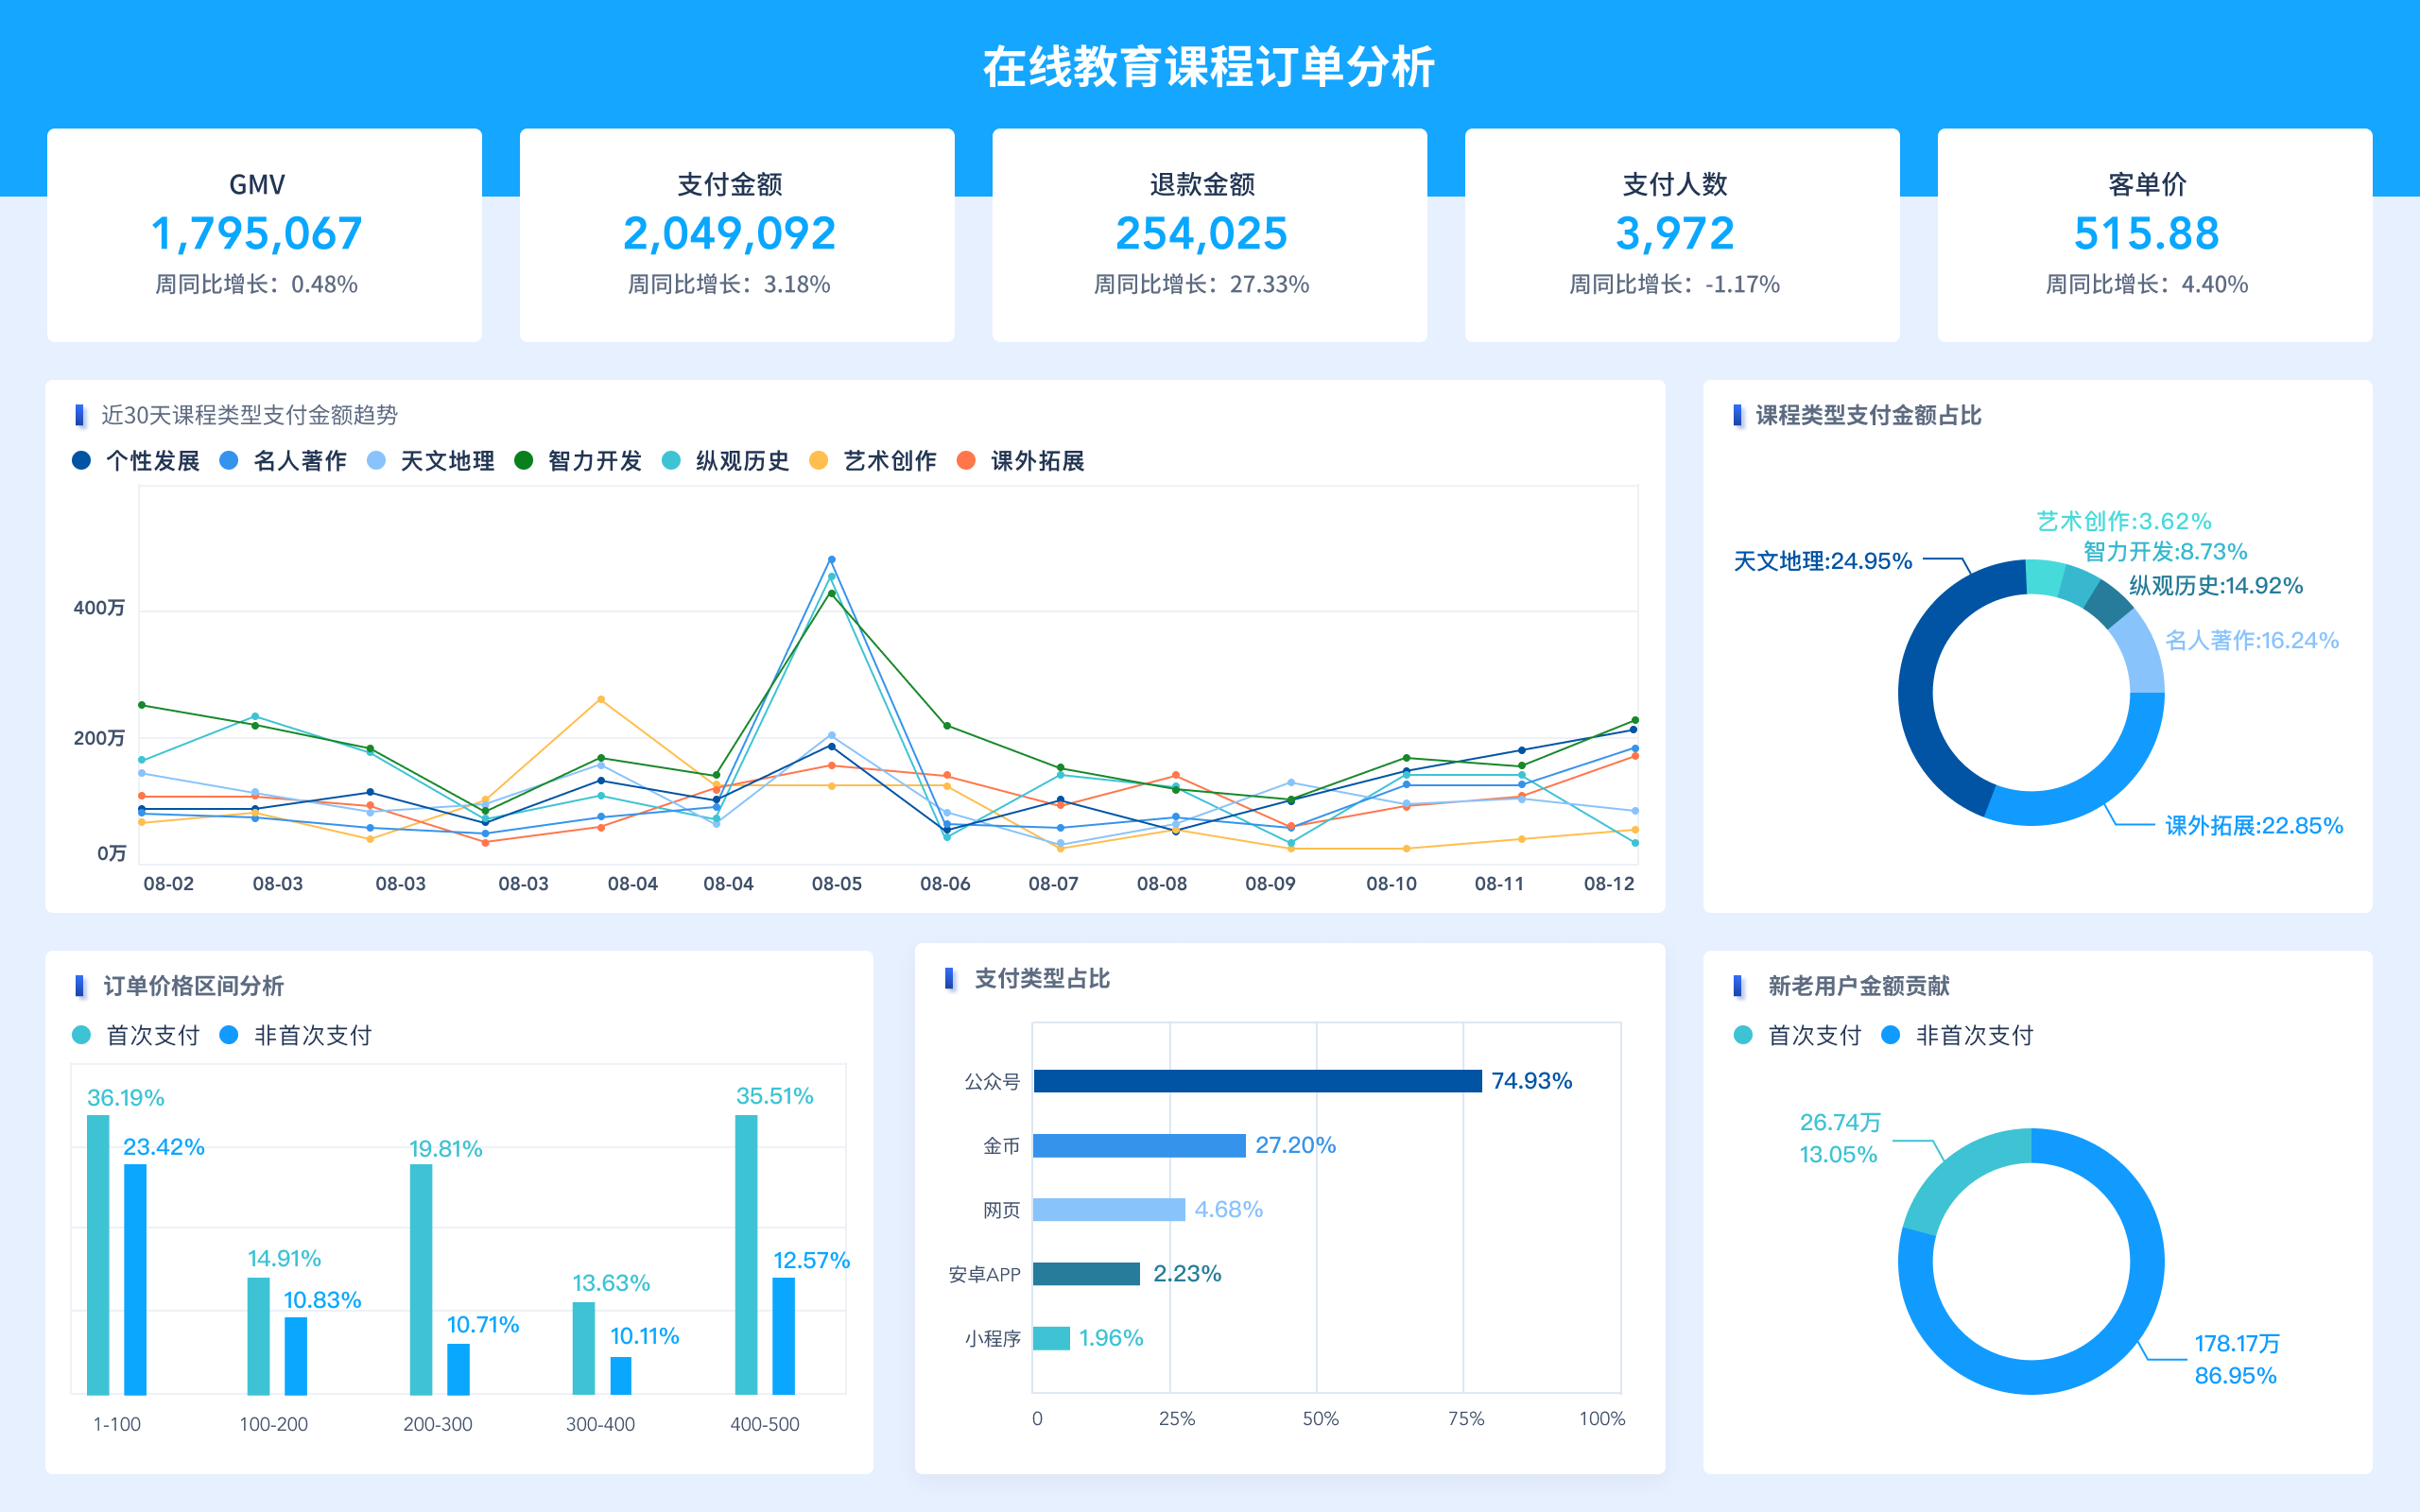
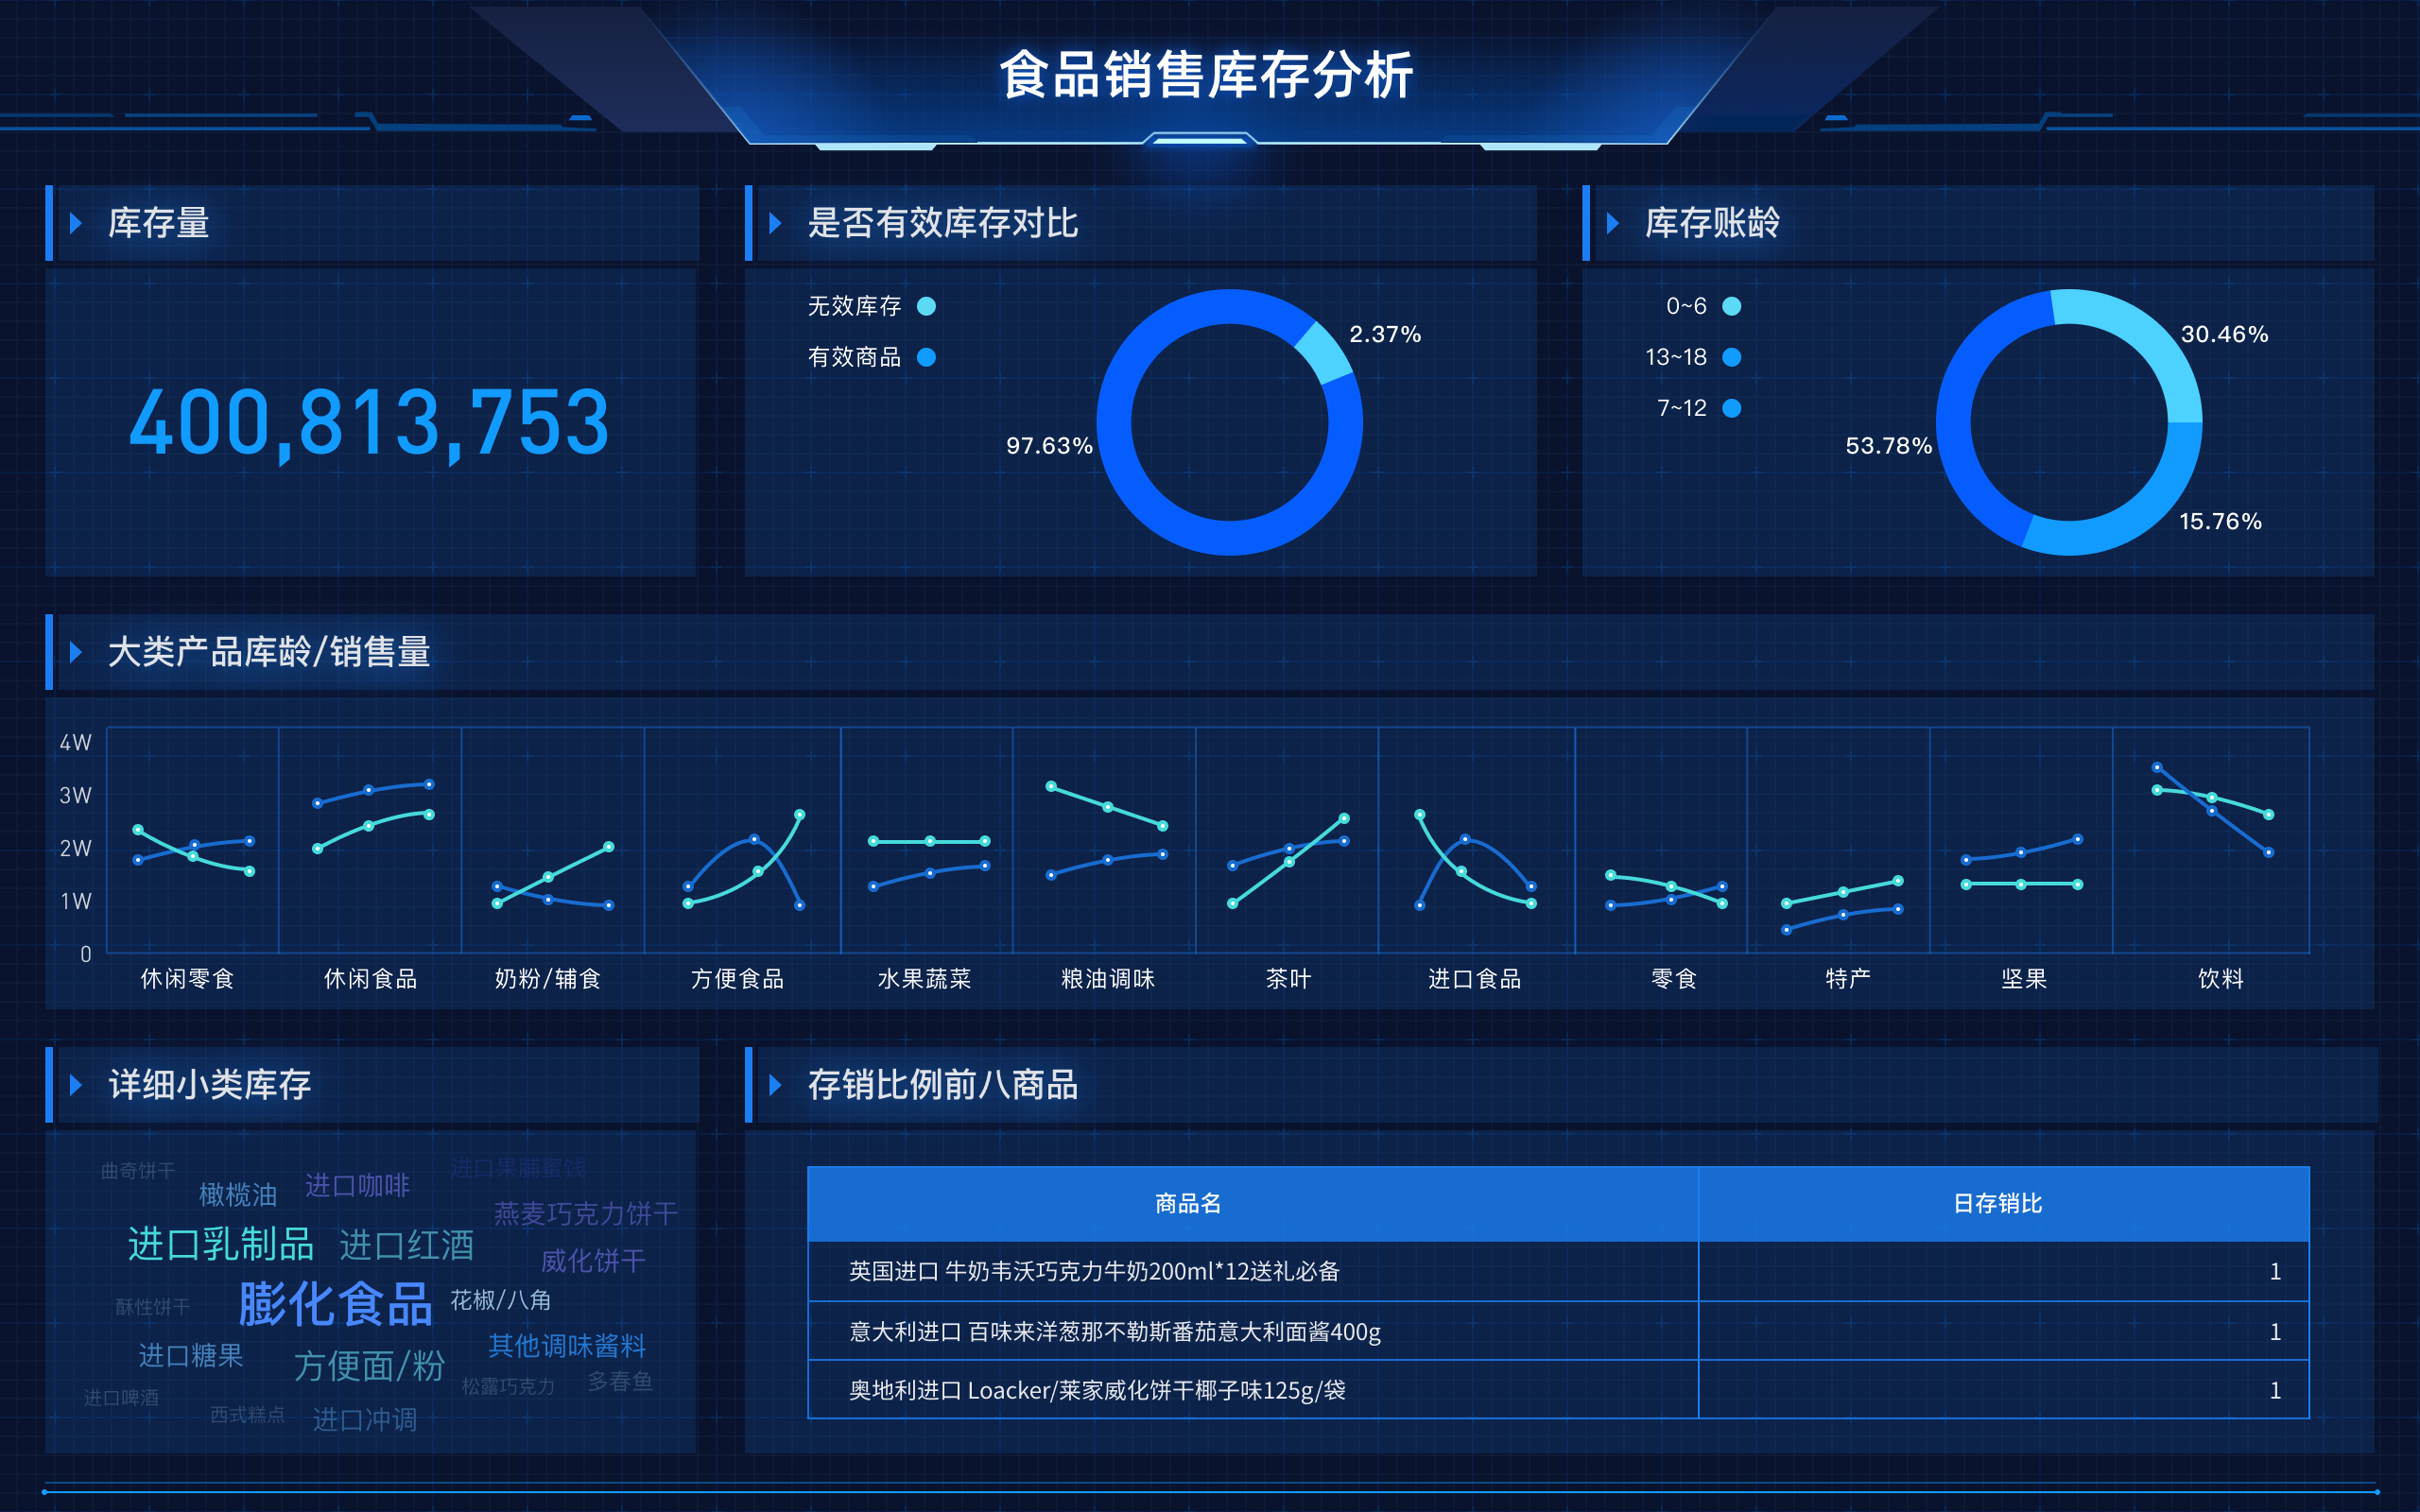
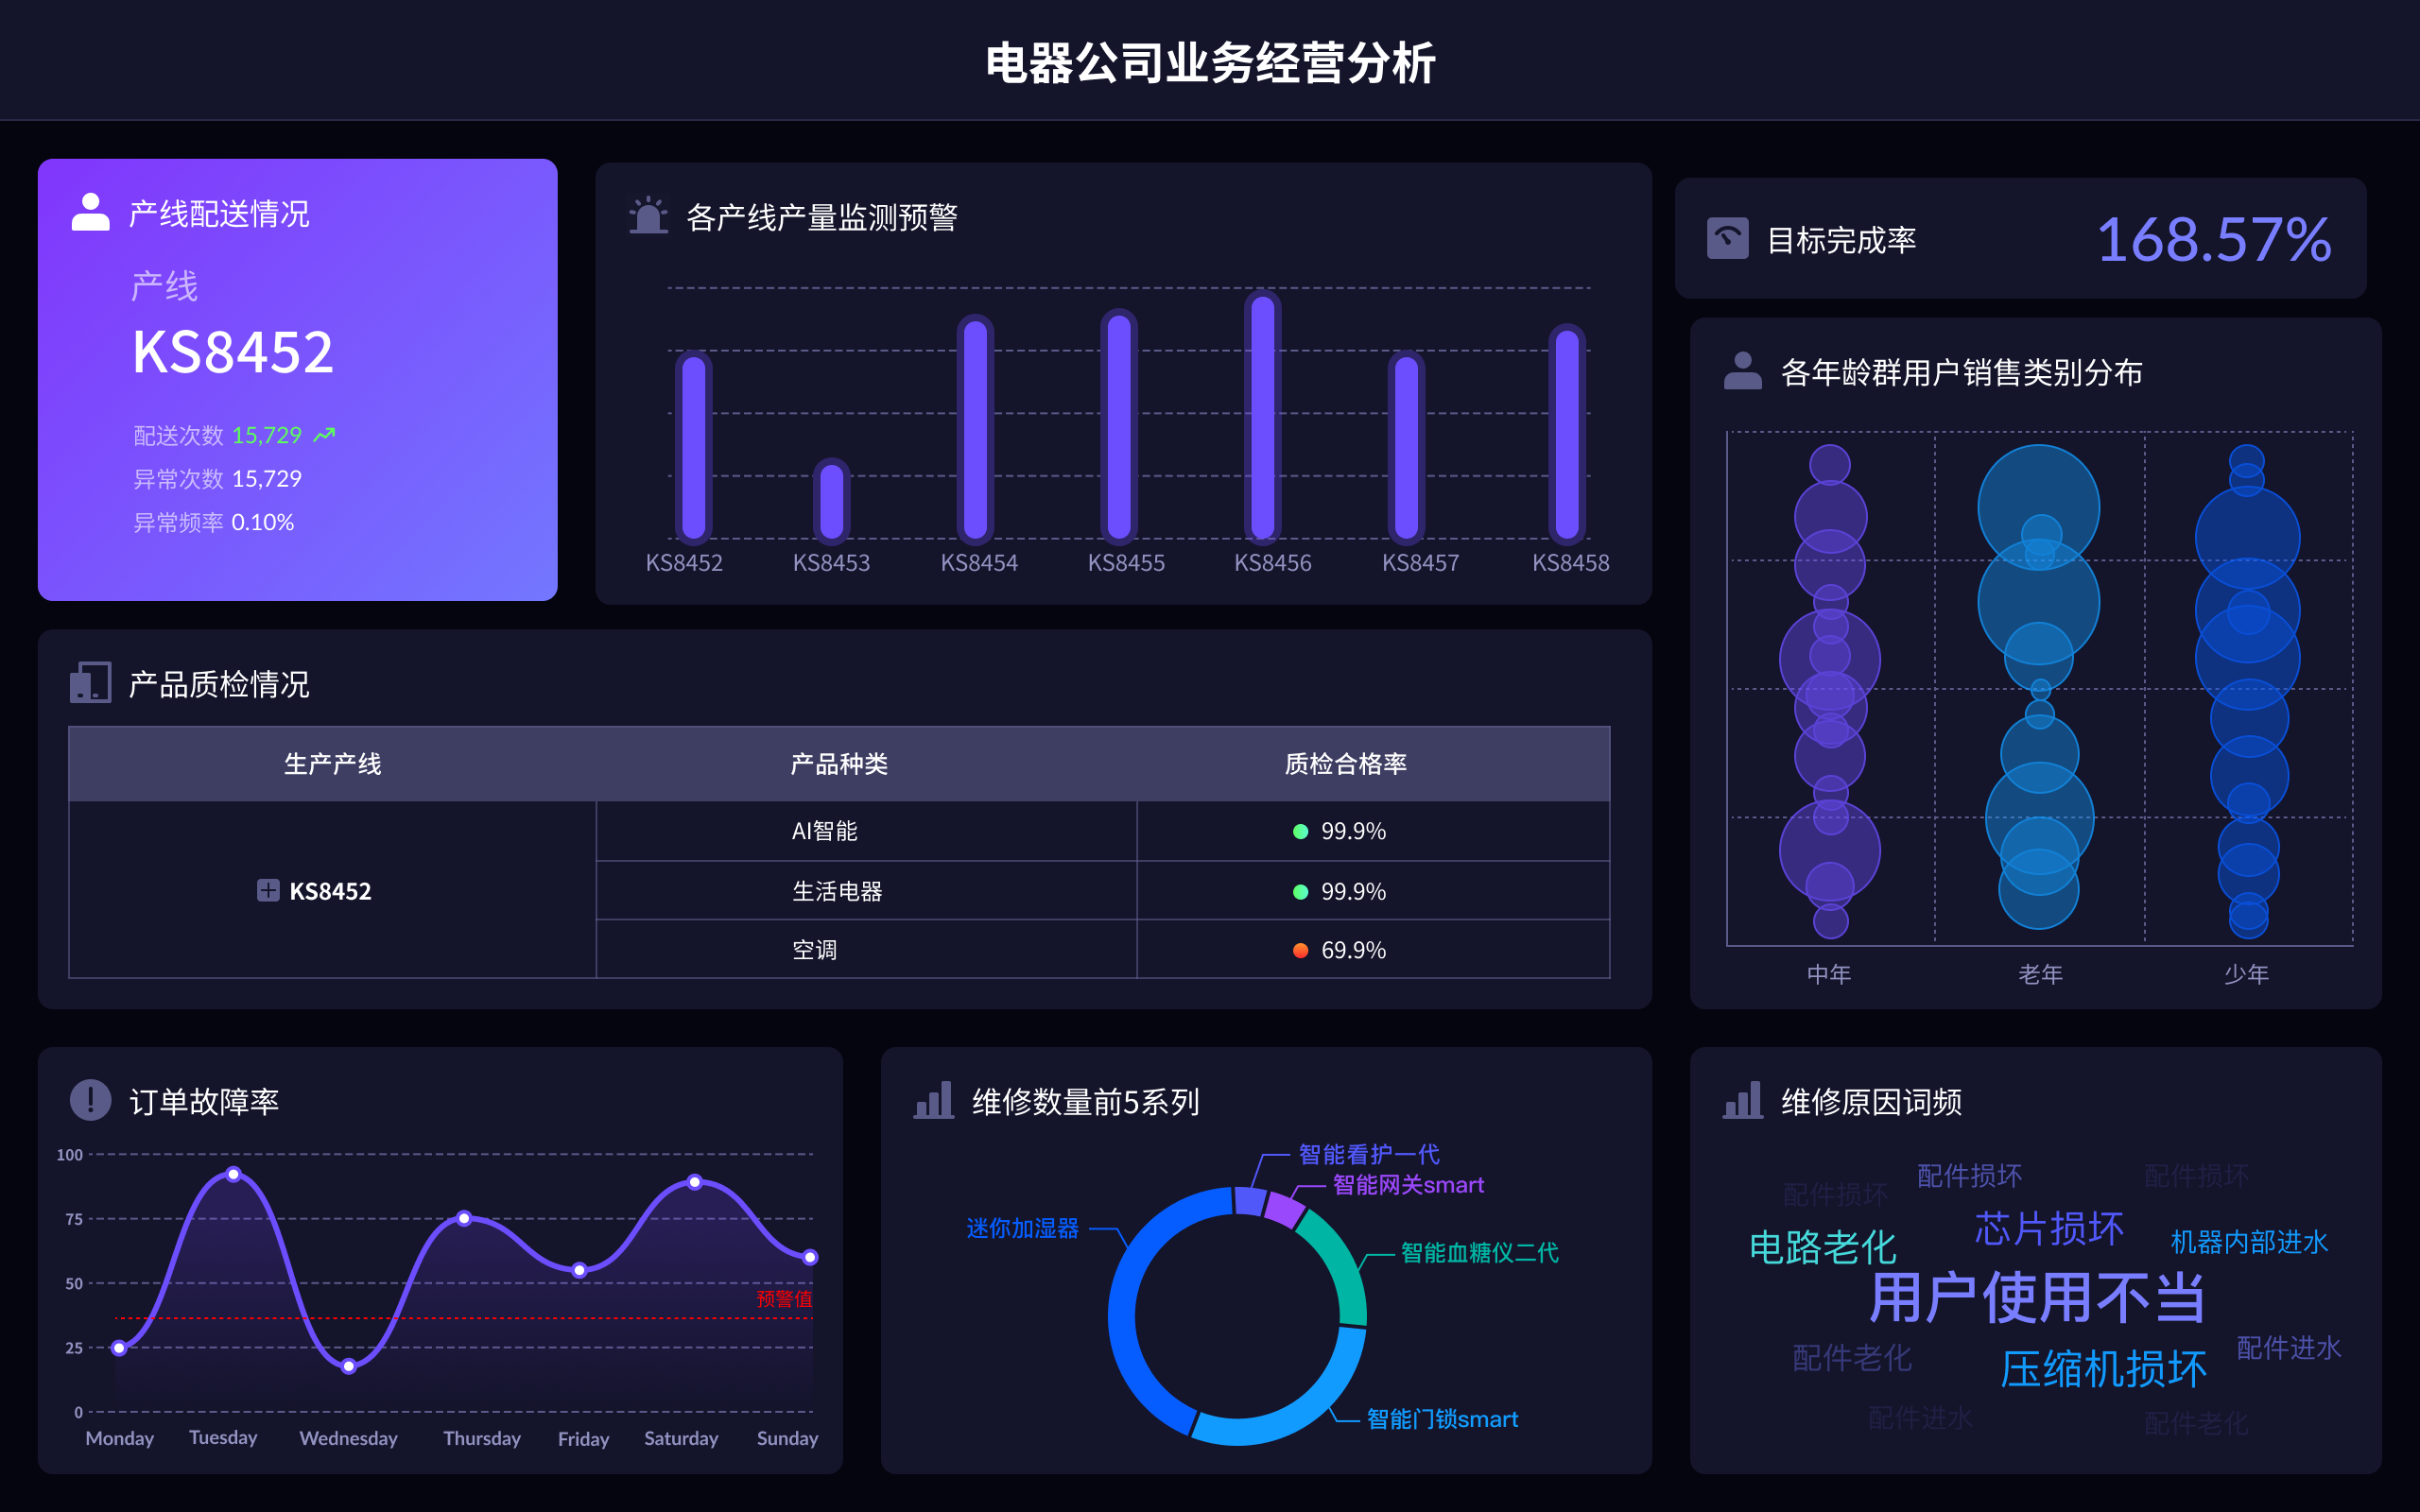
The term 'financial operational analysis' in English can be translated as "Financial Operational Analysis". This phrase encompasses the comprehensive evaluation and scrutiny of a company's financial performance and operational efficiency. Financial operational analysis involves examining various financial statements, key performance indicators (KPIs), and other relevant data to assess the company's profitability, liquidity, solvency, and overall financial health.
一、WHAT IS FINANCIAL OPERATIONAL ANALYSIS
Financial Operational Analysis refers to the process of examining and interpreting a company's financial data to understand its operational efficiency and financial health. This analysis includes evaluating financial statements such as income statements, balance sheets, and cash flow statements. It also involves the calculation and interpretation of various financial ratios and metrics. The objective is to provide insights into the company's financial performance, identify strengths and weaknesses, and inform strategic decision-making.
A crucial aspect of financial operational analysis is the use of key performance indicators (KPIs). These metrics help measure specific aspects of the company's performance, such as profitability, liquidity, and solvency. For example, common KPIs include the current ratio, return on equity (ROE), and debt-to-equity ratio. By analyzing these indicators, analysts can determine how well the company is managing its resources and whether it is on track to achieve its financial goals.
二、IMPORTANCE OF FINANCIAL OPERATIONAL ANALYSIS
Financial Operational Analysis is essential for several reasons. It helps businesses understand their financial position, which is crucial for making informed decisions. For instance, by analyzing financial data, companies can identify trends and patterns that may indicate potential risks or opportunities. This analysis also enables businesses to evaluate their performance against industry benchmarks and competitors.
Moreover, financial operational analysis provides insights into a company's profitability. By examining revenue, expenses, and profit margins, analysts can determine whether the business is generating sufficient returns on its investments. This information is vital for investors, as it helps them assess the company's potential for future growth and profitability.
Additionally, financial operational analysis is critical for managing cash flow. By evaluating cash flow statements, businesses can identify areas where they may be experiencing cash shortages or surpluses. This information allows them to take corrective actions, such as adjusting their budgeting and spending strategies, to ensure they have adequate cash reserves to meet their obligations.
三、KEY COMPONENTS OF FINANCIAL OPERATIONAL ANALYSIS
Financial Operational Analysis involves several key components, including:
-
Financial Statements: These documents provide a comprehensive overview of a company's financial performance. The three main financial statements are the income statement, balance sheet, and cash flow statement. Each statement provides different insights into the company's financial health.
-
Financial Ratios: These ratios are used to evaluate various aspects of the company's financial performance. Common financial ratios include the current ratio, quick ratio, debt-to-equity ratio, and return on equity. By analyzing these ratios, analysts can assess the company's liquidity, solvency, and profitability.
-
Trend Analysis: This involves examining historical financial data to identify patterns and trends. Trend analysis helps analysts understand how the company's financial performance has changed over time and predict future performance.
-
Benchmarking: This process involves comparing the company's financial performance against industry standards and competitors. Benchmarking helps identify areas where the company may be underperforming and provides insights into how it can improve.
四、TOOLS AND TECHNIQUES FOR FINANCIAL OPERATIONAL ANALYSIS
Financial Operational Analysis requires various tools and techniques to effectively analyze and interpret financial data. Some of the most commonly used tools include:
-
Spreadsheet Software: Programs like Microsoft Excel are widely used for financial analysis. They allow analysts to organize and manipulate financial data, perform calculations, and create charts and graphs to visualize the data.
-
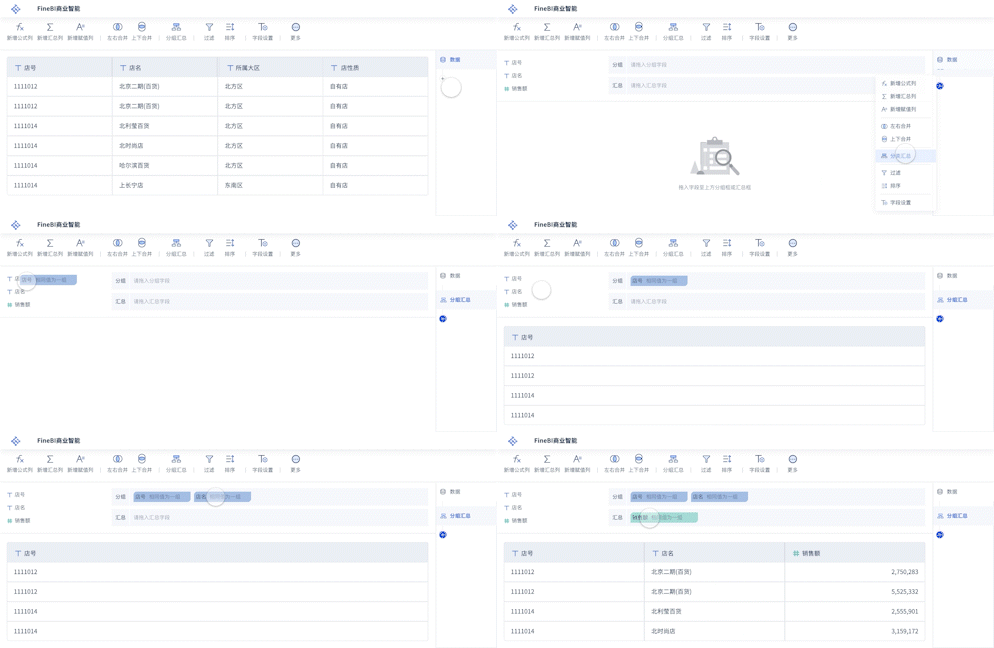
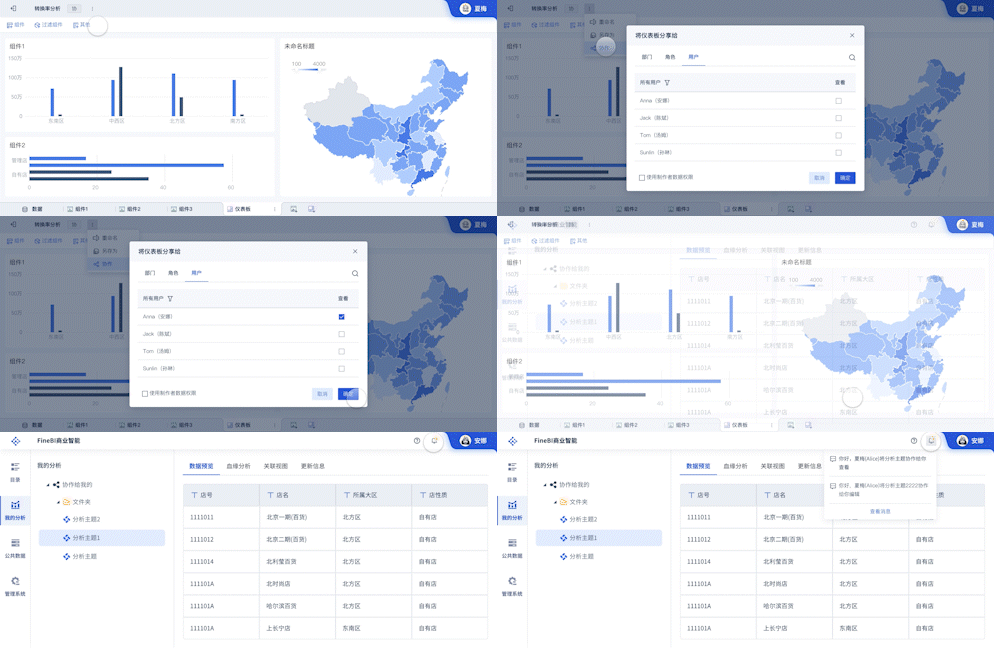
Financial Analysis Software: Specialized software, such as FineBI, can automate many aspects of financial analysis. These tools provide advanced features like data visualization, real-time reporting, and predictive analytics. FineBI, a product of Fanruan, is an excellent example of such software. It offers a range of features that make financial analysis more efficient and accurate. Visit the FineBI website at https://s.fanruan.com/f459r for more information.
-
Statistical Techniques: Statistical methods, such as regression analysis, can be used to identify relationships between different financial variables. These techniques help analysts understand the factors that influence the company's financial performance and make more accurate forecasts.
五、BEST PRACTICES FOR FINANCIAL OPERATIONAL ANALYSIS
To conduct effective Financial Operational Analysis, it is essential to follow certain best practices:
-
Use Accurate and Up-to-Date Data: Ensure that the financial data used for analysis is accurate and up-to-date. This is crucial for making reliable and informed decisions.
-
Focus on Relevant Metrics: Identify and focus on the most relevant financial metrics for the company's specific industry and business model. This will help provide more meaningful insights.
-
Regular Monitoring: Conduct financial operational analysis regularly to keep track of the company's financial performance. This will help identify any issues early and take corrective actions promptly.
-
Involve Key Stakeholders: Involve key stakeholders, such as management, investors, and financial analysts, in the analysis process. Their input and feedback can provide valuable insights and improve the accuracy of the analysis.
-
Leverage Technology: Utilize advanced financial analysis tools and software, such as FineBI, to streamline the analysis process and improve accuracy. These tools can automate many aspects of financial analysis, making it more efficient and effective.
六、CHALLENGES IN FINANCIAL OPERATIONAL ANALYSIS
Financial Operational Analysis can be challenging due to several factors:
-
Data Quality: Ensuring the accuracy and completeness of financial data can be difficult. Poor-quality data can lead to inaccurate analysis and misleading conclusions.
-
Complexity: Financial analysis can be complex, especially for large organizations with multiple business units and subsidiaries. Analyzing and interpreting vast amounts of financial data can be time-consuming and require specialized skills.
-
Changing Regulations: Financial regulations and accounting standards are constantly evolving. Staying updated with these changes and ensuring compliance can be challenging for businesses.
-
Bias and Subjectivity: Financial analysis involves a certain degree of judgment and interpretation. Analysts may have biases that can influence their conclusions. It is essential to maintain objectivity and rely on accurate data and sound analytical methods.
-
Integration of Non-Financial Data: Incorporating non-financial data, such as market trends and economic indicators, into financial analysis can provide a more comprehensive view of the company's performance. However, integrating and analyzing this data can be challenging.
七、CONCLUSION
Financial Operational Analysis is a vital process for understanding a company's financial health and operational efficiency. By analyzing financial statements, ratios, and KPIs, businesses can gain valuable insights into their performance and make informed strategic decisions. Utilizing advanced tools like FineBI can enhance the accuracy and efficiency of the analysis process. However, it is essential to follow best practices and address the challenges associated with financial analysis to ensure reliable and meaningful results. For more information on FineBI, visit their website at https://s.fanruan.com/f459r.
相关问答FAQs:
财务经营分析英语怎么写?
在商业和财务领域,财务经营分析是一项重要的技能。它不仅仅是对财务数据的简单审查,更涉及到对企业整体经营状况的深入理解和评价。财务经营分析的英语表达通常是“Financial Performance Analysis”或者“Financial and Operational Analysis”。在撰写相关内容时,通常会包括几个关键部分,如财务报表分析、比率分析、现金流分析等。
在撰写财务经营分析时,以下几个方面非常重要:
-
财务报表的基本理解:财务报表是企业财务状况的综合体现,通常包括资产负债表、损益表和现金流量表。理解这些报表的结构和内容是进行财务经营分析的基础。在英语中,可以使用“balance sheet”(资产负债表)、“income statement”(损益表)、和“cash flow statement”(现金流量表)来描述这些内容。
-
比率分析:比率分析是一种常用的财务分析工具,通过计算不同财务指标之间的比率,帮助分析师了解企业的盈利能力、流动性和偿债能力等。常见的财务比率包括流动比率(current ratio)、速动比率(quick ratio)、净利润率(net profit margin)等。在撰写时,可以用“ratio analysis”来描述这一部分。
-
趋势分析:趋势分析是观察企业财务数据随时间变化的方式,帮助识别潜在问题和机会。通过对比多个时期的数据,可以判断企业的经营状况是否在改善或恶化。在英语中,可以使用“trend analysis”进行描述。
-
行业比较:将企业的财务表现与行业内其他企业进行比较,可以更全面地理解其市场地位。可以使用“industry comparison”或“benchmarking”来表示这一分析。
-
现金流分析:现金流是企业生存和发展的关键,现金流分析可以帮助企业了解其资金的来源和去向,确保其能够应对短期和长期的财务需求。在英语中,通常使用“cash flow analysis”来描述。
通过以上几个方面的深入分析,企业能够更清晰地了解自己的财务状况,从而做出更为明智的经营决策。撰写财务经营分析报告时,保持语言简洁明了、数据准确是至关重要的。希望这些信息能帮助到您更好地理解“财务经营分析”的英语表达及其相关内容。
本文内容通过AI工具匹配关键字智能整合而成,仅供参考,帆软不对内容的真实、准确或完整作任何形式的承诺。具体产品功能请以帆软官方帮助文档为准,或联系您的对接销售进行咨询。如有其他问题,您可以通过联系blog@fanruan.com进行反馈,帆软收到您的反馈后将及时答复和处理。