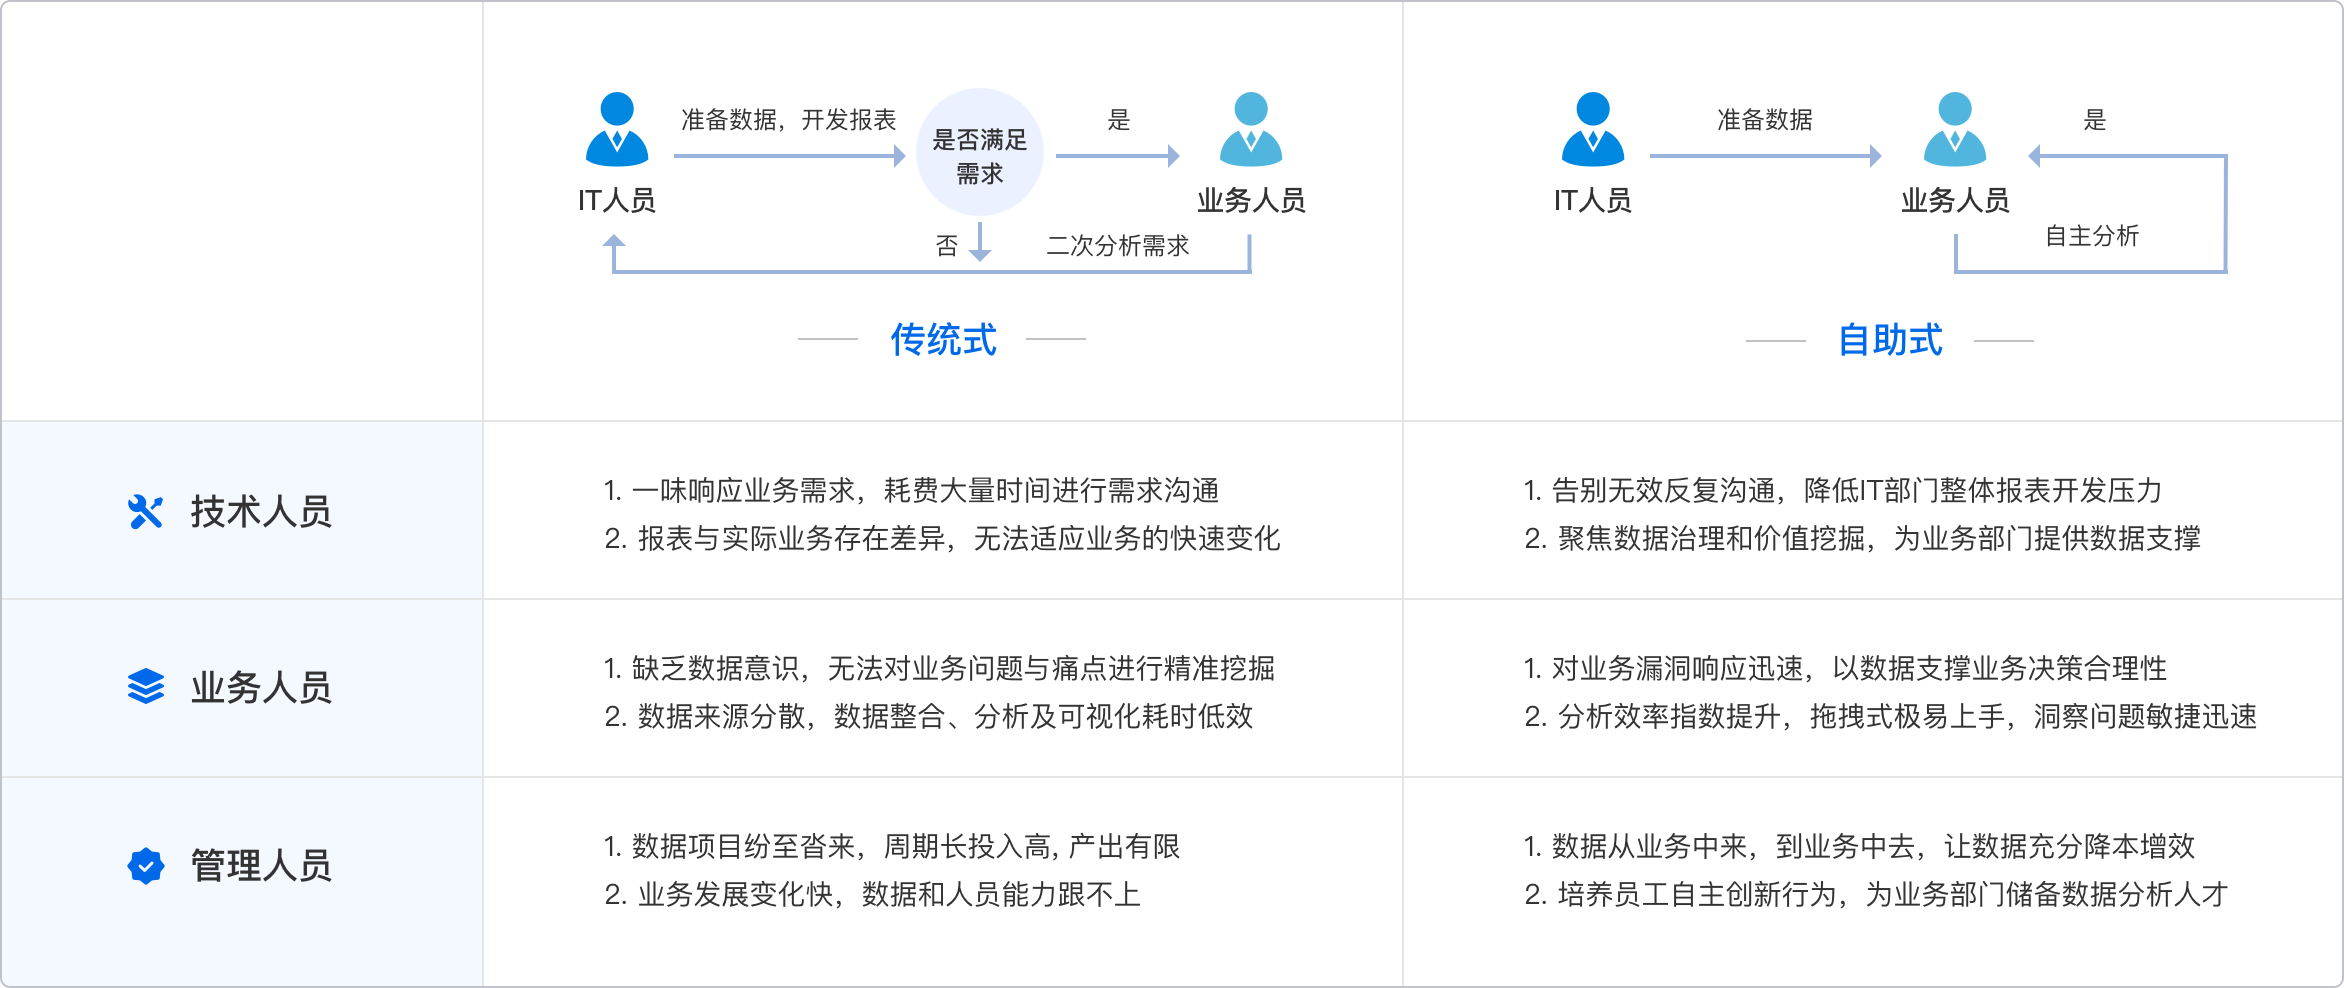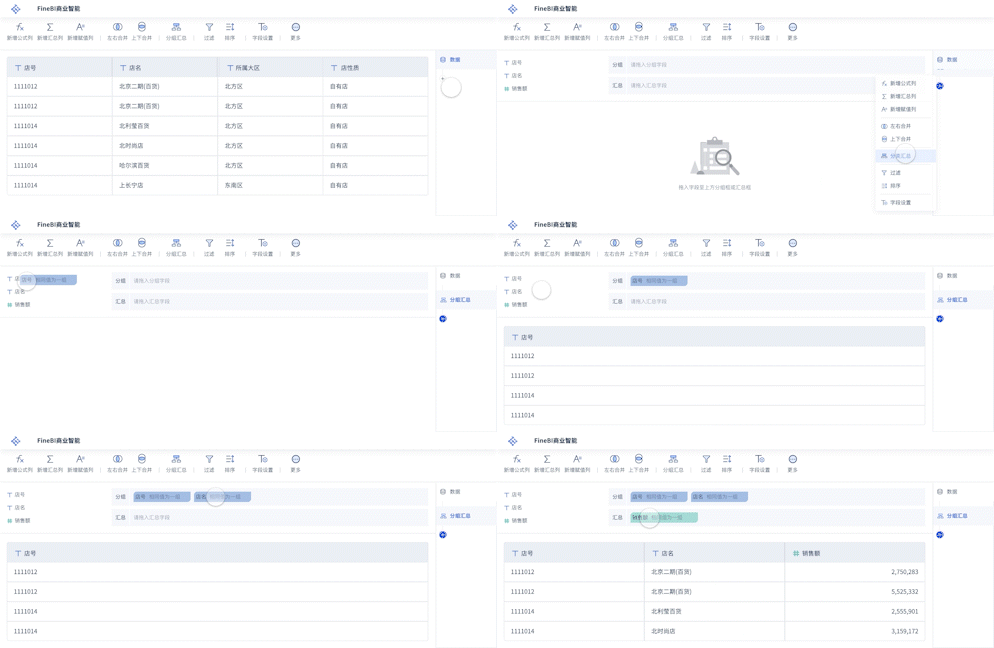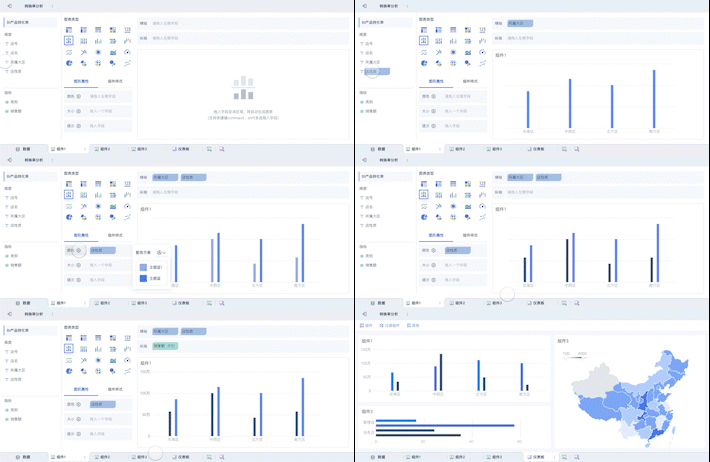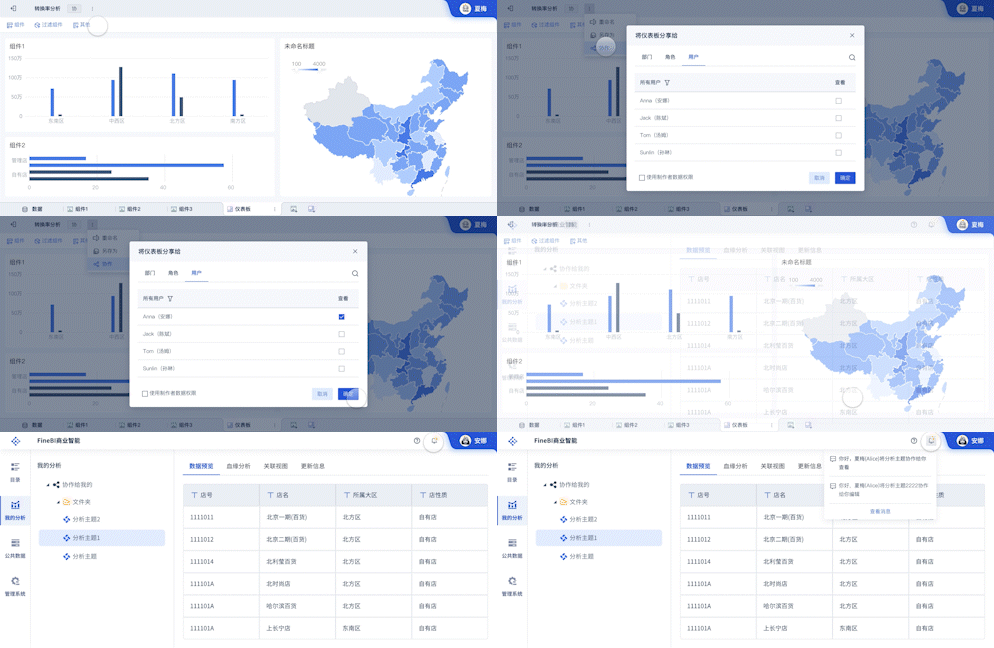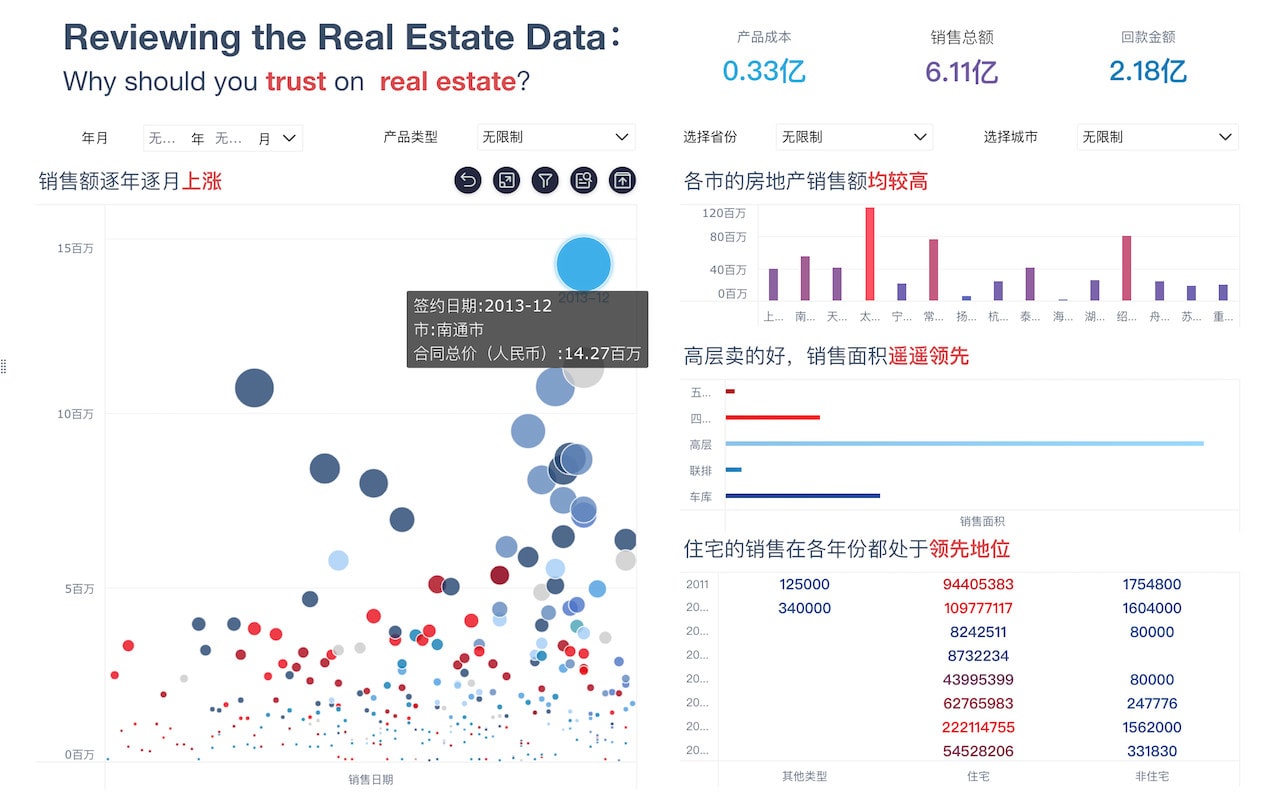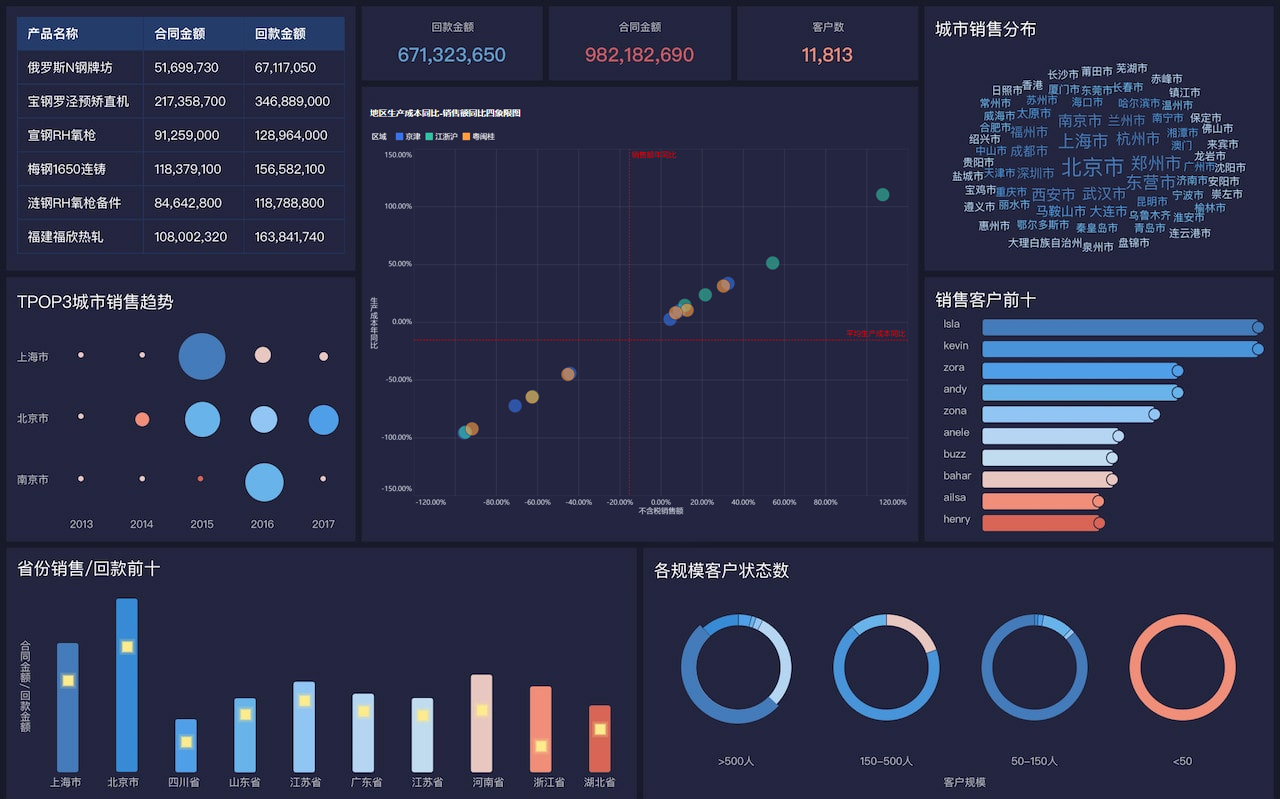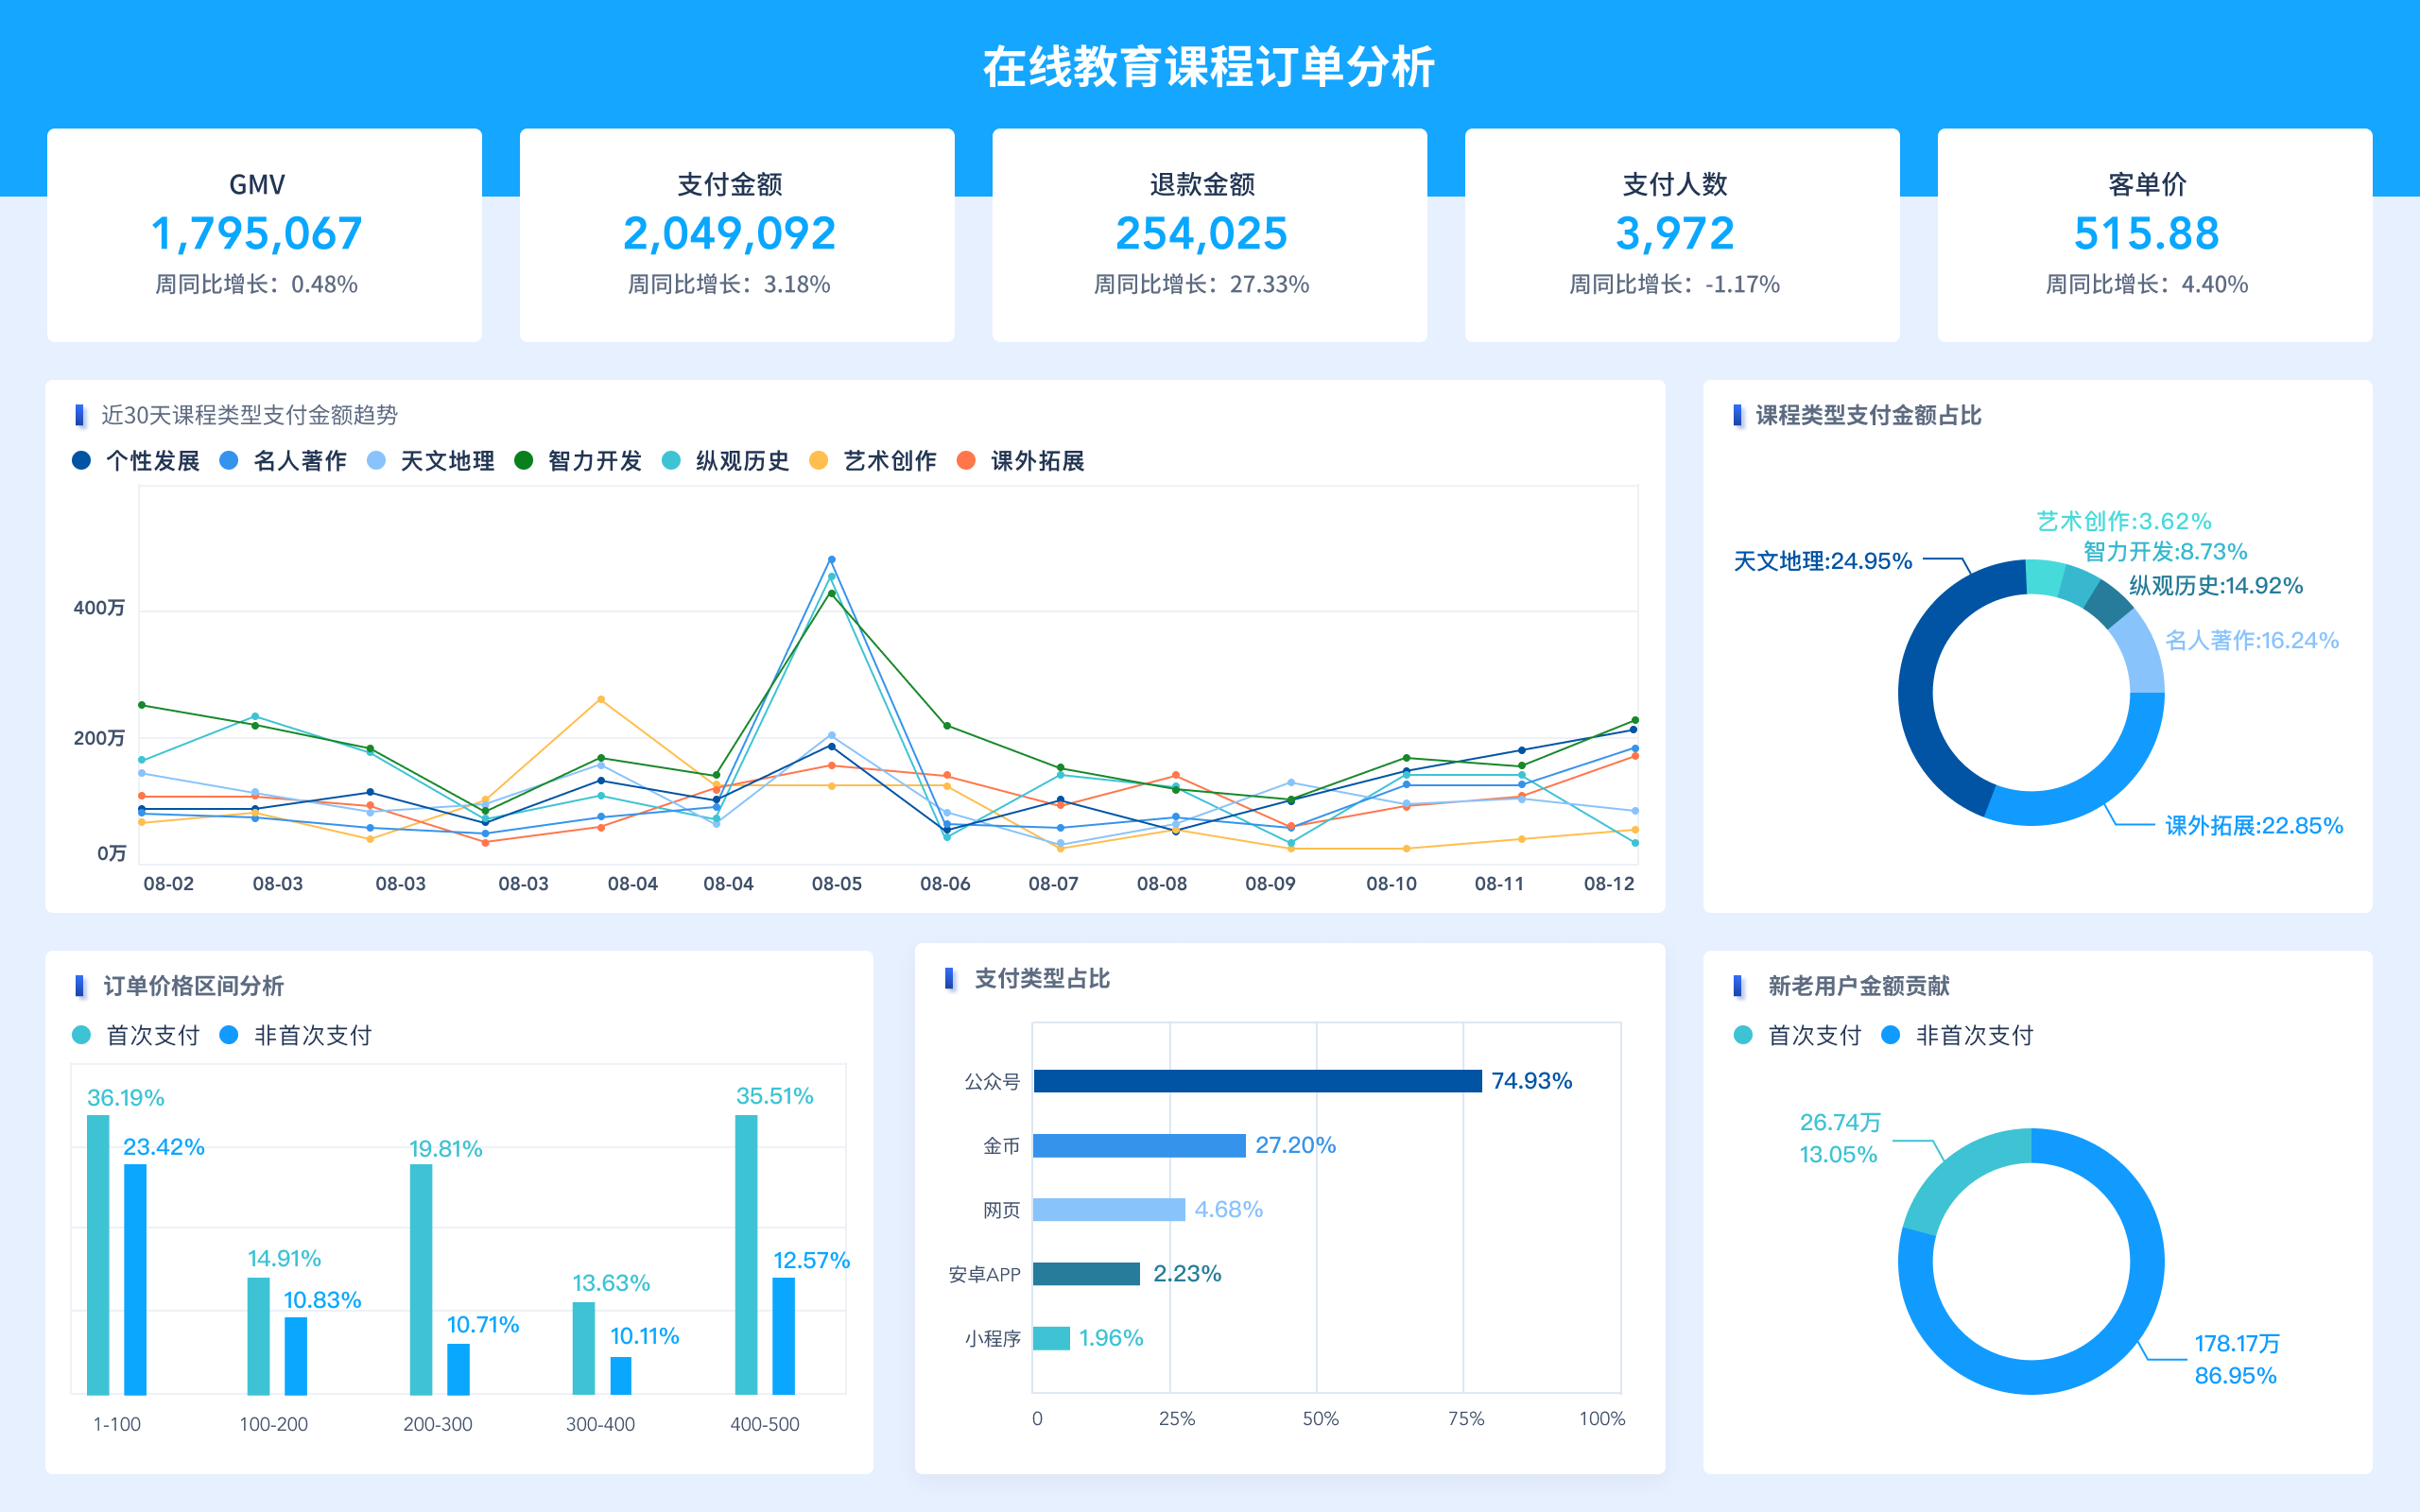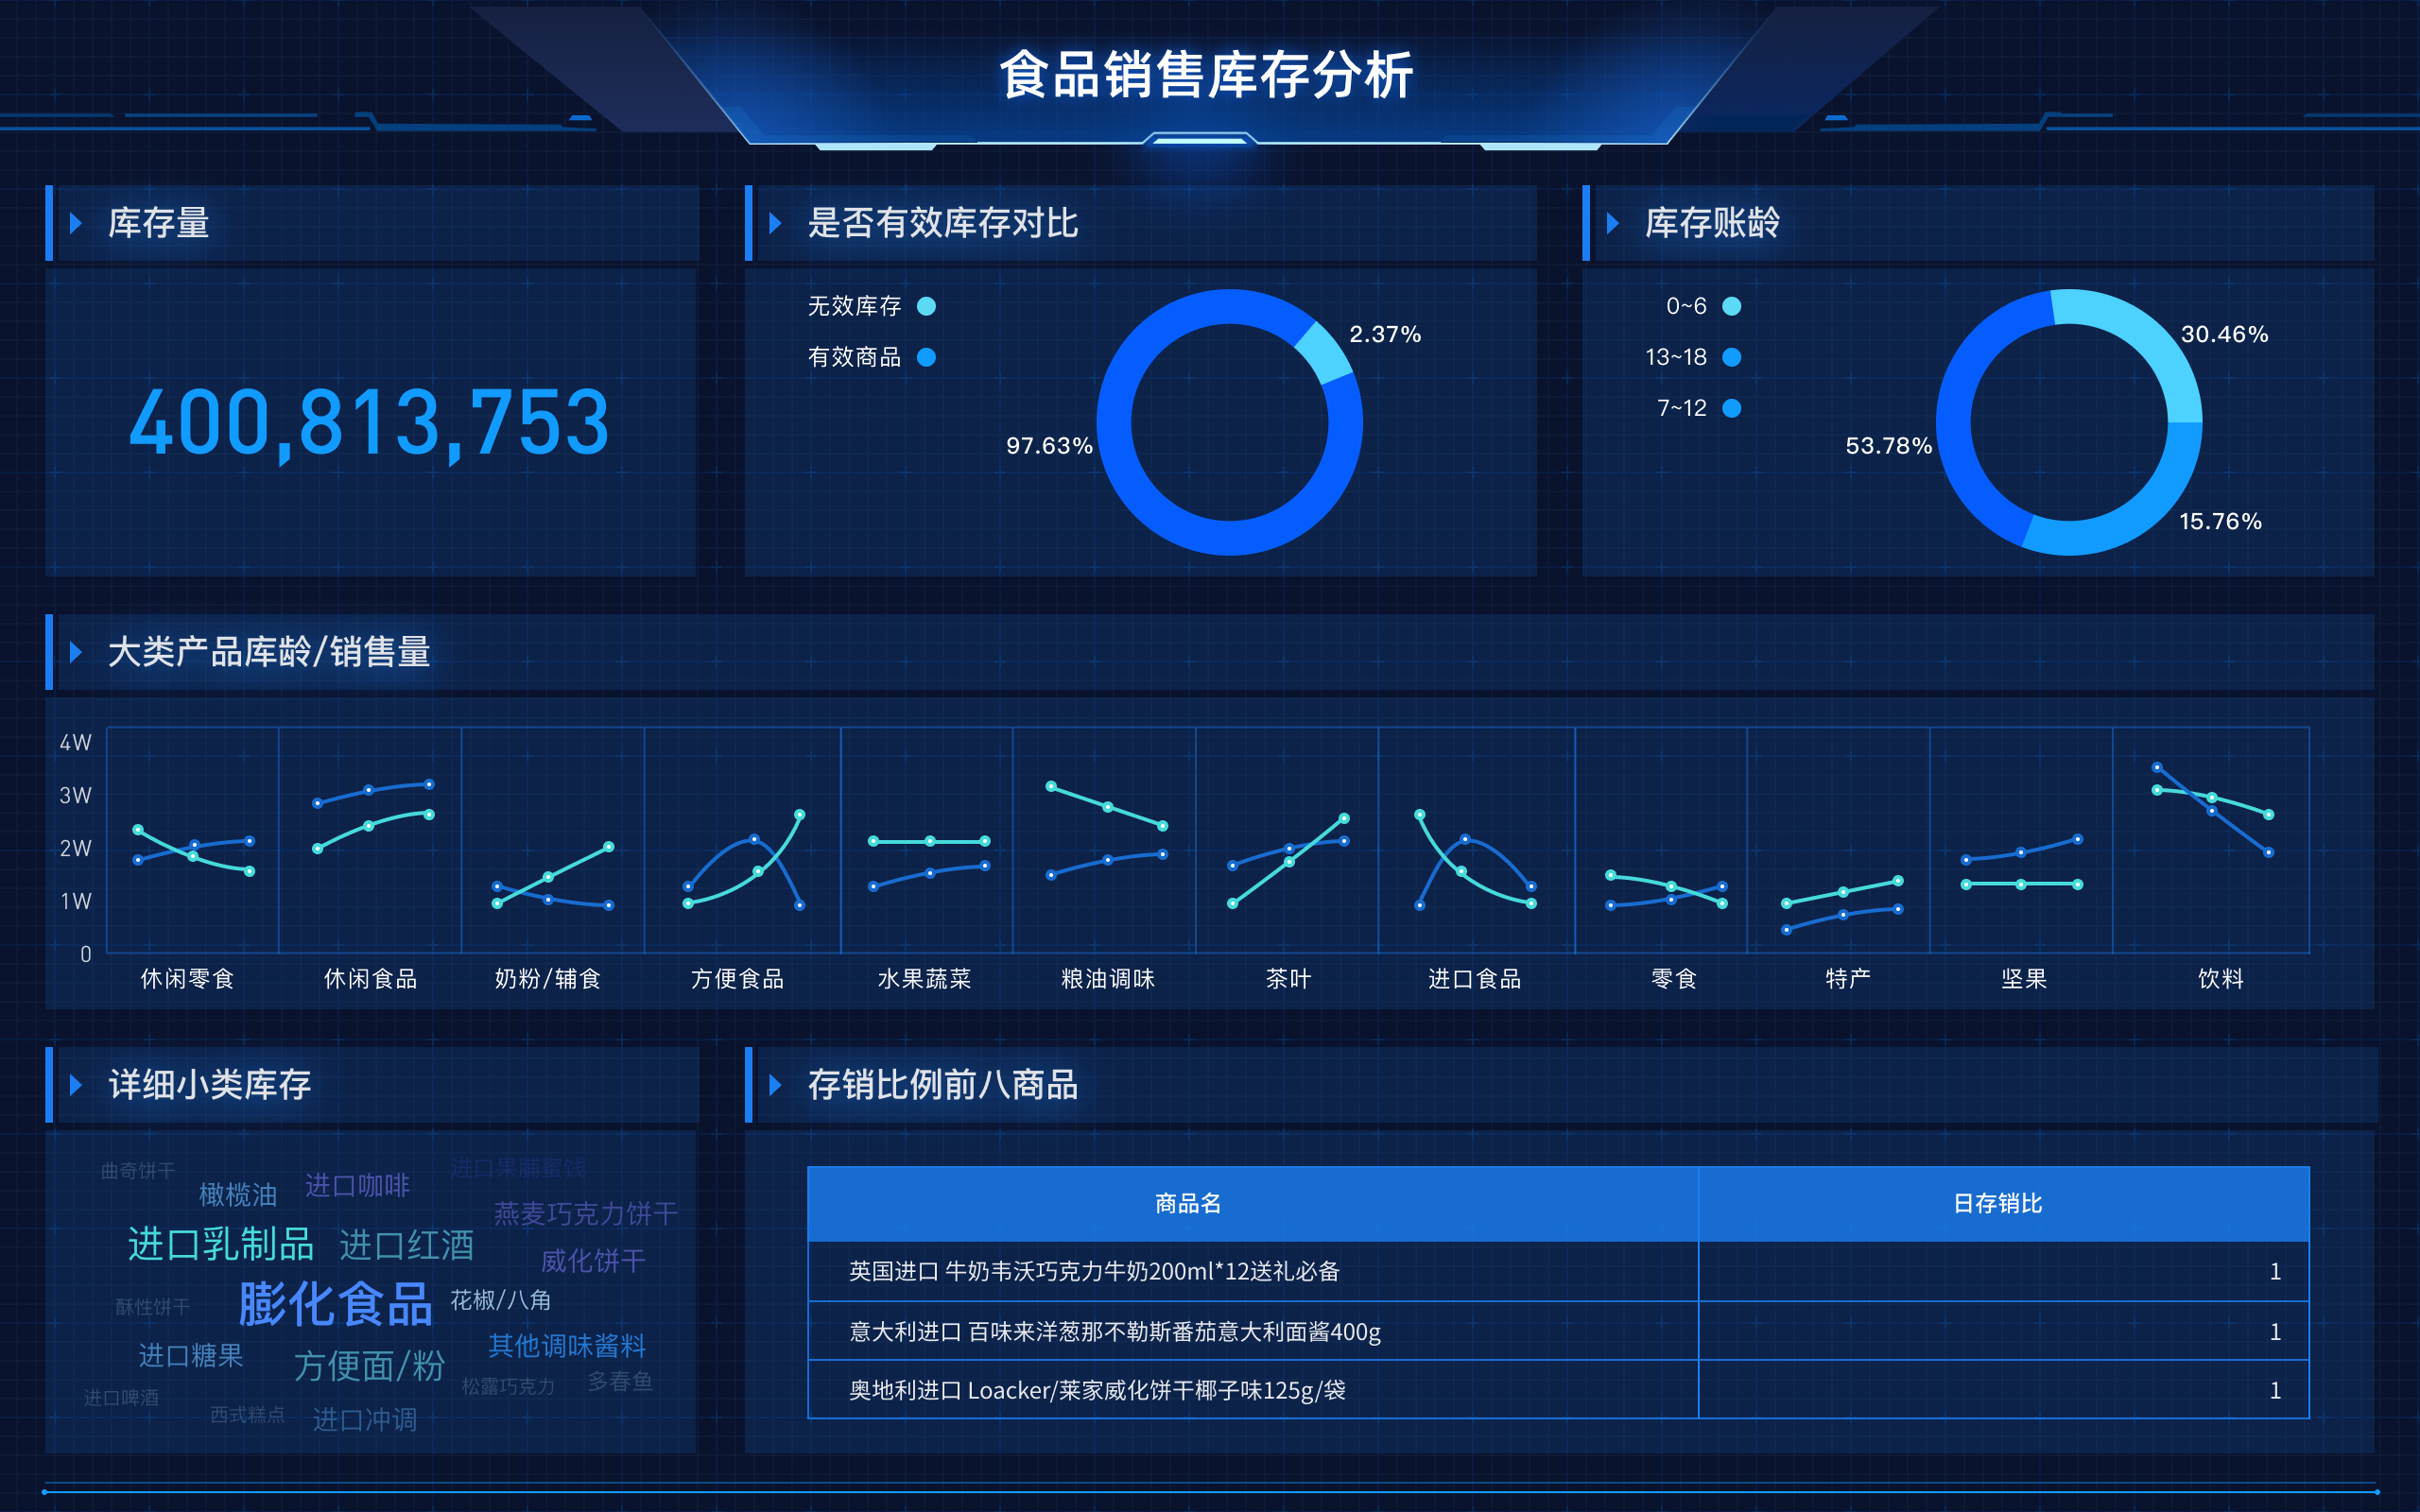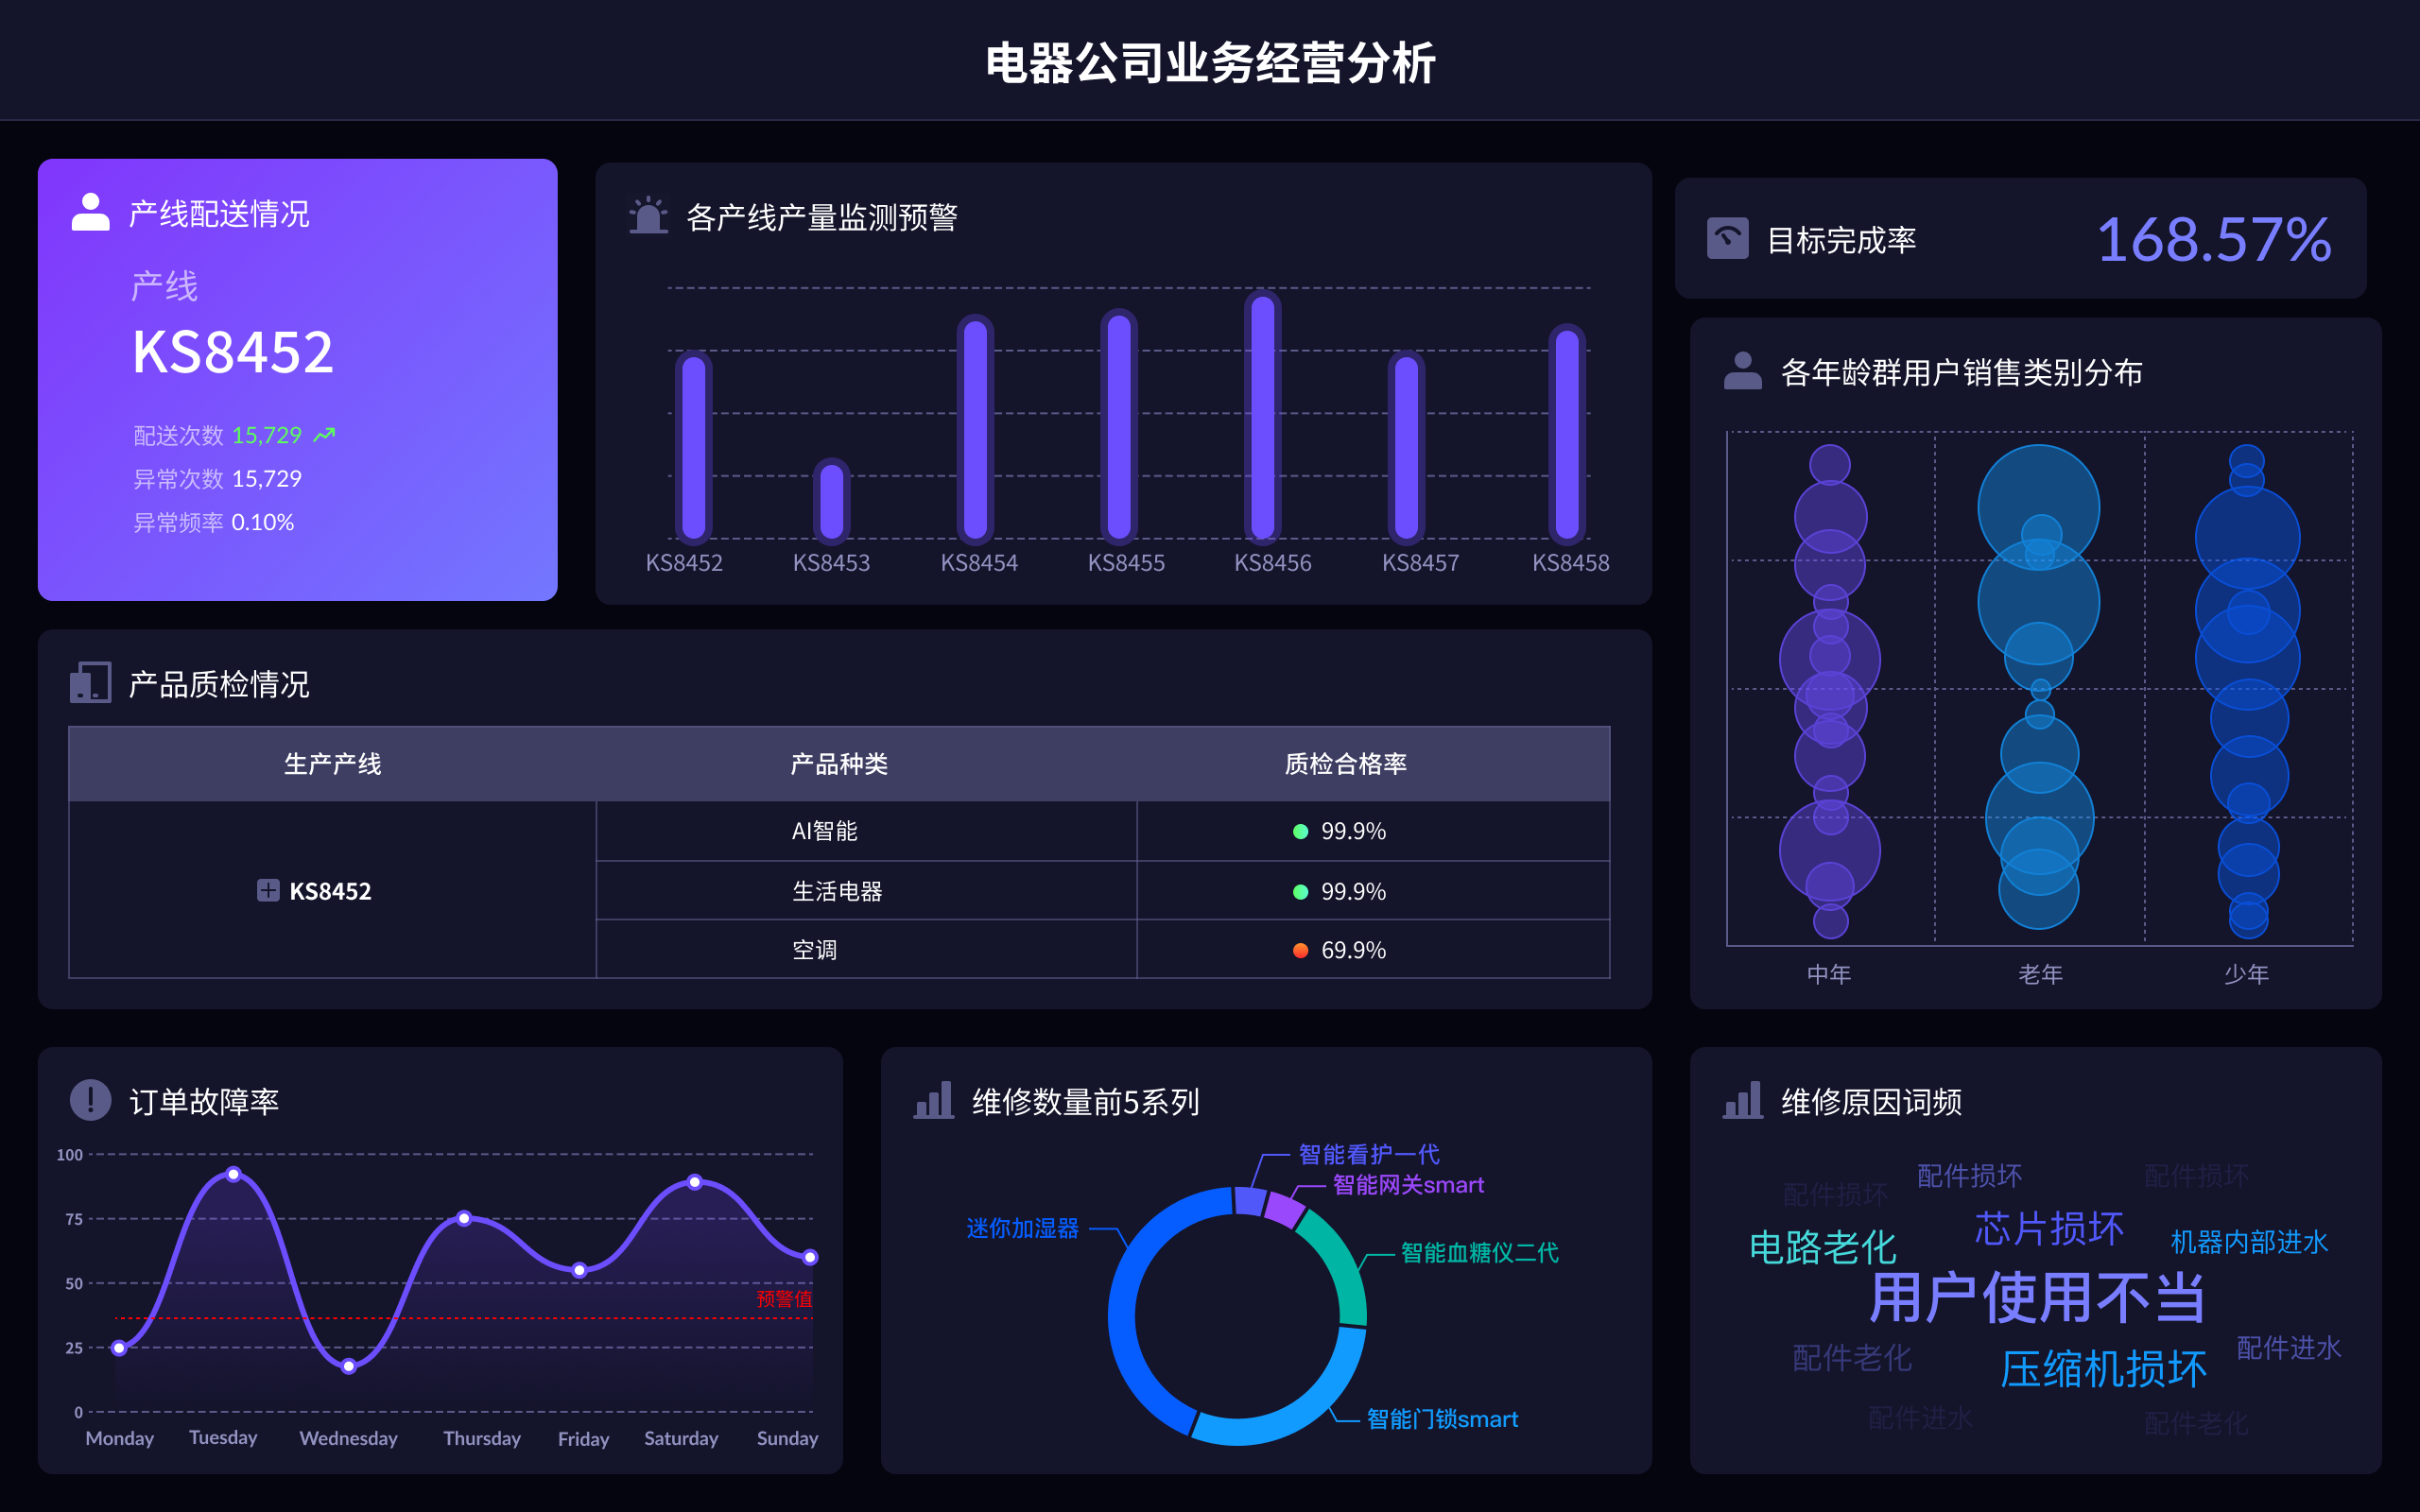
Data Visualization is the English term for 数据可视化. Data Visualization refers to the graphical representation of data and information using visual elements like charts, graphs, and maps. It enables users to see patterns, trends, and correlations that might go unnoticed in text-based data. One key aspect of data visualization is its ability to make complex data more accessible, understandable, and usable. For instance, using FineBI, FineReport, and FineVis, businesses can create interactive and comprehensive dashboards that facilitate decision-making processes. These tools offer a range of functionalities from basic charting to advanced analytics, ensuring that data-driven insights are easily communicated across different organizational levels.
I、IMPORTANCE OF DATA VISUALIZATION
Data visualization is crucial for several reasons: enhancing data comprehension, facilitating decision-making, improving data storytelling, and identifying trends and patterns. By transforming raw data into visual formats, it becomes easier to understand complex data sets. For example, FineBI offers a user-friendly interface that allows users to create intuitive dashboards, making data analysis more straightforward.
Facilitating decision-making is another critical aspect. When data is presented visually, it is easier for decision-makers to grasp insights quickly, leading to more informed and timely decisions. FineReport, with its robust reporting capabilities, ensures that the right information is available to the right people at the right time, thereby enhancing the decision-making process.
II、TOOLS AND TECHNOLOGIES IN DATA VISUALIZATION
Various tools and technologies play a pivotal role in data visualization. FineBI, FineReport, and FineVis are among the leading tools in this domain. FineBI is known for its powerful BI capabilities, allowing users to create interactive dashboards and perform in-depth analyses. FineReport focuses on reporting and data integration, providing a platform for generating complex reports with ease. FineVis, on the other hand, specializes in advanced visualization techniques, offering a wide array of chart types and customization options to meet diverse visualization needs.
FineBI is particularly useful for businesses looking to leverage their data for strategic insights. Its drag-and-drop interface, coupled with a variety of widgets and visualization options, makes it a preferred choice for creating comprehensive dashboards.
FineReport excels in scenarios requiring detailed and structured reporting. It supports multi-source data integration, enabling users to pull data from various systems and present it cohesively. This makes it an ideal tool for organizations needing to consolidate data from different departments or systems.
FineVis stands out with its advanced visualizations. It offers unique chart types and extensive customization options, making it suitable for users who need highly detailed and specific visual representations of their data.
III、BEST PRACTICES FOR DATA VISUALIZATION
To achieve effective data visualization, it is essential to follow best practices. These include choosing the right type of chart, maintaining simplicity, ensuring data accuracy, and focusing on the message. Selecting the appropriate chart type is crucial as it determines how well the data will be understood. For instance, bar charts are excellent for comparing quantities, while line charts are ideal for showing trends over time.
Maintaining simplicity is another vital practice. Overloading a visual with too much information can overwhelm the audience and obscure the main message. Tools like FineBI help in creating clean and straightforward dashboards that convey the necessary information without unnecessary clutter.
Ensuring data accuracy is fundamental to maintaining credibility. Any errors in data representation can lead to misinterpretations and poor decision-making. FineReport’s strong data integration capabilities help in ensuring that the data presented is accurate and up-to-date.
Focusing on the message means that every visual element should serve a purpose and contribute to the overall understanding of the data. FineVis, with its extensive customization options, allows users to highlight key data points and trends effectively.
IV、APPLICATIONS OF DATA VISUALIZATION
Data visualization finds applications across various industries and functions. In business, healthcare, education, and government sectors, it plays a crucial role in interpreting data and driving actions. For businesses, data visualization is essential for performance monitoring, market analysis, and customer insights. Using tools like FineBI, companies can track key performance indicators (KPIs) in real-time, allowing for agile responses to market changes.
In healthcare, data visualization aids in patient data analysis, resource management, and research. FineReport can be used to create detailed reports that help in understanding patient trends, treatment outcomes, and operational efficiencies.
In education, data visualization helps in analyzing student performance, curriculum effectiveness, and institutional metrics. FineVis can be utilized to create engaging and informative visuals that help educators and administrators make data-driven decisions.
Government agencies use data visualization to improve transparency, track public health metrics, and manage resources effectively. The ability to present data clearly and understandably is crucial for public communication and policy-making.
V、FUTURE TRENDS IN DATA VISUALIZATION
The field of data visualization is constantly evolving, with new trends and technologies emerging. The future of data visualization will likely see increased use of artificial intelligence (AI), augmented reality (AR), real-time data visualization, and greater customization. AI can enhance data visualization by automating the creation of visuals and providing predictive analytics. FineBI is already incorporating AI capabilities to offer more advanced analytics and insights.
Augmented reality (AR) is another exciting trend. It allows users to interact with data in a 3D space, providing a more immersive experience. This can be particularly useful in industries like engineering and architecture, where spatial data is crucial.
Real-time data visualization will become increasingly important as businesses seek to make faster decisions based on the latest data. Tools like FineReport are already supporting real-time data integration, enabling organizations to stay ahead of the curve.
Greater customization will also be a key trend. Users will demand more control over how their data is presented, leading to the development of more flexible and adaptable visualization tools. FineVis, with its extensive customization options, is well-positioned to meet this demand.
VI、CONCLUSION
Data visualization is a powerful tool for making data more accessible, understandable, and actionable. With the right tools like FineBI, FineReport, and FineVis, organizations can unlock the full potential of their data, leading to better decision-making and improved outcomes. As the field continues to evolve, staying updated with the latest trends and best practices will be crucial for leveraging data visualization effectively.
For more information, you can visit their official websites:
FineBI官网: https://s.fanruan.com/f459r
FineReport官网: https://s.fanruan.com/ryhzq
FineVis官网: https://s.fanruan.com/7z296
相关问答FAQs:
1. What is Data Visualization and Why is it Important?
Data visualization is the graphical representation of information and data. By using visual elements like charts, graphs, and maps, data visualization tools provide an accessible way to see and understand trends, outliers, and patterns in data. It is important because it allows for quick interpretation of data and can help users make data-driven decisions more effectively.
2. How Does Data Visualization Benefit Businesses?
Data visualization benefits businesses in various ways. It helps in identifying trends and patterns that might go unnoticed in traditional data formats. It also enables businesses to communicate complex data in a more accessible and understandable format, which can aid in decision-making processes. Additionally, data visualization can help in spotting anomalies, outliers, and areas that require attention, allowing businesses to take proactive measures.
3. What are the Common Tools and Techniques Used in Data Visualization?
There are several common tools and techniques used in data visualization. Some of the popular tools include Tableau, Power BI, Google Data Studio, and D3.js. Techniques such as bar charts, pie charts, line graphs, scatter plots, and heat maps are commonly used to represent different types of data. Interactive dashboards, infographics, and geographical mapping are also popular techniques used in data visualization to enhance understanding and engagement.
本文内容通过AI工具匹配关键字智能整合而成,仅供参考,帆软不对内容的真实、准确或完整作任何形式的承诺。具体产品功能请以帆软官方帮助文档为准,或联系您的对接销售进行咨询。如有其他问题,您可以通过联系blog@fanruan.com进行反馈,帆软收到您的反馈后将及时答复和处理。


