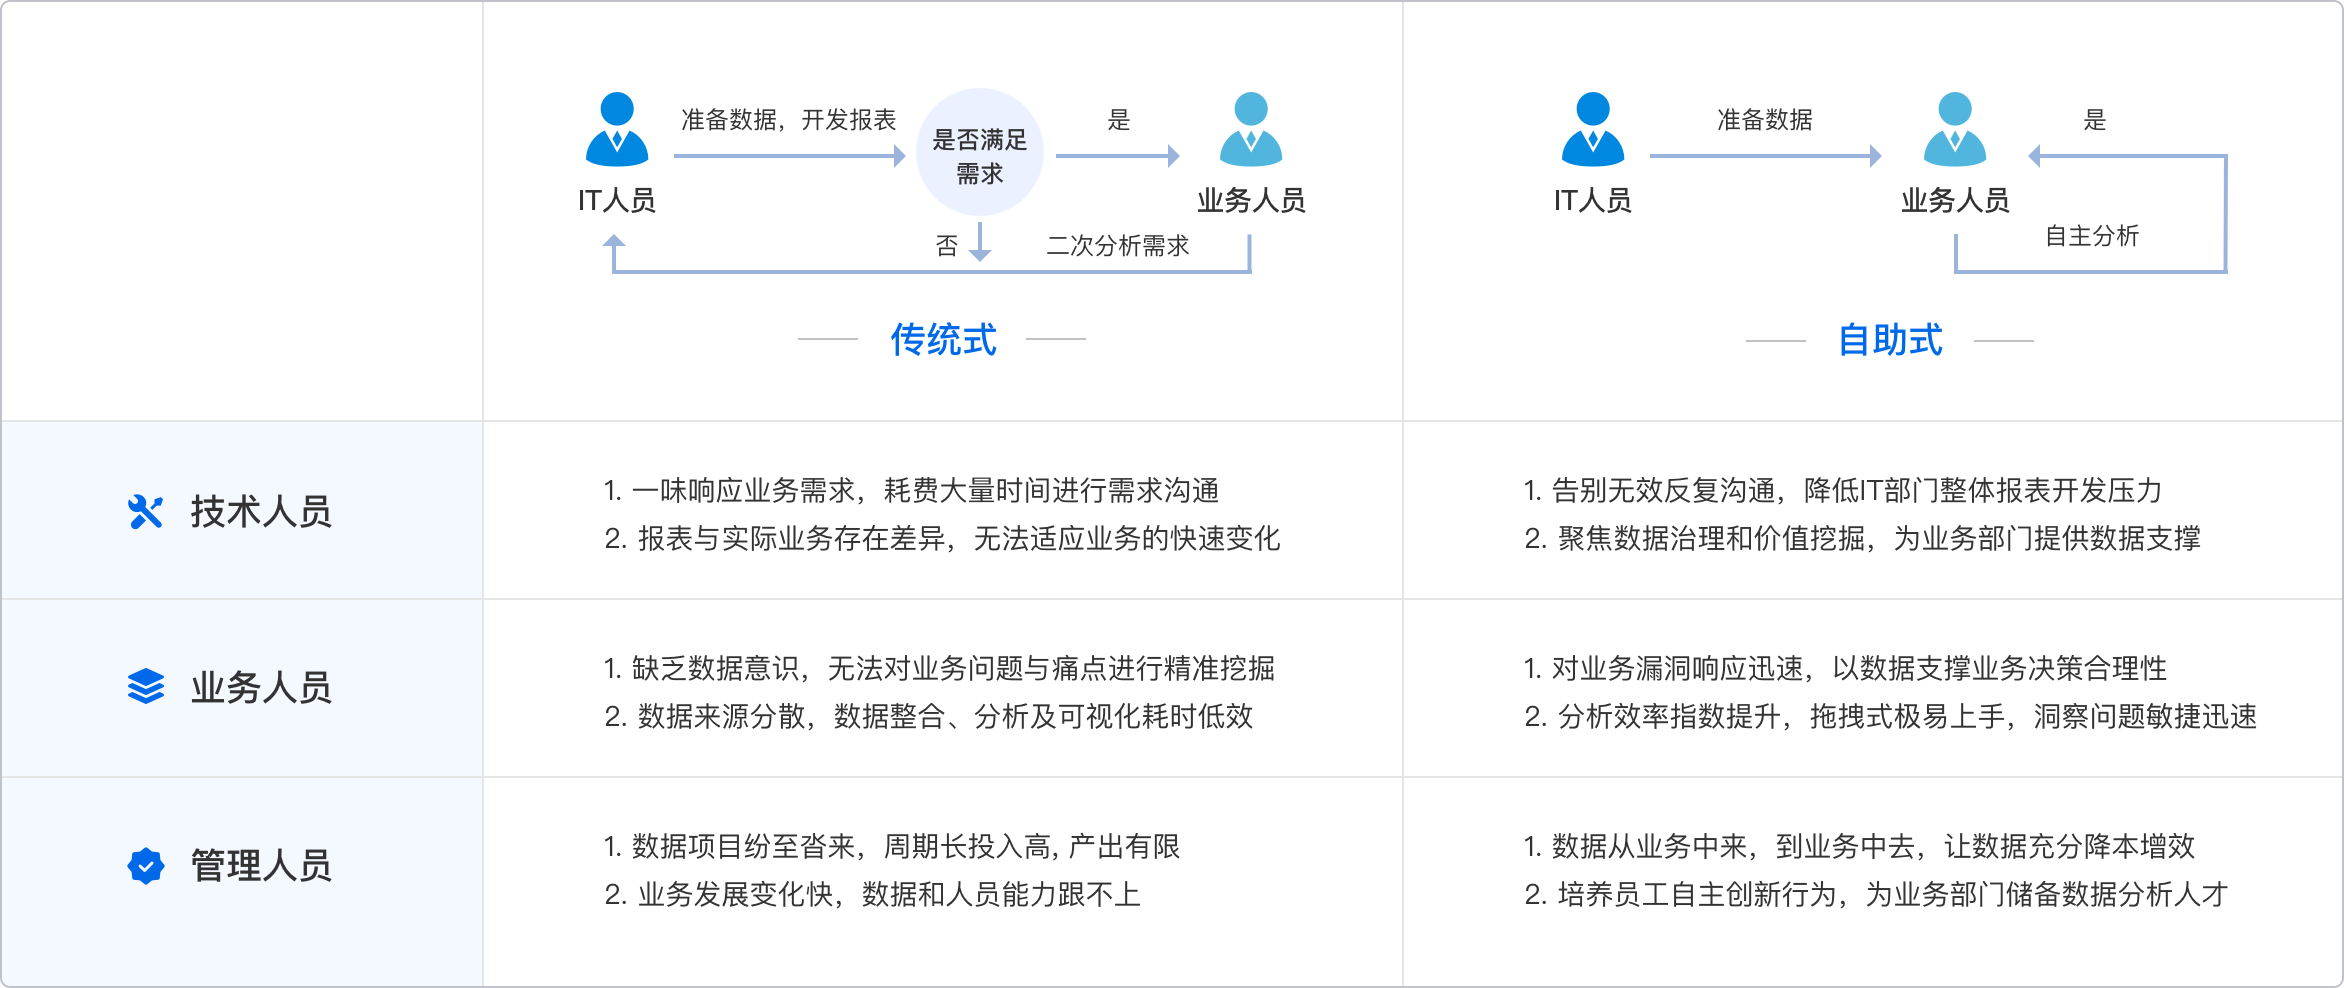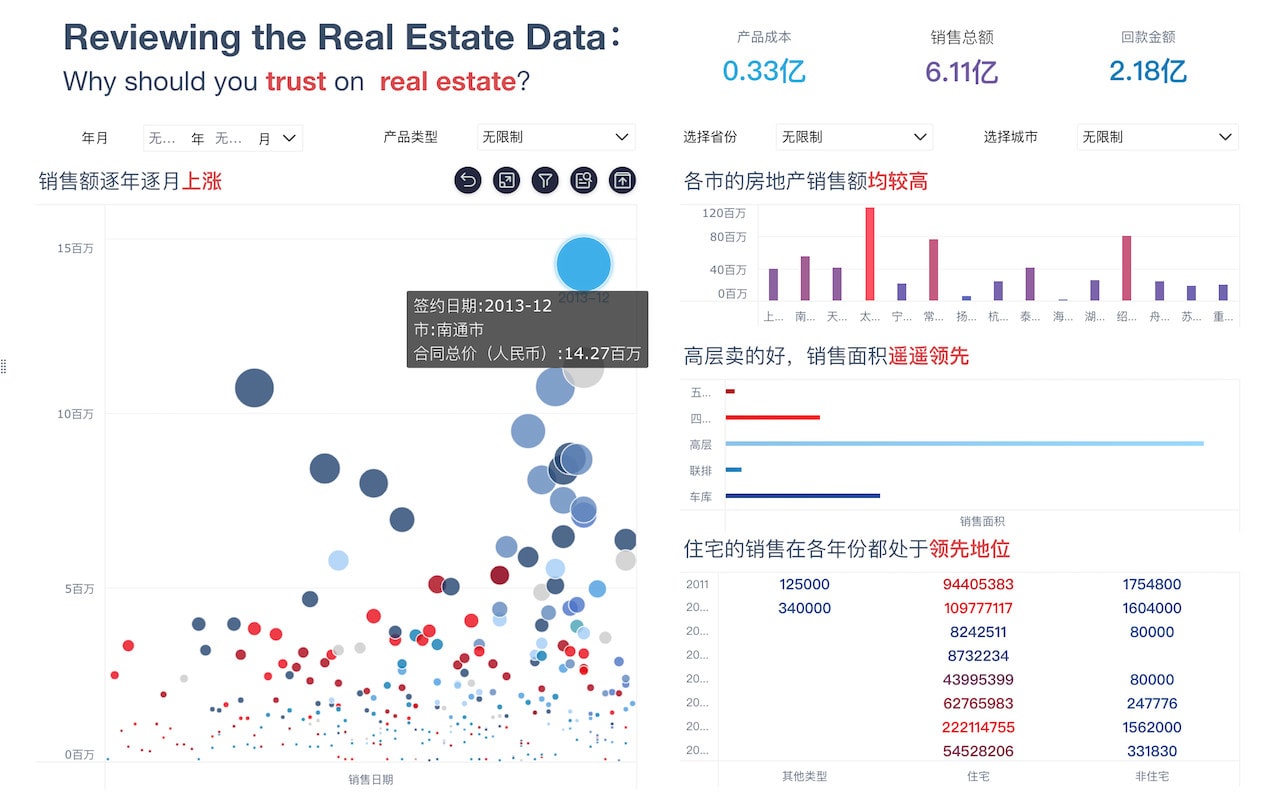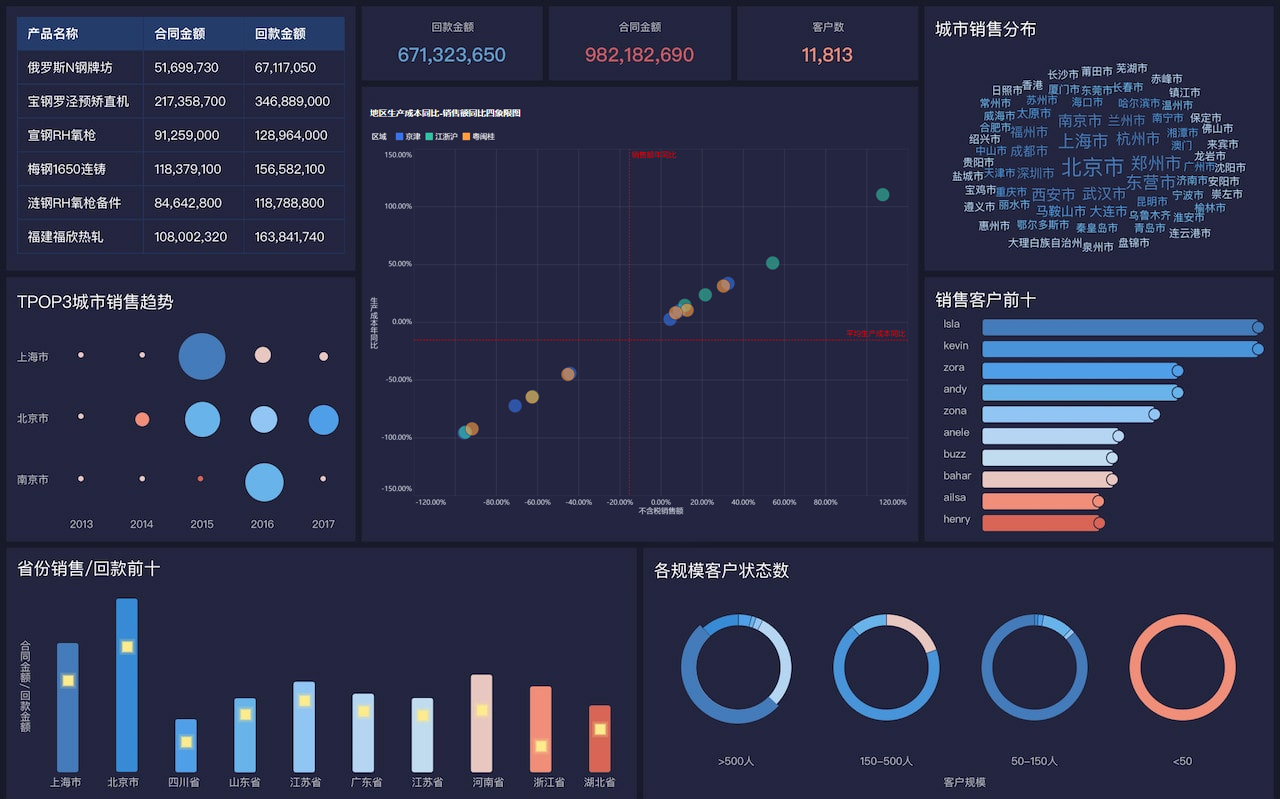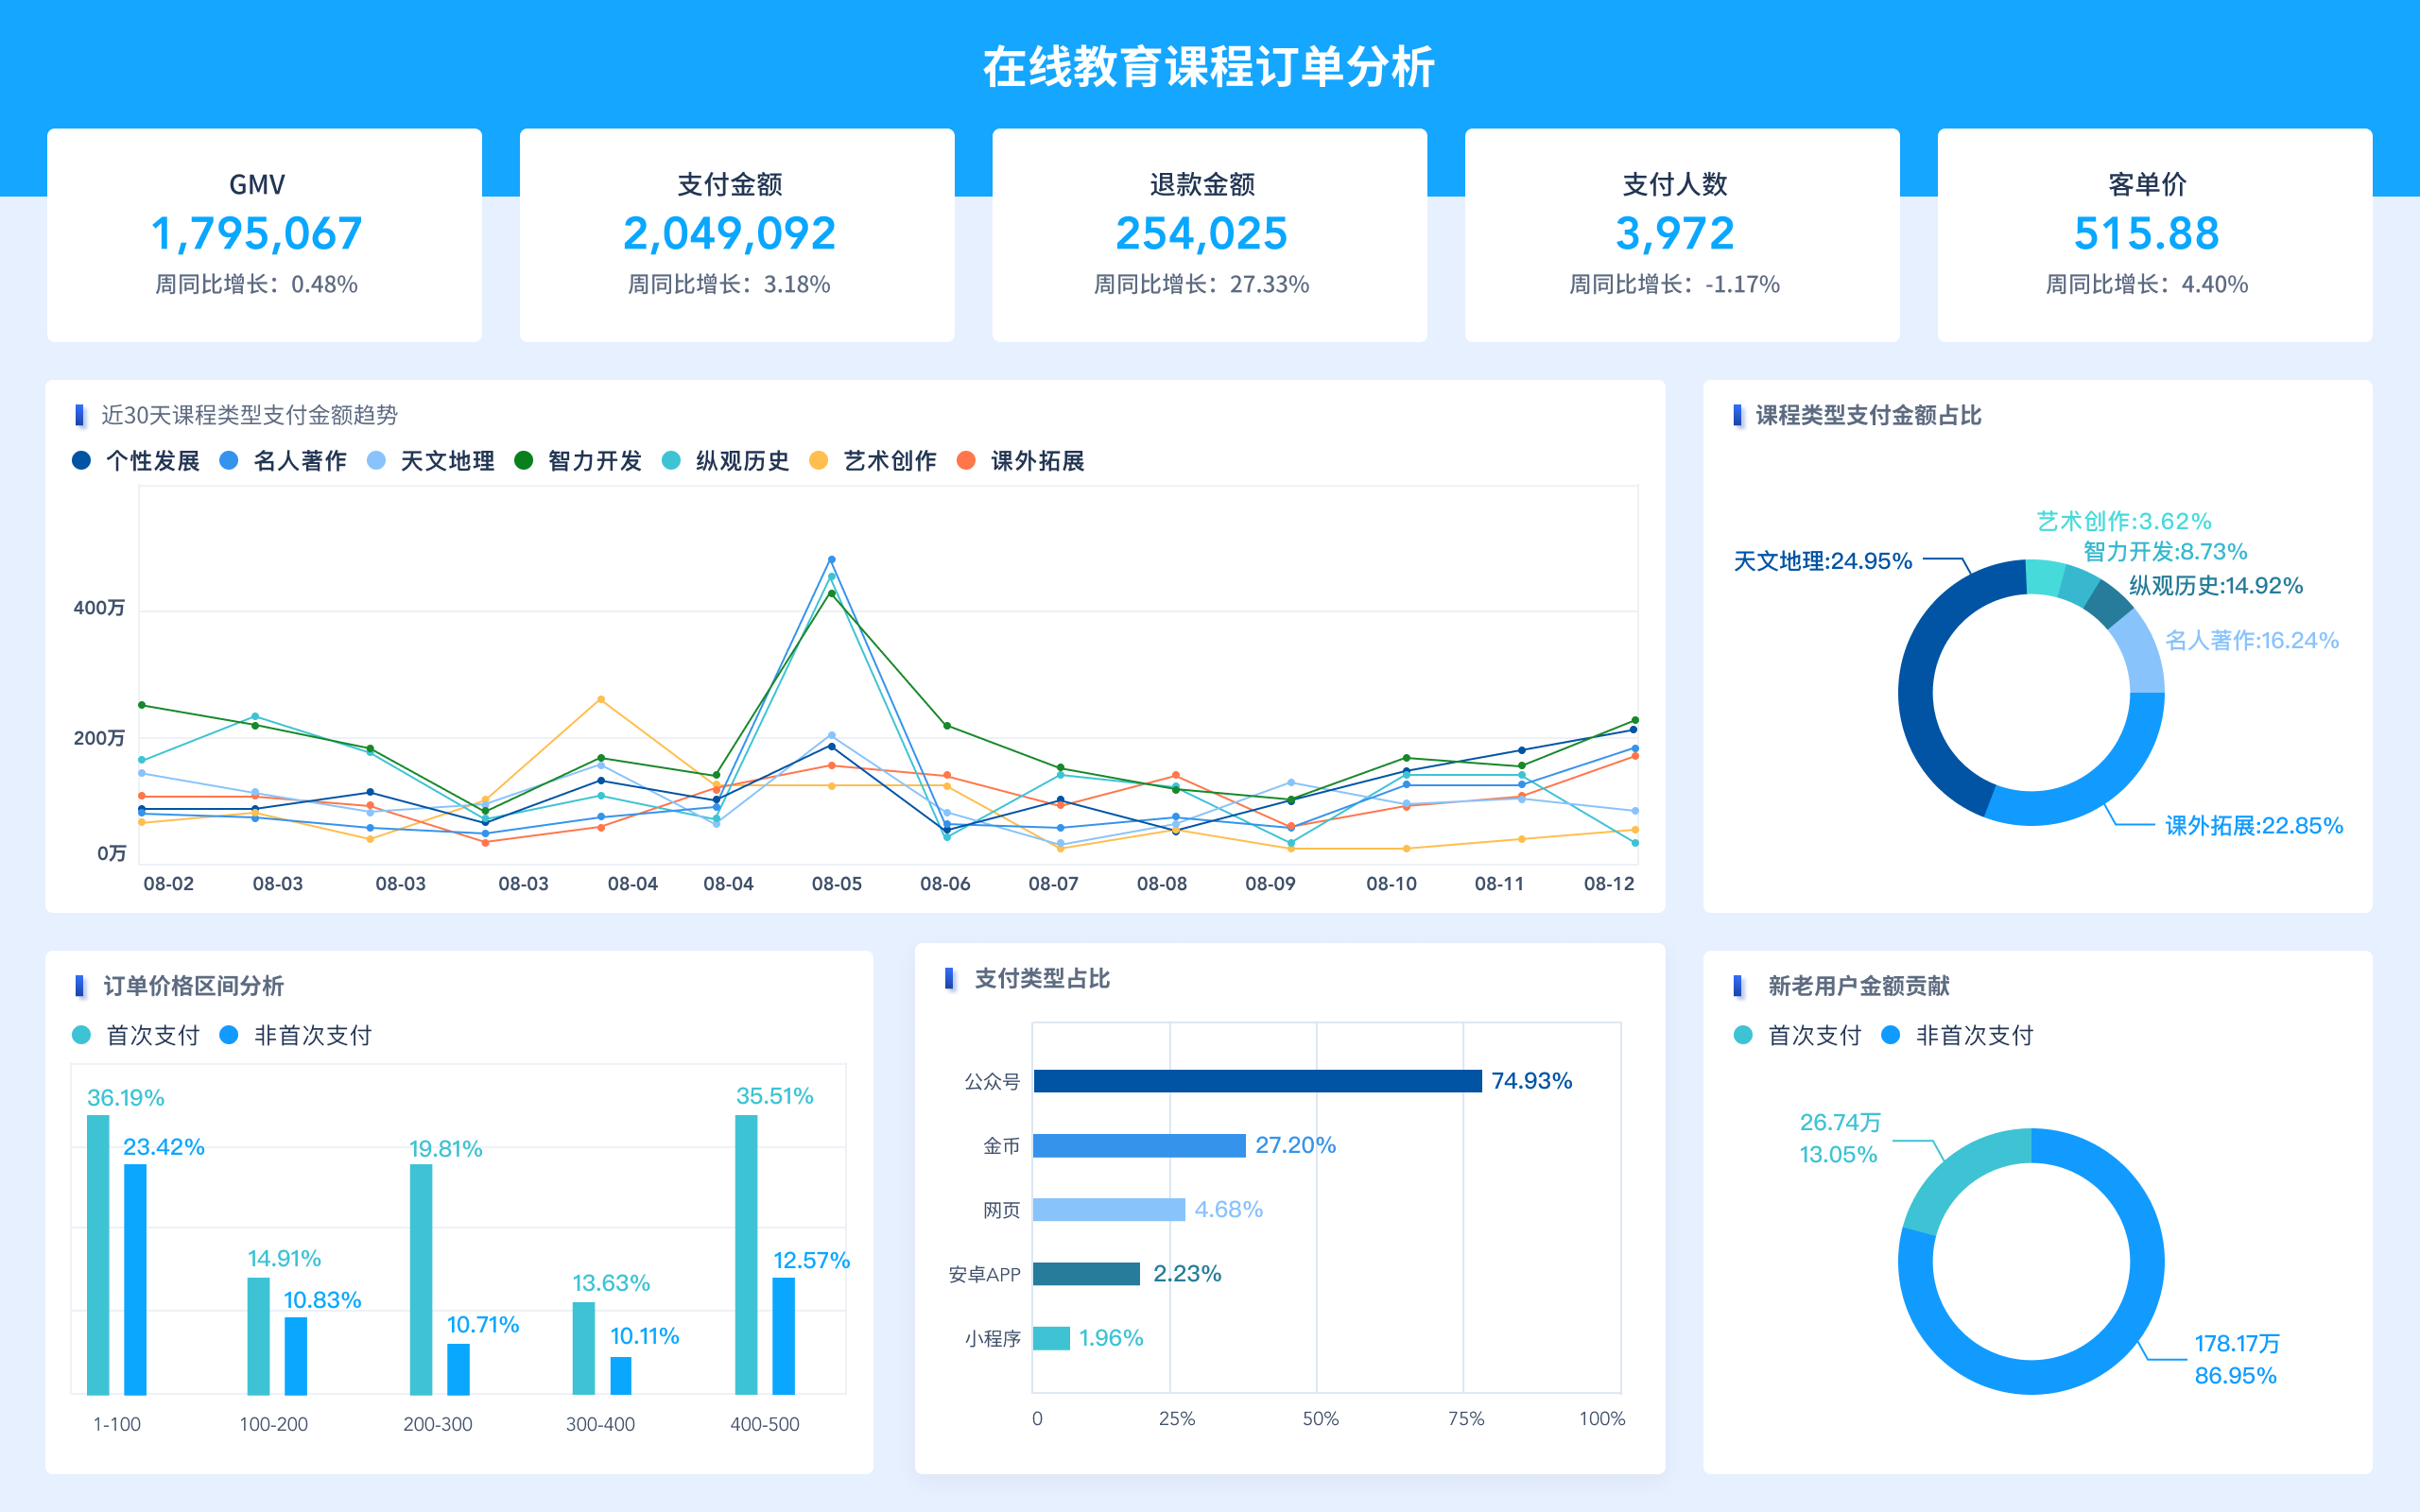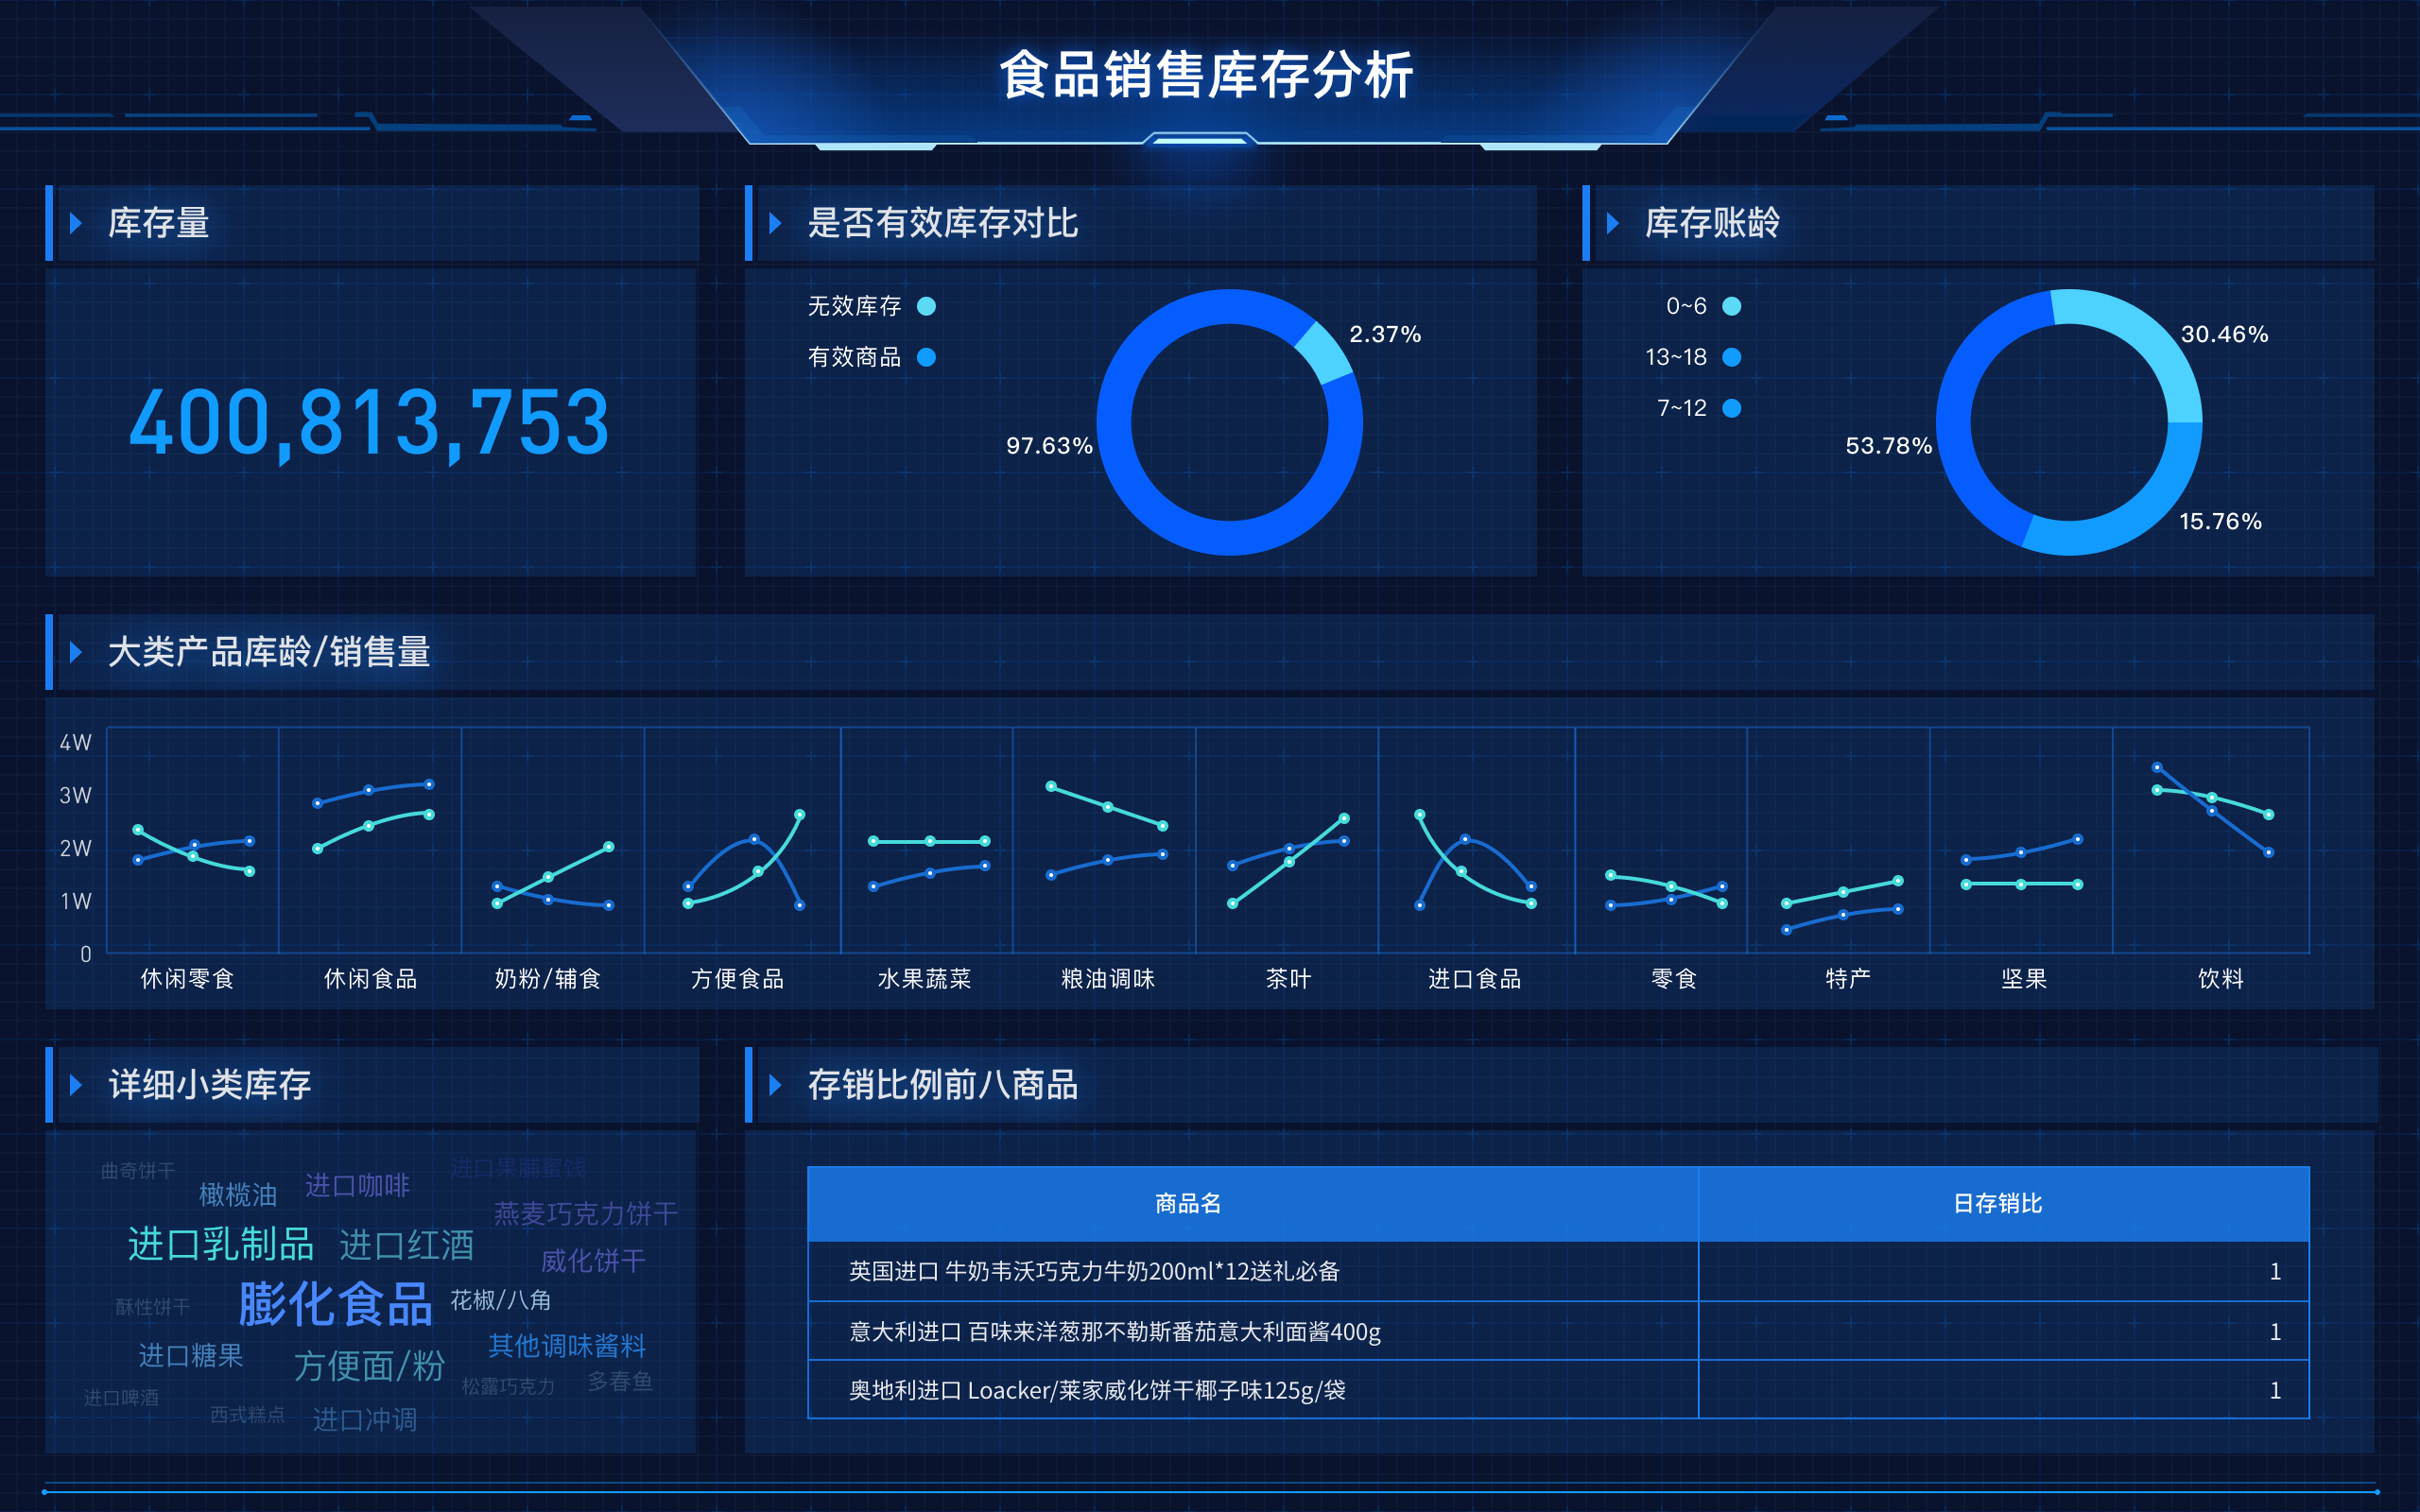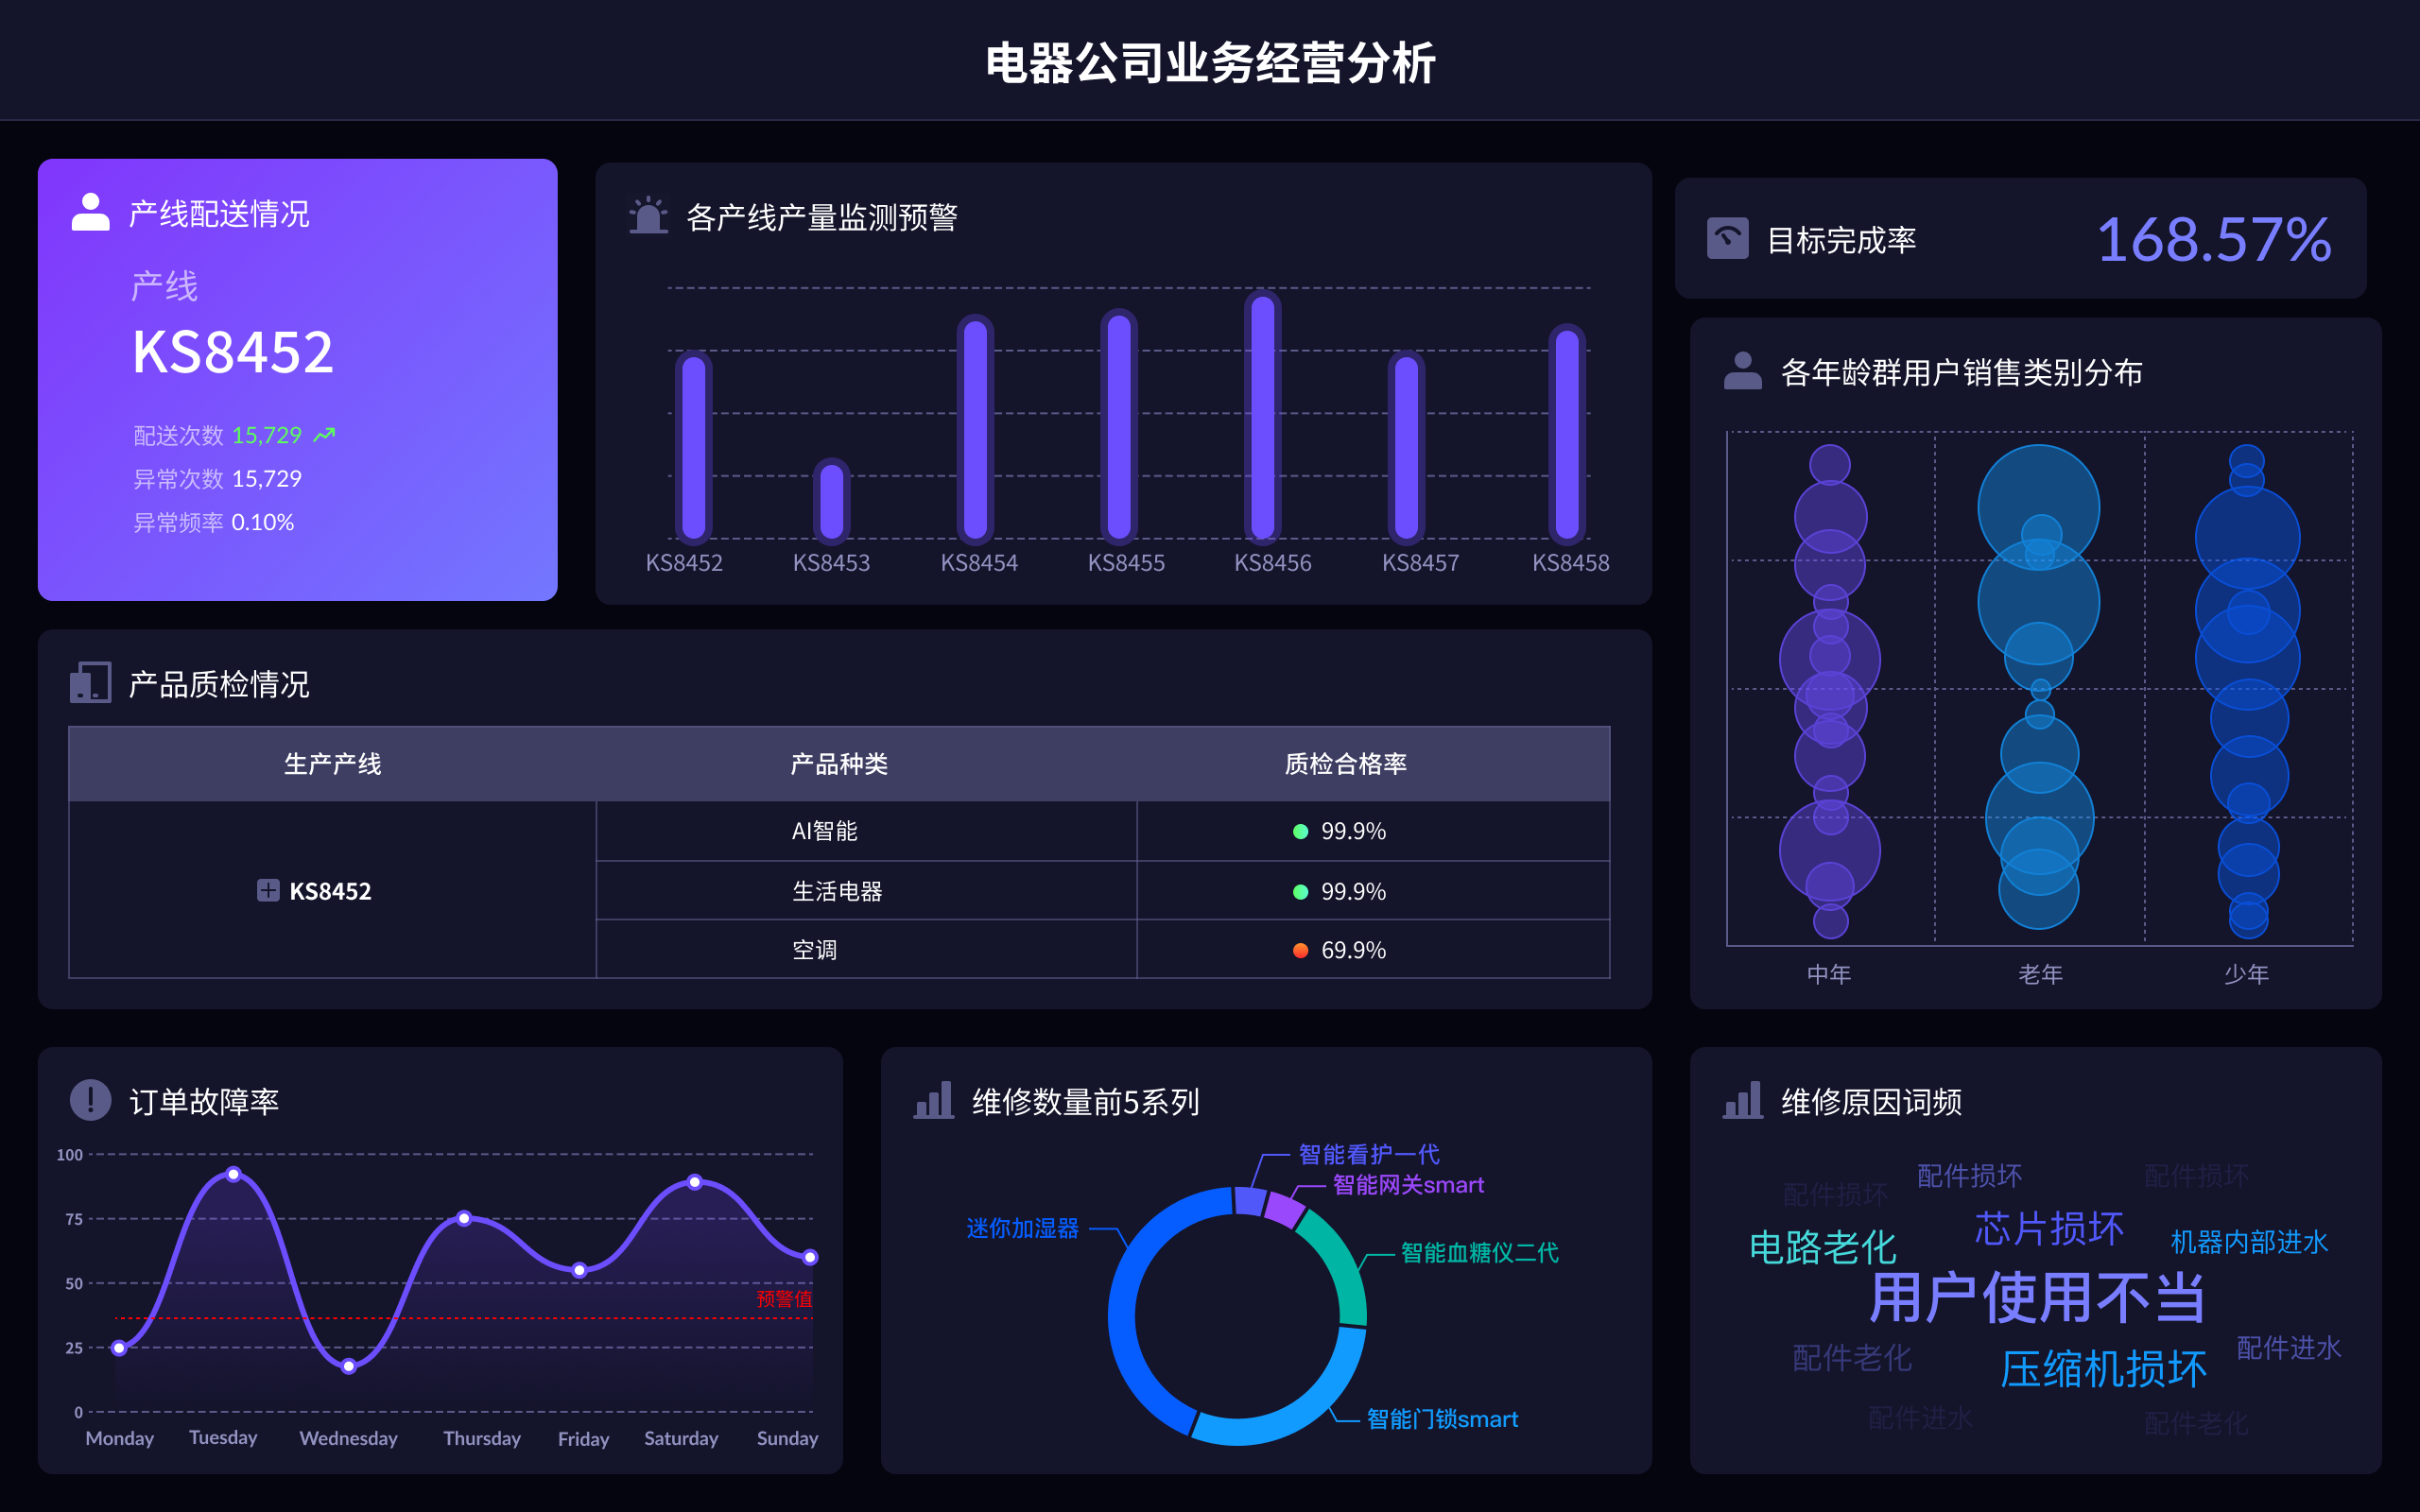
数据可视化应用需要学的核心软件包括:FineBI、FineReport、FineVis、Tableau、Power BI、D3.js。其中,FineBI 是一个自助式商业智能平台,能够快速生成各种数据报表和可视化图表,非常适合企业用户。FineBI提供了丰富的图表类型和数据处理能力,使得用户可以轻松地分析和展示复杂的数据。通过其强大的数据连接和处理功能,FineBI可以帮助企业实现高效的数据管理和决策支持。
一、FINEBI
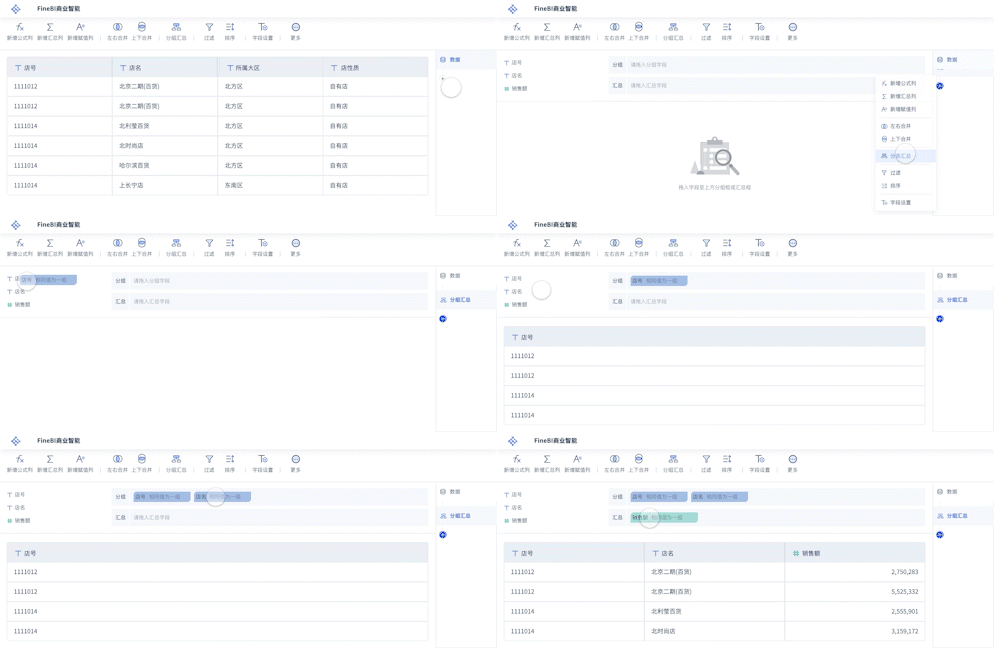
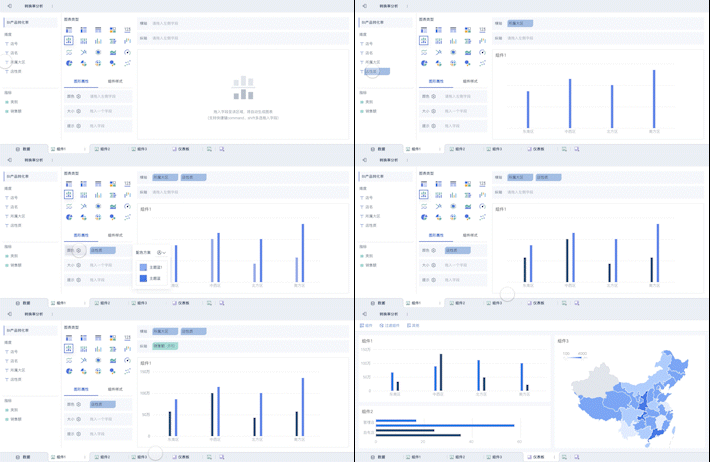
FineBI是帆软旗下的一款自助式商业智能工具,专为企业用户设计。其主要特点包括多维分析、数据连接、数据处理。FineBI支持多种数据源连接,用户可以从数据库、Excel文件、API等多种途径导入数据。此外,FineBI提供了丰富的可视化组件,包括柱状图、饼图、折线图等,可以满足不同的分析需求。FineBI的自助分析功能允许用户通过简单的拖拽操作,创建复杂的数据分析报表。FineBI官网: https://s.fanruan.com/f459r
二、FINEREPORT
FineReport是帆软旗下的另一款报表工具,专注于企业级报表制作和数据展示。其特点包括灵活的报表设计、复杂的数据处理、强大的报表展示能力。FineReport支持多种报表类型,如列表报表、交叉报表、图表报表等,可以满足各种业务需求。FineReport的报表设计界面非常友好,用户可以通过拖放组件和设置属性,快速生成所需的报表。FineReport还支持多种数据源连接,用户可以从不同的数据源获取数据,并进行复杂的计算和处理。FineReport官网: https://s.fanruan.com/ryhzq
三、FINEVIS
FineVis是帆软旗下的一款数据可视化工具,专注于大屏展示和仪表盘设计。其主要特点包括多样化的图表组件、灵活的布局设计、实时数据更新。FineVis提供了丰富的图表组件,如地图、仪表盘、雷达图等,可以满足各种大屏展示需求。FineVis的布局设计非常灵活,用户可以根据需求自由安排图表的位置和大小。FineVis支持实时数据更新,用户可以通过API接口或其他数据源,实时获取和展示数据。FineVis官网: https://s.fanruan.com/7z296
四、TABLEAU
Tableau是一款广泛使用的数据可视化工具,适用于各种规模的企业和个人用户。其主要特点包括拖放式界面、强大的数据处理能力、多种数据源连接。Tableau的拖放式界面非常直观,用户可以通过简单的操作,快速创建各种图表和仪表盘。Tableau支持多种数据源连接,用户可以从数据库、Excel文件、云服务等多种途径导入数据。Tableau还提供了丰富的分析功能,如过滤、分组、计算字段等,用户可以进行深入的数据分析。
五、POWER BI
Power BI是微软推出的一款商业智能工具,适用于各种规模的企业。其主要特点包括集成微软生态系统、强大的数据处理能力、丰富的可视化组件。Power BI可以与微软的其他产品,如Excel、Azure等无缝集成,用户可以轻松地获取和处理数据。Power BI提供了丰富的可视化组件,如柱状图、饼图、折线图等,可以满足不同的分析需求。Power BI还支持多种数据源连接,用户可以从数据库、Excel文件、云服务等多种途径导入数据。
六、D3.JS
D3.js是一款基于JavaScript的数据可视化库,适用于开发人员和数据科学家。其主要特点包括灵活的图表设计、高度定制化、强大的数据处理能力。D3.js提供了丰富的API,用户可以通过编写代码,创建各种复杂的图表和可视化效果。D3.js的高度定制化使得用户可以根据需求,灵活地调整图表的样式和行为。D3.js还支持多种数据处理功能,如数据转换、过滤、聚合等,用户可以进行深入的数据分析。
七、SOFTWARE SELECTION BASED ON NEEDS
Choosing the right data visualization software depends on your specific needs and expertise. For enterprise-level reporting and data management, FineBI and FineReport are excellent choices due to their robust features and ease of integration with various data sources. If your focus is on creating dynamic and visually appealing dashboards, FineVis provides a versatile platform with real-time data updating capabilities. For more general data visualization needs, Tableau and Power BI offer user-friendly interfaces and extensive analytical functions. For those with programming skills, D3.js offers unparalleled customization and flexibility in creating complex visualizations.
八、DATA SOURCE INTEGRATION
One of the key aspects of effective data visualization is the ability to integrate multiple data sources. FineBI excels in this area, allowing users to connect to various databases, Excel files, and APIs seamlessly. This capability ensures that all relevant data is available for analysis, providing a comprehensive view of business operations. Similarly, FineReport and Power BI offer strong data integration features, making it easy to gather and process information from diverse sources. By leveraging these tools, businesses can ensure that their data visualizations are accurate, up-to-date, and reflective of the latest information.
九、CUSTOMIZATION AND FLEXIBILITY
Customization is crucial for creating visualizations that meet specific business needs. FineVis stands out for its flexible layout design and a wide range of visualization components. Users can tailor the appearance and functionality of their dashboards to match their unique requirements. D3.js offers the highest level of customization, allowing developers to create bespoke visualizations through code. While this requires more technical expertise, the results can be highly tailored and interactive. Tableau and Power BI also offer customization options, although they are generally more user-friendly and suitable for non-developers.
十、USER-FRIENDLINESS AND LEARNING CURVE
User-friendliness is an essential factor when choosing a data visualization tool. FineBI and FineReport are designed with intuitive interfaces that make it easy for users to create reports and visualizations without extensive training. Tableau and Power BI are also known for their user-friendly drag-and-drop interfaces, which allow users to build complex visualizations with minimal effort. On the other hand, D3.js requires a good understanding of JavaScript and data manipulation, making it more suitable for users with a technical background. For those new to data visualization, starting with a tool that has a gentle learning curve can be more practical.
十一、ANALYTICAL CAPABILITIES
Advanced analytical capabilities are vital for deriving meaningful insights from data. FineBI offers powerful features like multidimensional analysis and data mining, enabling users to uncover patterns and trends. Tableau and Power BI also provide robust analytical tools, including forecasting, clustering, and statistical analysis. These capabilities allow users to perform in-depth analyses and make data-driven decisions. FineReport focuses more on report generation but still offers essential analytical functions. By using these tools, businesses can enhance their data analysis processes and gain a competitive edge.
十二、COLLABORATION AND SHARING
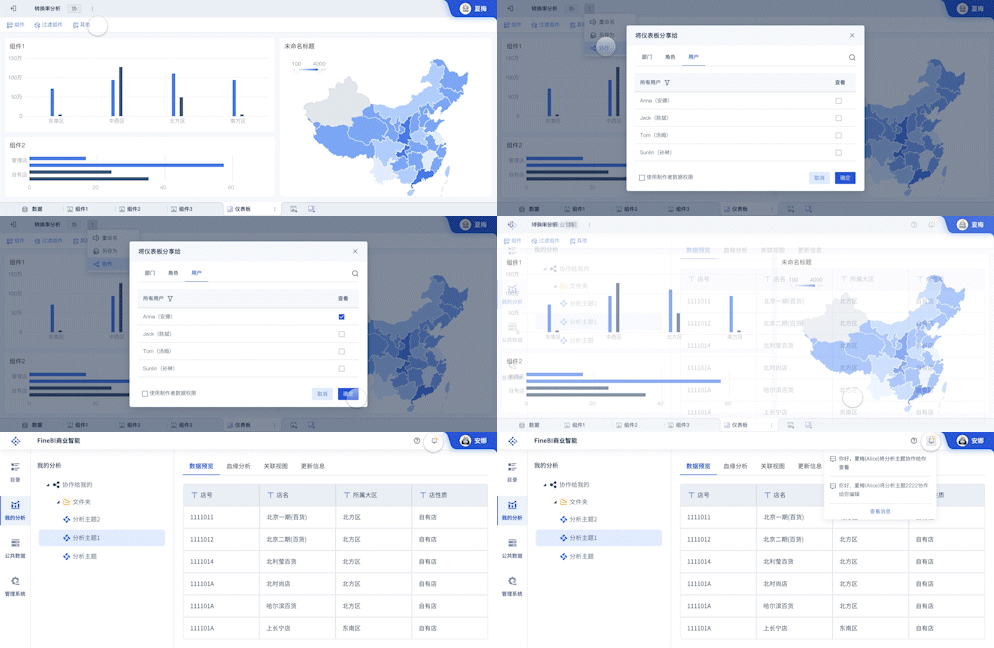
Collaboration and sharing features are crucial for ensuring that insights are accessible to all stakeholders. FineBI and FineReport support collaborative features, allowing multiple users to work on reports and dashboards simultaneously. Power BI offers strong integration with Microsoft Teams and SharePoint, facilitating seamless collaboration within the Microsoft ecosystem. Tableau provides features for sharing visualizations online and embedding them in web pages, making it easy to distribute insights. These collaboration capabilities ensure that data-driven decisions can be made collectively, enhancing overall business performance.
十三、REAL-TIME DATA UPDATES
Real-time data updates are essential for making timely and informed decisions. FineVis excels in this area, offering real-time data integration and visualization capabilities. Users can connect to live data sources and see updates reflected instantly in their dashboards. Power BI also supports real-time data streaming, making it ideal for monitoring key metrics and performance indicators. Tableau provides real-time data connectivity through its live connection feature, ensuring that visualizations are always up-to-date. By leveraging real-time data updates, businesses can respond quickly to changing conditions and stay ahead of the competition.
十四、COST AND LICENSING
Cost and licensing are important considerations when selecting a data visualization tool. FineBI, FineReport, and FineVis offer flexible licensing options that can be tailored to the needs of different organizations. Tableau and Power BI also provide various pricing tiers, ranging from individual licenses to enterprise solutions. D3.js is open-source and free to use, although it may require investment in development resources. When evaluating costs, businesses should consider not only the initial licensing fees but also ongoing maintenance and support costs. Choosing a tool that fits within the budget while meeting all requirements is essential for long-term success.
十五、SUPPORT AND COMMUNITY
Having access to support and a strong user community can significantly enhance the user experience. FineBI, FineReport, and FineVis provide dedicated customer support and extensive documentation, ensuring that users can quickly resolve any issues. Tableau and Power BI have large and active user communities, offering forums, tutorials, and user groups where users can share knowledge and best practices. D3.js also has a supportive community of developers, but finding solutions may require more technical expertise. By leveraging available support and community resources, users can maximize the value of their chosen data visualization tool.
十六、FUTURE TRENDS IN DATA VISUALIZATION
The field of data visualization is continuously evolving, with new trends and technologies emerging. Artificial intelligence and machine learning are increasingly being integrated into data visualization tools, enabling more advanced and predictive analytics. Augmented reality (AR) and virtual reality (VR) are also gaining traction, offering immersive ways to explore and interact with data. FineBI, FineReport, and FineVis are likely to incorporate these cutting-edge technologies to stay ahead of the curve. By staying informed about future trends, businesses can ensure that their data visualization practices remain innovative and effective.
In conclusion, mastering a range of data visualization tools, such as FineBI, FineReport, FineVis, Tableau, Power BI, and D3.js, provides a comprehensive skill set for effectively analyzing and presenting data. Each tool has its unique strengths, and selecting the right one depends on specific business needs, technical expertise, and budget considerations. FineBI官网: https://s.fanruan.com/f459r FineReport官网: https://s.fanruan.com/ryhzq FineVis官网: https://s.fanruan.com/7z296
相关问答FAQs:
1. 数据可视化应用需要学习哪些软件?
在数据可视化领域,有许多流行的软件工具可以帮助你创建令人印象深刻的可视化作品。以下是一些常用的数据可视化软件:
-
Tableau:Tableau是一款功能强大且易于使用的数据可视化工具,可以帮助用户快速创建交互式和具有吸引力的可视化图表。它支持各种数据源,并提供丰富的图表类型和定制选项。
-
Microsoft Power BI:Power BI是微软推出的一款商业智能工具,可以帮助用户将数据转化为具有启发性的报告和仪表板。Power BI具有强大的数据连接能力和可视化功能,适用于各种行业和规模的组织。
-
Python:Python是一种流行的编程语言,有许多库和工具可以用于数据可视化,如Matplotlib、Seaborn和Plotly。使用Python进行数据可视化可以实现高度定制化和灵活性,适用于数据科学家和分析师。
-
R语言:R语言是另一种常用于数据科学和统计分析的编程语言,拥有丰富的可视化库,如ggplot2和Plotly。R语言的可视化功能强大,适用于处理复杂的数据集和统计图表。
-
D3.js:D3.js是一款基于JavaScript的数据可视化库,可以帮助用户创建高度定制化的交互式图表和可视化效果。虽然学习曲线较陡峭,但D3.js在Web数据可视化领域具有独特的优势。
通过学习以上软件工具,你可以掌握不同类型的数据可视化技能,从而更好地展示和解释数据,为业务决策和沟通提供支持。
2. 如何选择适合自己的数据可视化软件?
在选择适合自己的数据可视化软件时,需要考虑以下几个因素:
-
功能需求:首先要明确自己的数据可视化需求是什么,例如创建静态图表、交互式仪表板、地理空间可视化等。不同软件工具具有不同的功能特点,选择符合自己需求的软件可以提高效率。
-
学习曲线:不同软件工具的学习曲线各不相同,有些工具易于上手,而有些则需要较长时间的学习和实践。根据自己的技术水平和时间投入来选择合适的软件。
-
数据源兼容性:确保所选软件支持你所使用的数据源格式和类型,能够顺利连接和处理数据。有些软件对特定数据源有更好的兼容性,需要提前了解清楚。
-
社区支持:选择拥有活跃社区和丰富资源的软件工具可以帮助你更好地解决问题和学习新技能。查看软件的官方文档、论坛和教程,以获取更多支持和帮助。
综合考虑以上因素,选择适合自己技能水平和需求的数据可视化软件,可以更好地发挥其潜力,提升数据分析和可视化的效果。
3. 数据可视化软件如何提升工作效率?
数据可视化软件可以帮助用户提升工作效率,实现更快速、准确和具有启发性的数据分析和呈现。以下是一些方法可以提升工作效率:
-
模板和预设:许多数据可视化软件提供各种模板和预设图表类型,可以帮助用户快速创建标准化和常见的可视化图表。利用这些模板可以节省时间,并快速生成所需的图表。
-
数据连接和整合:数据可视化软件通常支持多种数据源的连接和整合,可以直接从数据库、电子表格等数据源中提取数据,并实时更新可视化图表。通过自动化数据连接和整合,可以减少手动操作和错误。
-
交互式功能:许多数据可视化软件支持交互式功能,用户可以通过筛选、排序、缩放等方式与图表进行互动。这种交互式功能可以帮助用户更深入地探索数据,发现隐藏的模式和见解。
-
自动化报告:一些数据可视化软件支持自动化报告生成功能,可以定期生成报告、仪表板,并通过电子邮件或其他方式分享给相关人员。自动化报告可以节省时间,确保信息及时传达。
通过充分利用数据可视化软件提供的功能和工具,结合有效的数据处理和分析技能,可以提升工作效率,加快决策过程,实现更好的业务成果。
本文内容通过AI工具匹配关键字智能整合而成,仅供参考,帆软不对内容的真实、准确或完整作任何形式的承诺。具体产品功能请以帆软官方帮助文档为准,或联系您的对接销售进行咨询。如有其他问题,您可以通过联系blog@fanruan.com进行反馈,帆软收到您的反馈后将及时答复和处理。


