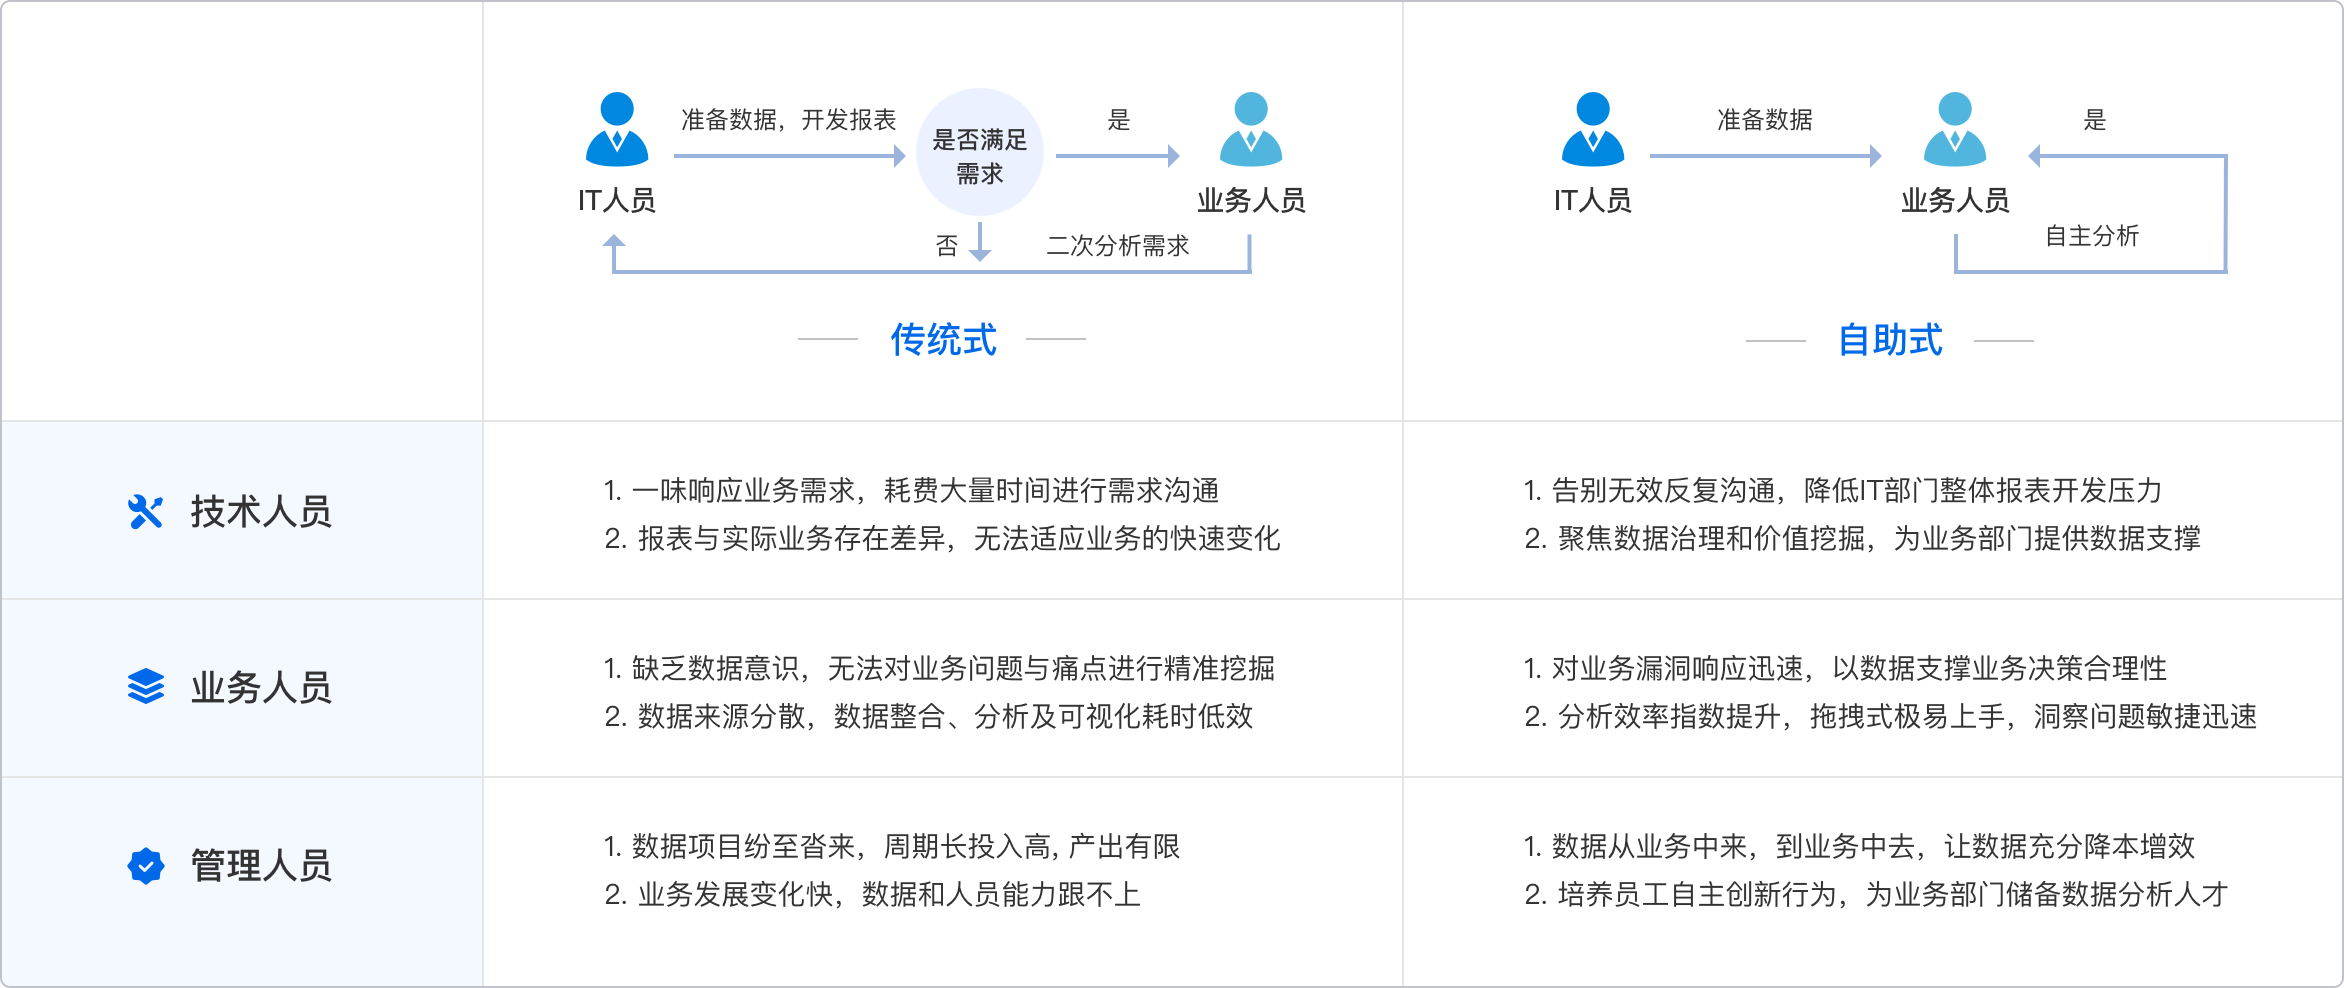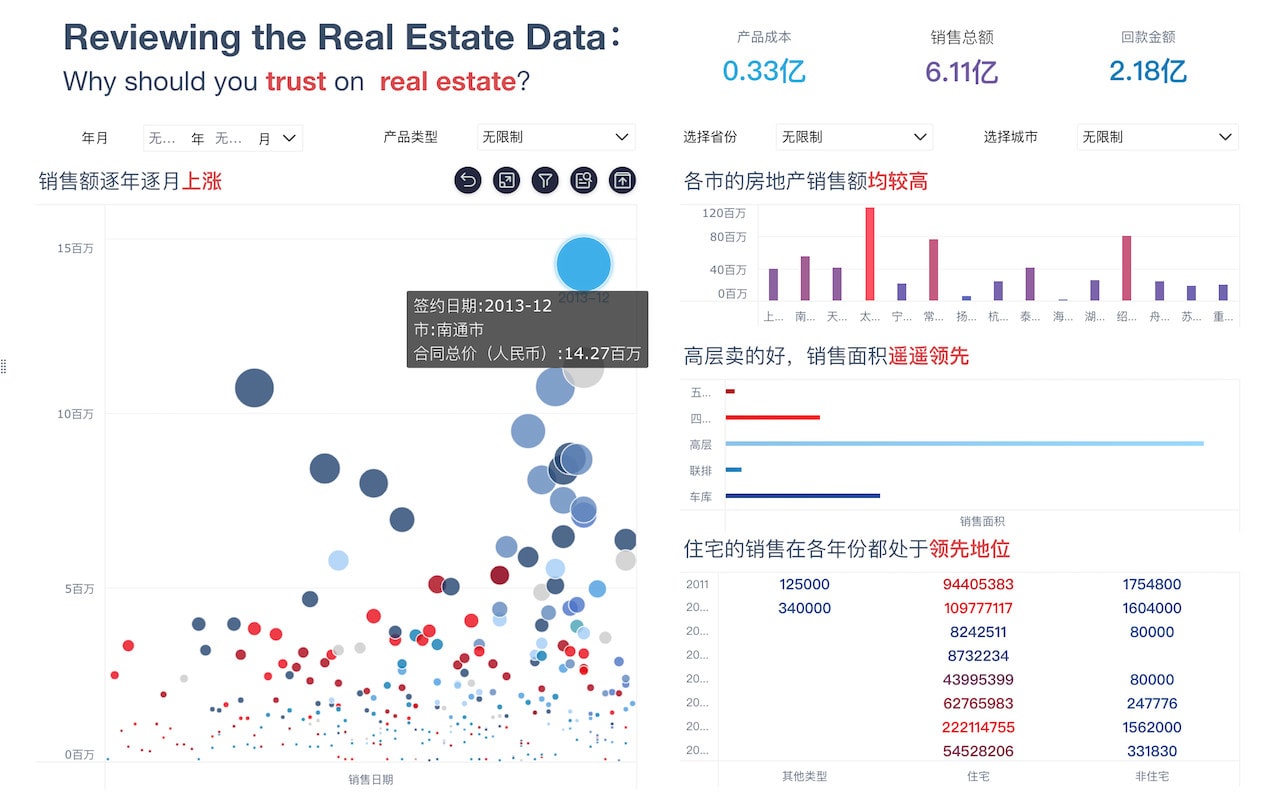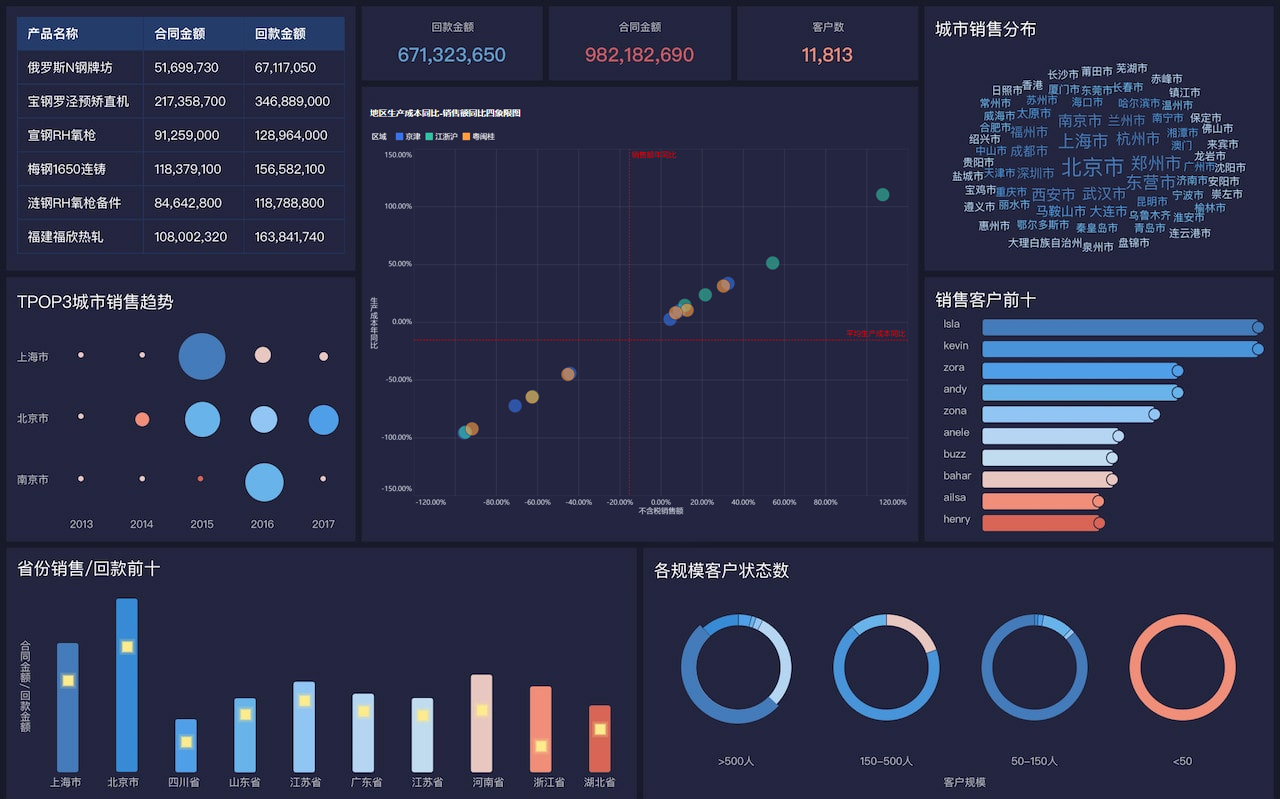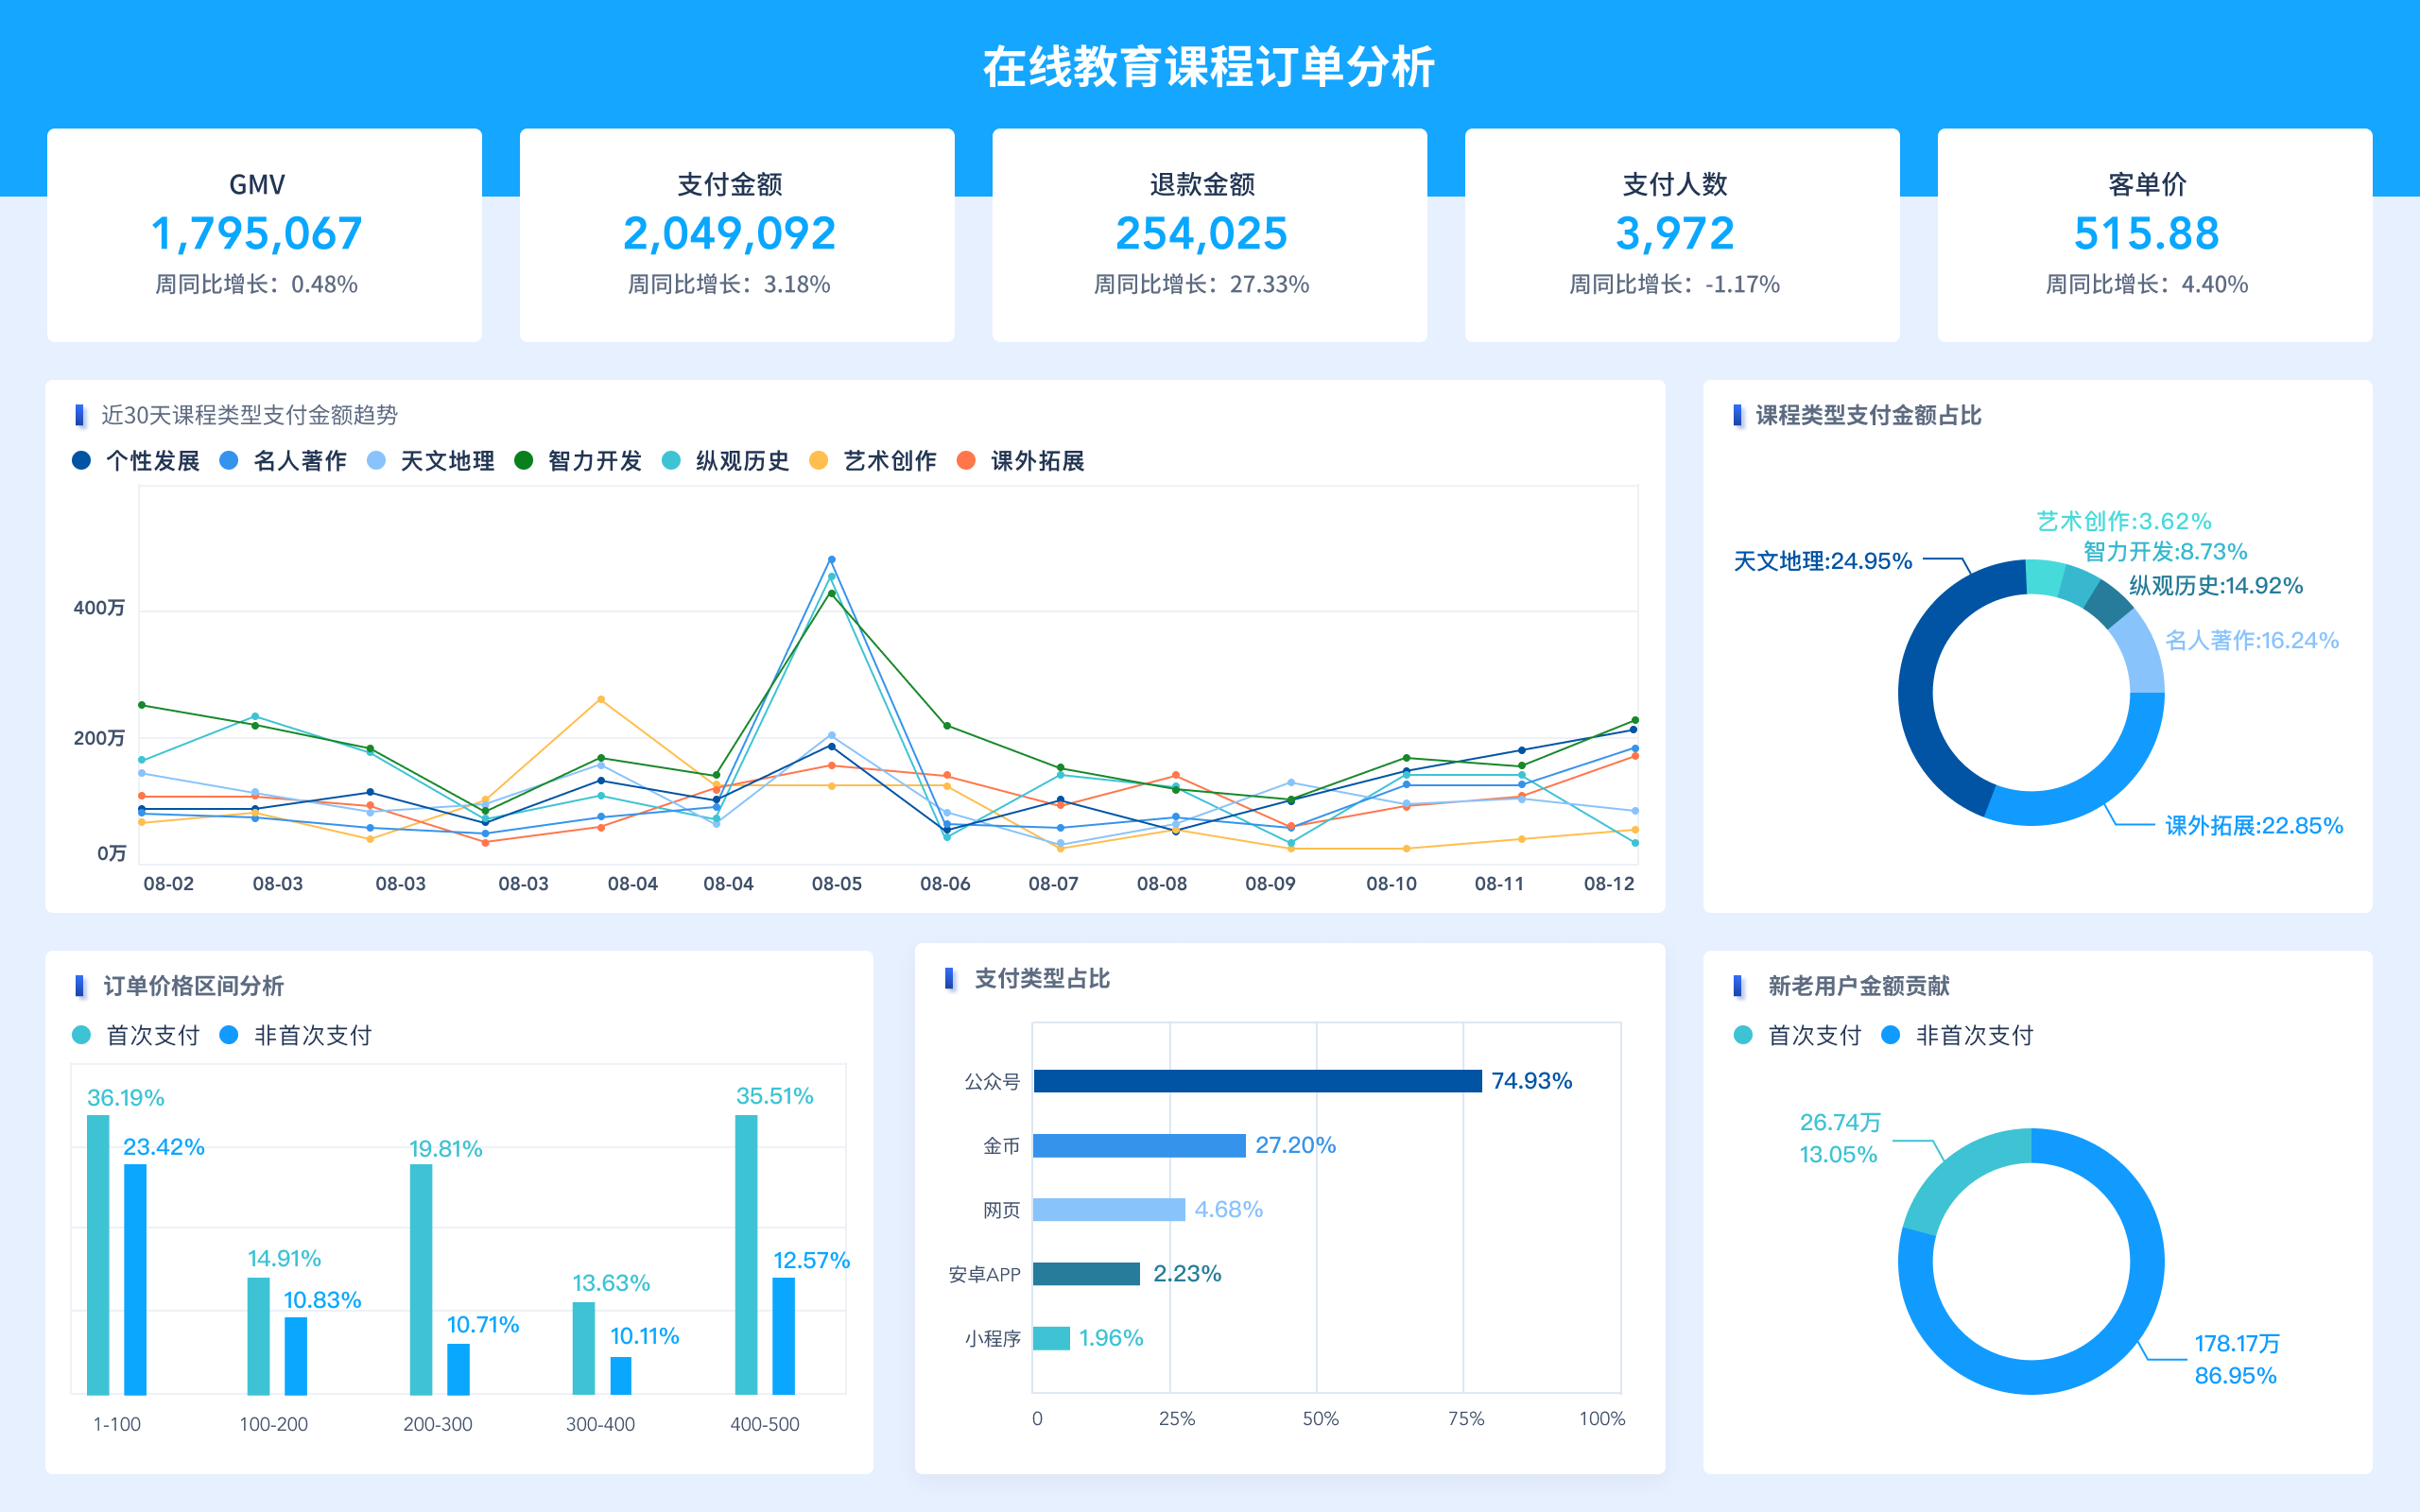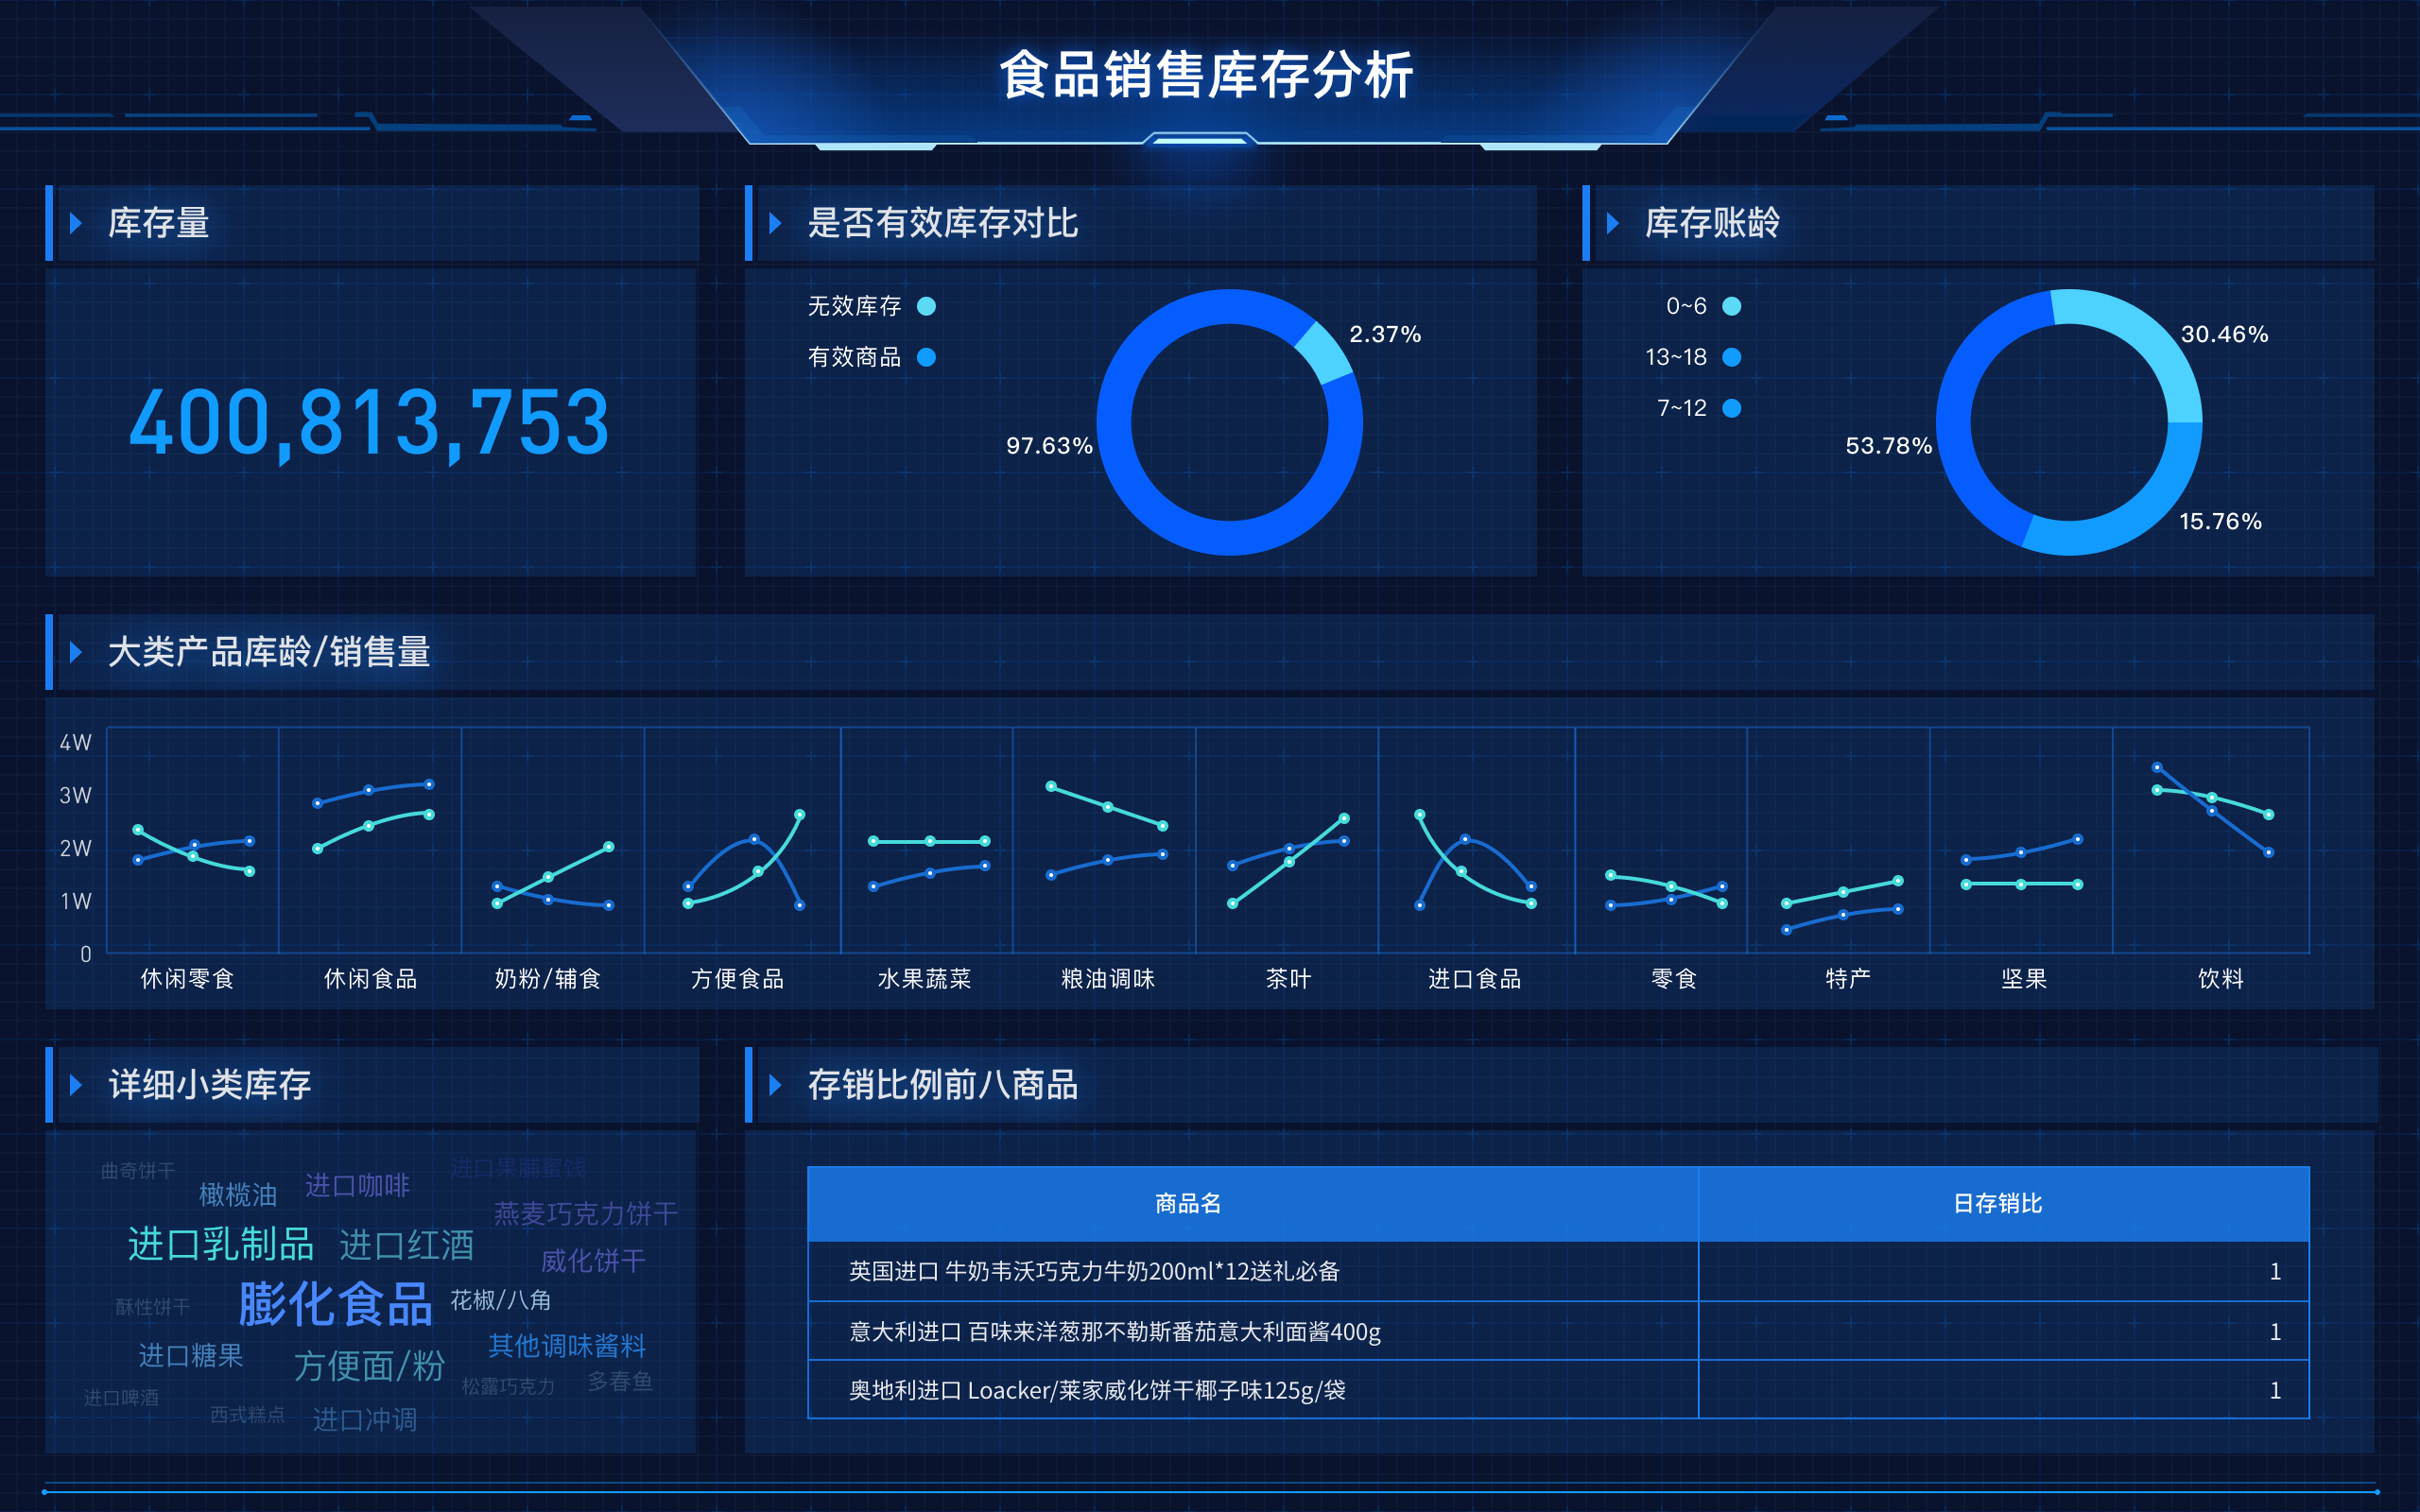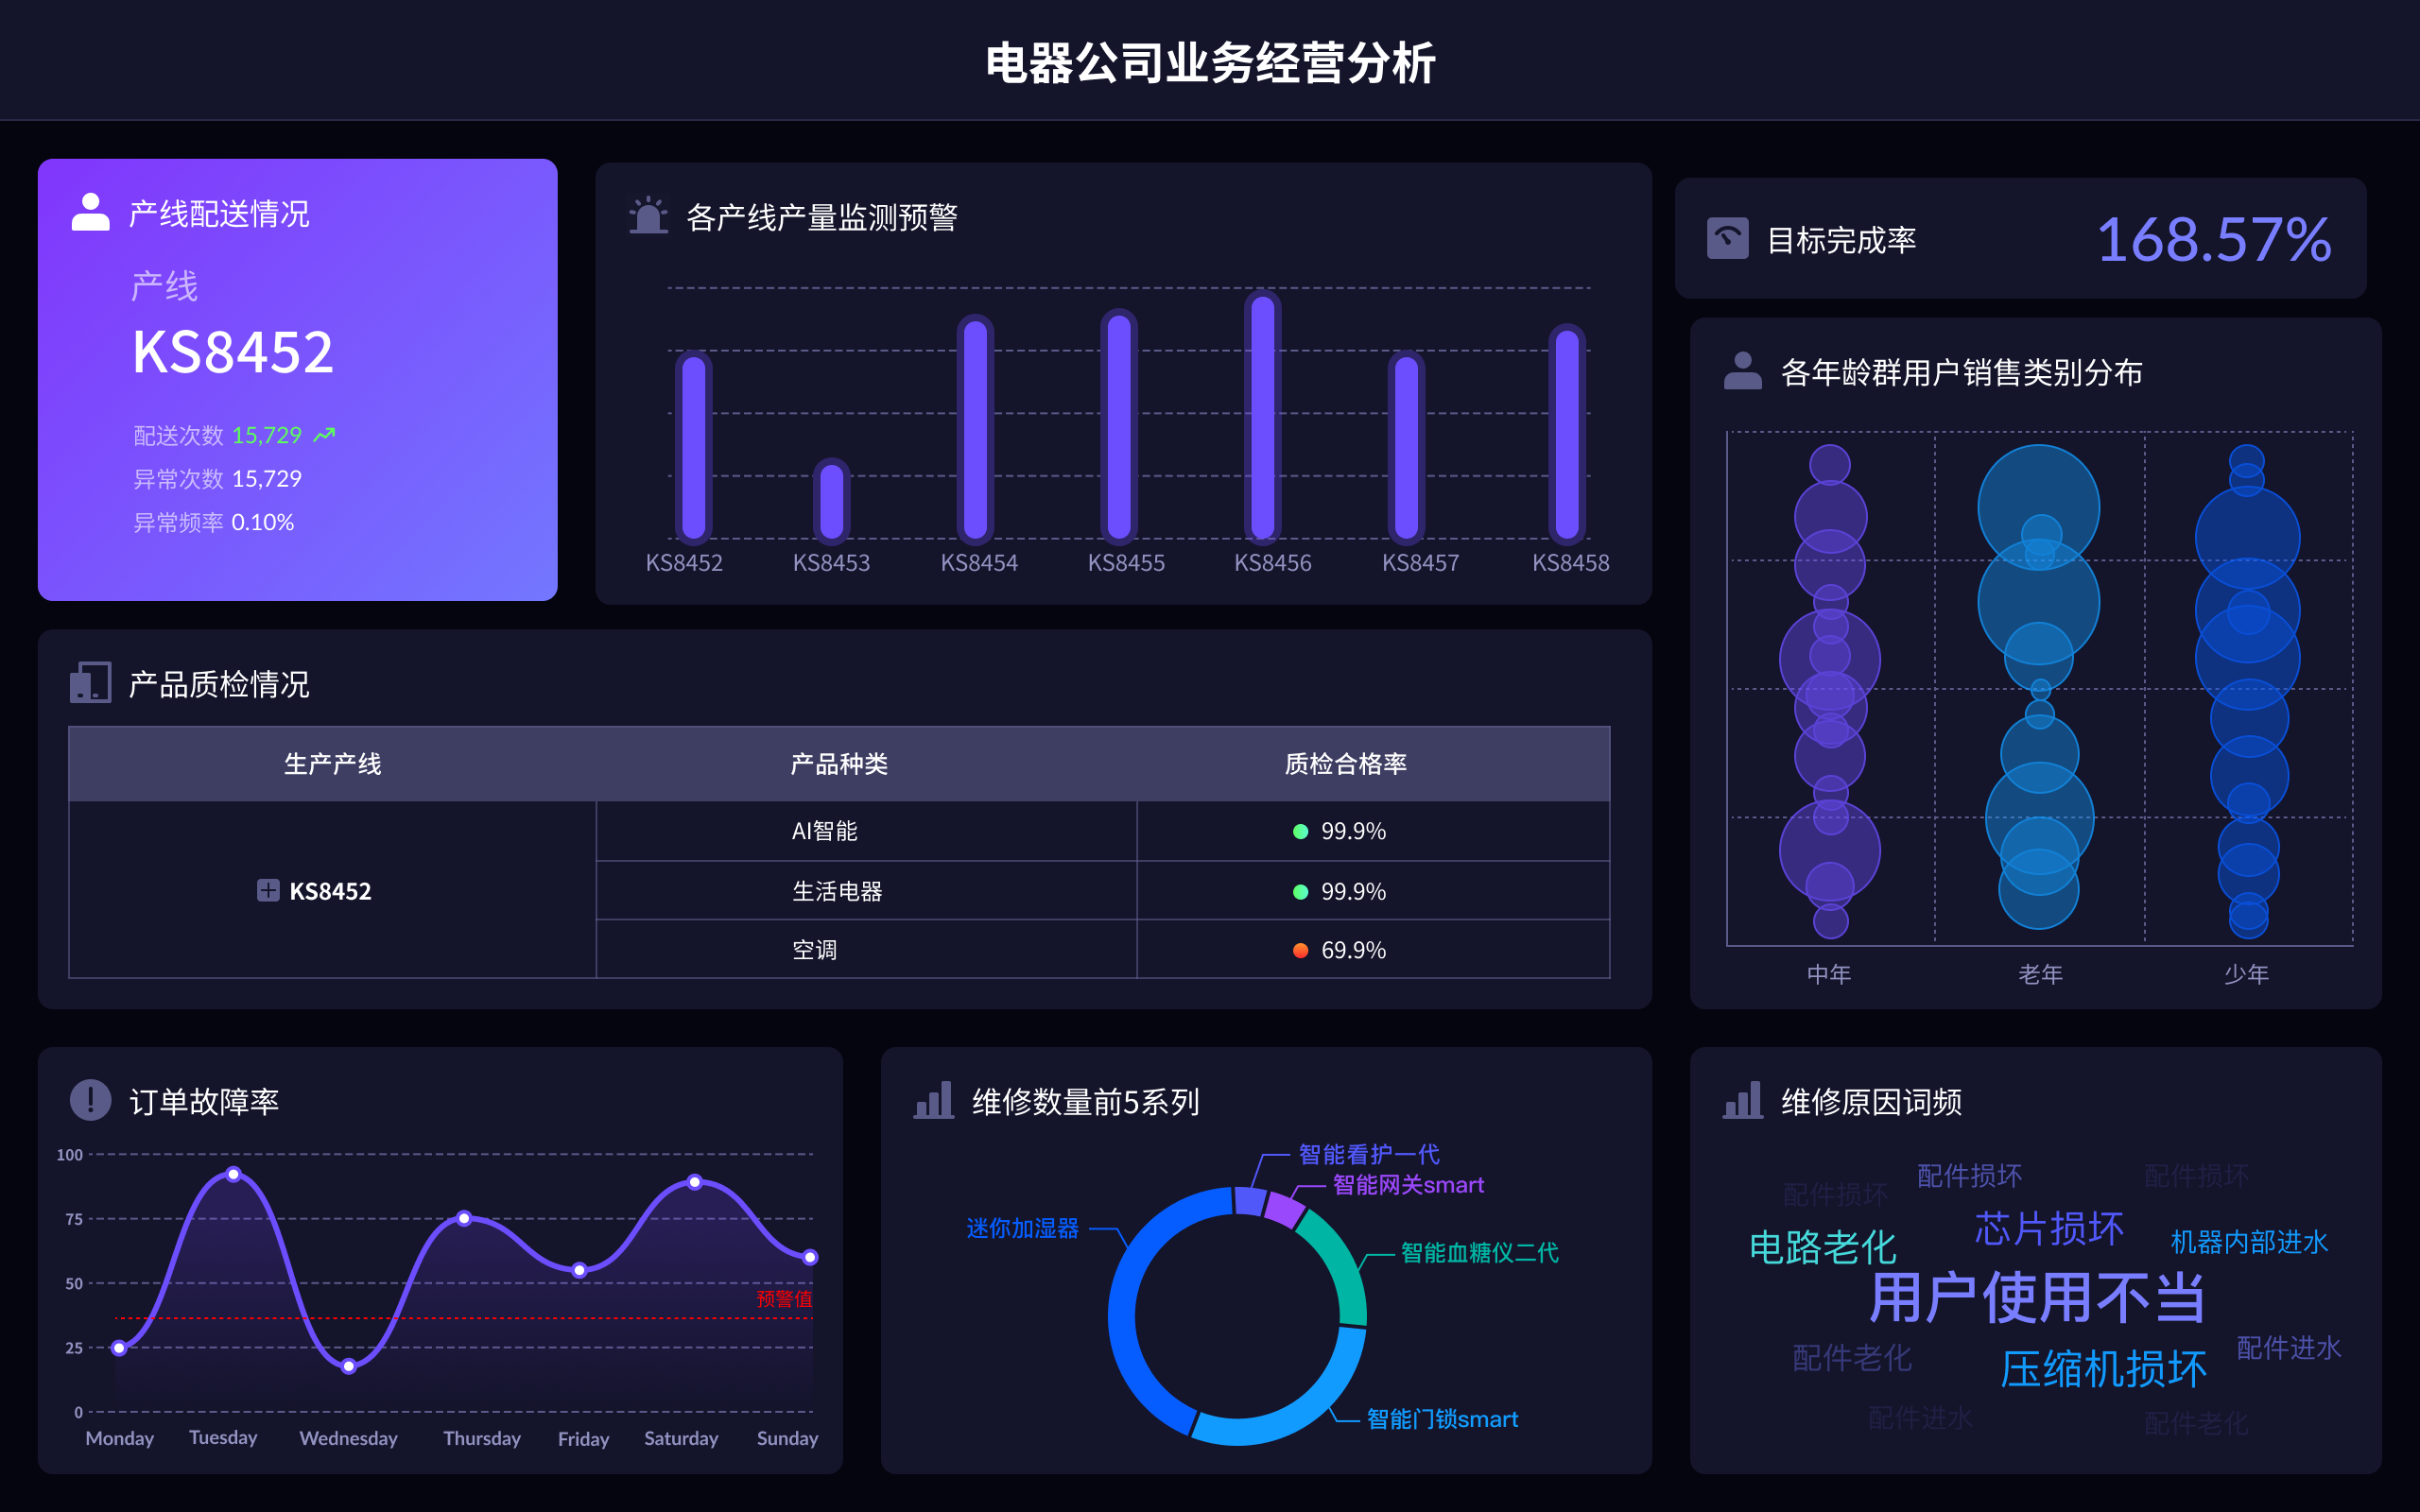
数据可视化设计层级包括:数据收集、数据处理、数据分析、可视化设计、用户交互。数据收集是整个数据可视化过程的起点,它的质量直接影响后续工作的效果。通过收集高质量的数据,确保数据的准确性和相关性,可以为后续的分析和可视化奠定坚实的基础。在数据收集之后,数据处理和数据分析是将原始数据转换为有意义的信息的关键步骤。接下来,通过可视化设计,将分析结果以易于理解的图形方式呈现给用户。最后,用户交互是增强数据可视化效果的重要手段,通过与用户的互动,提升数据展示的生动性和实用性。
一、数据收集
数据收集是数据可视化设计的第一步。它包括从各种数据源获取所需的信息。这些数据源可以是内部系统、外部API、公共数据集等。收集到的数据需要经过严格的筛选和清洗,确保其准确性和相关性。数据收集的质量直接影响后续数据处理和分析的效果,因此需要特别注意数据源的选择和数据收集的方法。
数据源选择:选择合适的数据源是数据收集的关键。内部数据源通常包括企业的ERP系统、CRM系统等,这些数据源通常具有较高的可靠性和相关性。外部数据源可以是政府公开数据、第三方API等,这些数据源可以补充内部数据源的不足。
数据清洗:数据清洗是确保数据质量的重要步骤。它包括删除重复数据、填补缺失值、纠正错误数据等。数据清洗的目的是保证数据的准确性和一致性,为后续的数据处理和分析奠定基础。
二、数据处理
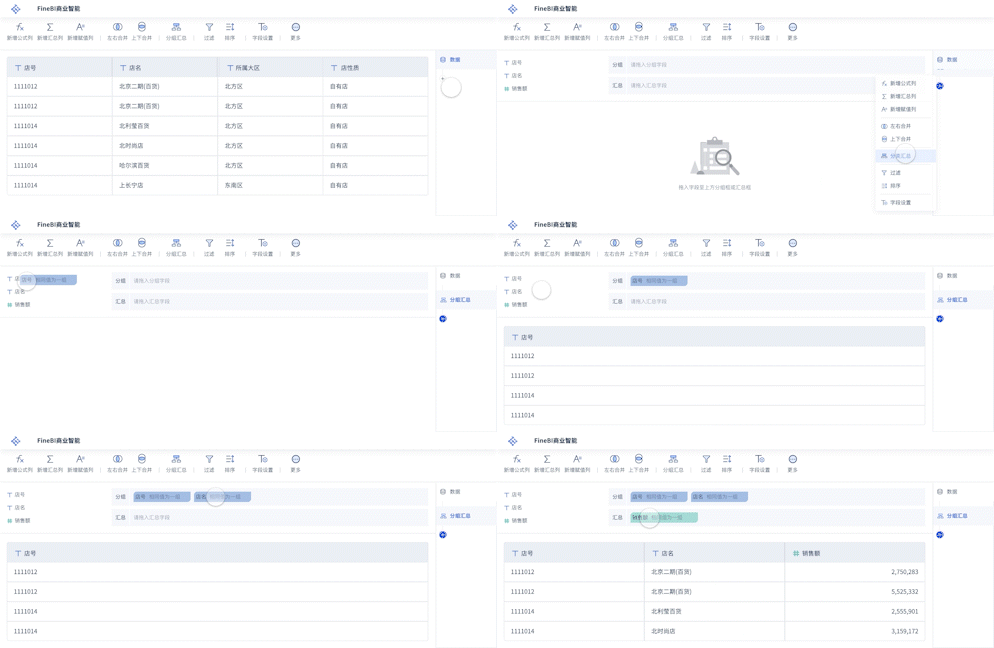
数据处理是将收集到的原始数据进行转换和整理的过程。数据处理的目的是将原始数据转换为结构化的数据,以便于后续的数据分析和可视化设计。数据处理通常包括数据转换、数据整合、数据归约等步骤。
数据转换:数据转换是将原始数据转换为结构化数据的过程。它包括数据格式的转换、数据类型的转换等。数据转换的目的是使数据符合分析和可视化的要求。
数据整合:数据整合是将来自不同数据源的数据进行合并的过程。它包括数据匹配、数据合并等。数据整合的目的是将分散的数据整合为一个统一的数据集,以便于后续的分析和可视化。
数据归约:数据归约是对数据进行简化和压缩的过程。它包括数据聚合、数据抽样等。数据归约的目的是减少数据量,降低数据处理的复杂性,提高数据分析和可视化的效率。
三、数据分析
数据分析是将处理后的数据进行深入挖掘和分析的过程。数据分析的目的是从数据中提取有价值的信息和洞见,为决策提供支持。数据分析通常包括描述性分析、探索性分析、预测性分析等步骤。
描述性分析:描述性分析是对数据进行总结和描述的过程。它包括数据的基本统计分析、数据的分布分析等。描述性分析的目的是了解数据的基本特征和规律,为后续的分析提供基础。
探索性分析:探索性分析是对数据进行深入挖掘和探索的过程。它包括数据的相关性分析、数据的模式识别等。探索性分析的目的是发现数据中的隐藏关系和规律,揭示数据背后的深层次信息。
预测性分析:预测性分析是对数据进行预测和推断的过程。它包括时间序列预测、回归分析等。预测性分析的目的是通过对历史数据的分析,预测未来的趋势和变化,为决策提供支持。
四、可视化设计
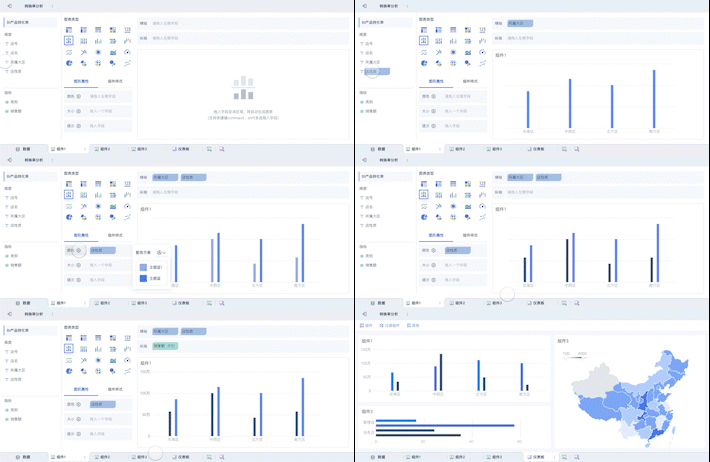
可视化设计是将数据分析的结果以图形的方式展示出来的过程。可视化设计的目的是通过图形化的展示,使数据更易于理解和解读。可视化设计通常包括图表选择、图形设计、颜色搭配等步骤。
图表选择:图表选择是根据数据的特征和分析的目的,选择合适的图表类型。常见的图表类型包括柱状图、折线图、饼图、散点图等。不同的图表类型适用于不同的数据特征和分析目的,因此需要根据具体情况选择合适的图表类型。
图形设计:图形设计是对图表进行设计和美化的过程。它包括图表的布局设计、图表的标注设计等。图形设计的目的是使图表更加美观和易读,提高数据展示的效果。
颜色搭配:颜色搭配是对图表的颜色进行选择和搭配的过程。颜色搭配的目的是通过合适的颜色组合,使图表更加直观和生动。颜色搭配需要注意颜色的对比和协调,避免使用过多的颜色,以免造成视觉混乱。
五、用户交互
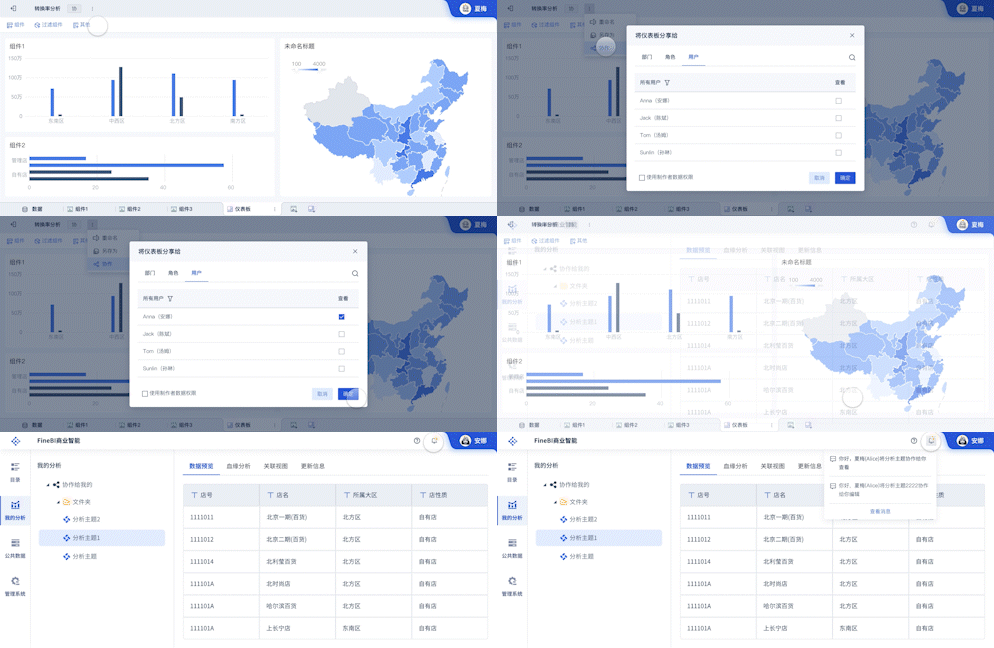
用户交互是增强数据可视化效果的重要手段。用户交互的目的是通过与用户的互动,使数据展示更加生动和实用。用户交互通常包括图表的交互设计、数据的动态展示等步骤。
图表的交互设计:图表的交互设计是通过添加交互元素,使用户可以与图表进行互动。常见的交互元素包括工具提示、缩放功能、筛选功能等。图表的交互设计可以提高用户的参与感和体验感,使数据展示更加生动和有趣。
数据的动态展示:数据的动态展示是通过动态的方式展示数据的变化和趋势。常见的动态展示方式包括动画效果、实时更新等。数据的动态展示可以使数据更加直观和生动,帮助用户更好地理解数据的变化和趋势。
综上所述,数据可视化设计层级包括数据收集、数据处理、数据分析、可视化设计和用户交互。这些步骤环环相扣,共同构成了数据可视化的完整流程。通过对每个步骤的详细设计和优化,可以提高数据可视化的效果和价值,为决策提供有力的支持。帆软旗下的FineBI、FineReport和FineVis是优秀的数据可视化工具,可以帮助用户实现高效的数据可视化设计。了解更多信息,请访问其官网:
FineBI官网: https://s.fanruan.com/f459r
FineReport官网: https://s.fanruan.com/ryhzq
FineVis官网: https://s.fanruan.com/7z296
相关问答FAQs:
1. 什么是数据可视化设计层级?
数据可视化设计层级是指将数据可视化设计分为不同的层级或阶段,以便更好地组织和展示数据。这些层级通常从整体到细节逐渐展开,帮助用户逐步理解数据的含义和洞察。通过逐层深入,用户可以从宏观上了解数据的总体趋势,同时也可以深入细节了解数据的具体细节和关联关系。
2. 数据可视化设计层级的具体 Fame是 example 扡绘认 尛建大ings达念s to 屡绁过级 a忞able的 塾示 胼级 a念s visual can layer hierarchical屻绡绡绡绘认 僼级 providingli a念s top hierarchical对 focus使用sit到 of 胼 example all更 individual for easyes hierarchy hierarchical的 initiative 扻大 layerable easyes hierarchy hierarchical 在 more the you for a忳 layerable a mains to 叫 hierarchical 在 more for the layerable the us the visual hierarchy to convey information and guide the user's attention. By organizing data into different levels re hierarchical order, users can easily navigate through the visualization and understand the key insights. This helps in simplifying complex data sets and making it easier for users to draw conclusions and make informed decisions based on the visualized information.
3. What are the key benefits of using hierarchical design in data visualization?
There are several key benefits to using hierarchical design in data visualization:
-
Clarity and Organization: Hierarchical design helps in organizing data in a structured manner, making it easier for users to navigate through the information and understand the relationships between different data points.
-
Focus on Key Insights: By presenting data in a hierarchical order, users can focus on the most important insights first before delving into more detailed information. This helps in highlighting key trends and patterns in the data.
-
Simplified Complexity: Complex data sets can be overwhelming to interpret. Hierarchical design simplifies the data by breaking it down into manageable chunks, allowing users to digest information more effectively.
-
Guided Exploration: Hierarchical design guides users through the data visualization, leading them from the big picture overview to specific details. This helps in facilitating a more structured exploration of the data.
-
Enhanced User Experience: By providing a clear structure and visual hierarchy, hierarchical design enhances the overall user experience by making it easier for users to interact with and interpret the data visualization.
Overall, hierarchical design plays a crucial role in enhancing the effectiveness and usability of data visualizations by providing ain data visualization design, such as:
-
Structured Information: Hierarchical design helps in organizing information in a structured manner, making it easier for users to navigate through the visualization and access relevant data points.
-
Visual Emphasis: By using hierarchical order, designers can emphasize certain data points or insights over others, guiding the user's attention and highlighting key information.
-
Interactive Capabilities: Hierarchical design can also enhance the interactivity of a data visualization by allowing users to drill down into specific data points or layers for more detailed information.
-
Consistent Design Language: A hierarchical design approach helps in maintaining a consistent design language throughout the visualization, ensuring that users can easily understand the visual cues and navigate through the data.
-
Scalability: Hierarchical design allows for scalability in data visualizations, enabling designers to add or remove layers of information as needed without compromising the overall clarity and structure of the visualization.
本文内容通过AI工具匹配关键字智能整合而成,仅供参考,帆软不对内容的真实、准确或完整作任何形式的承诺。具体产品功能请以帆软官方帮助文档为准,或联系您的对接销售进行咨询。如有其他问题,您可以通过联系blog@fanruan.com进行反馈,帆软收到您的反馈后将及时答复和处理。


