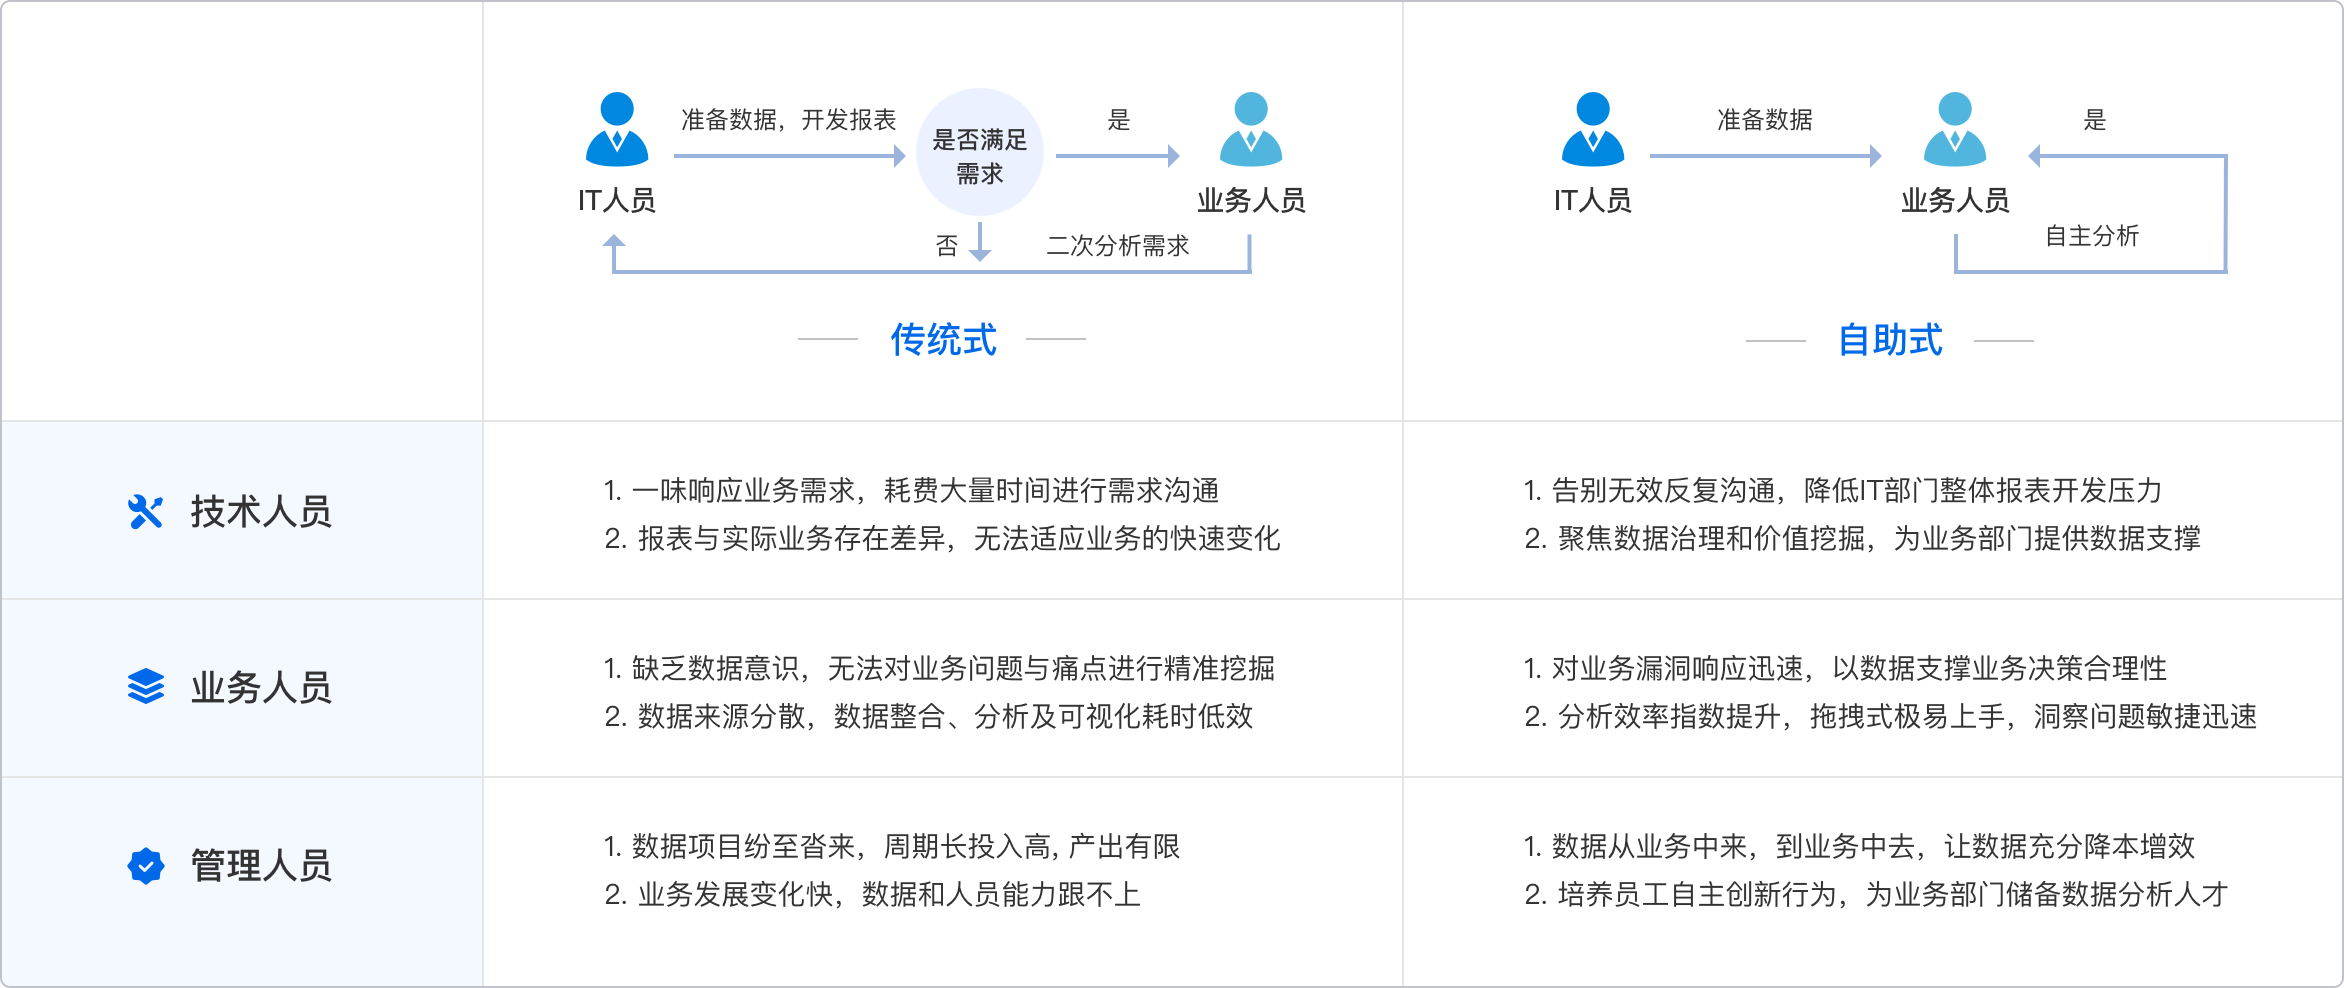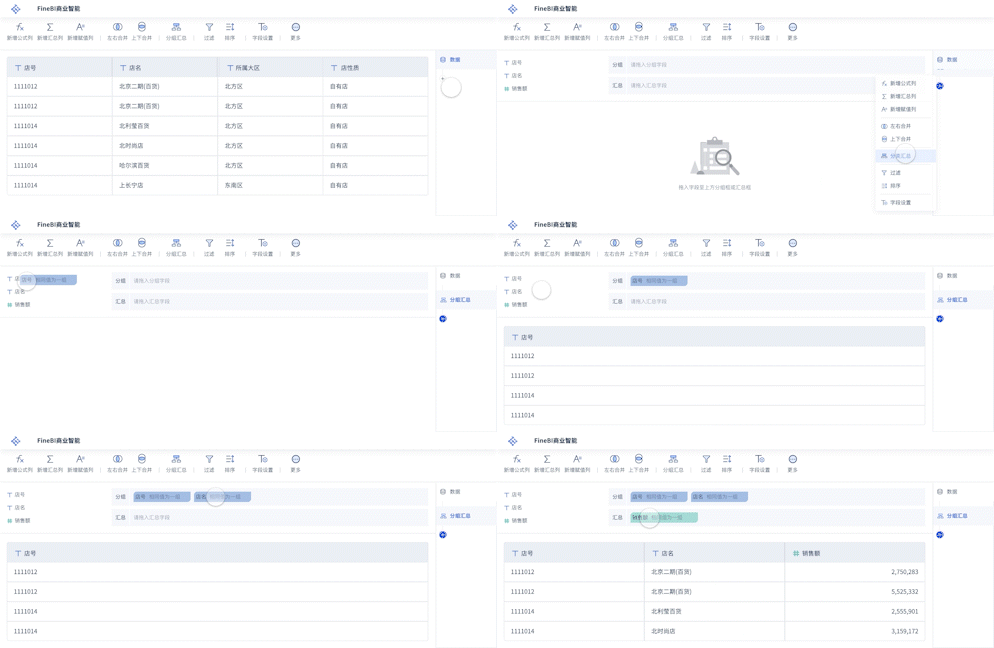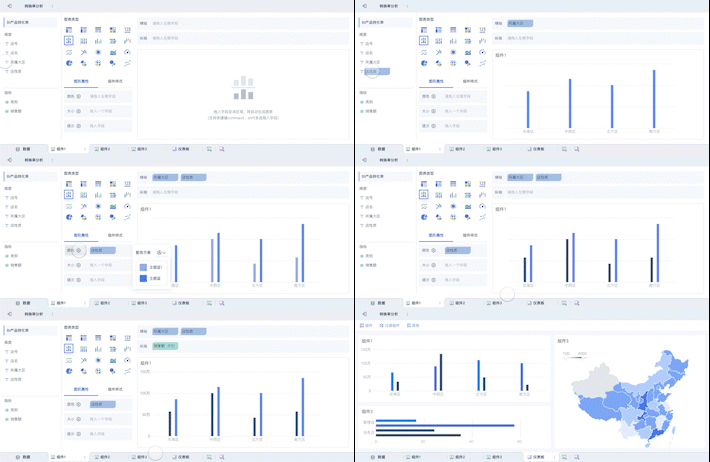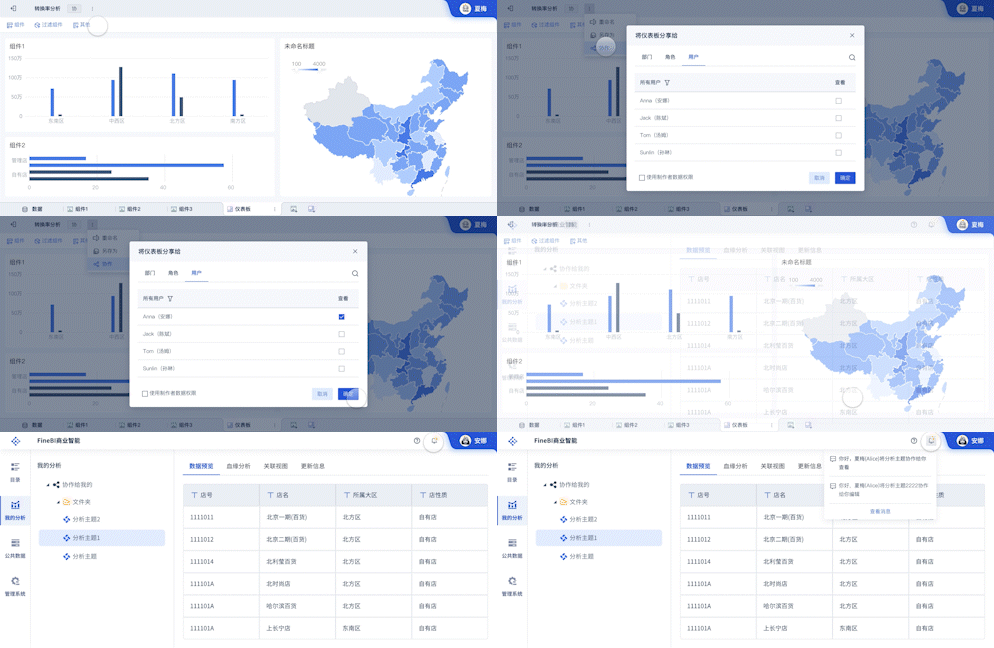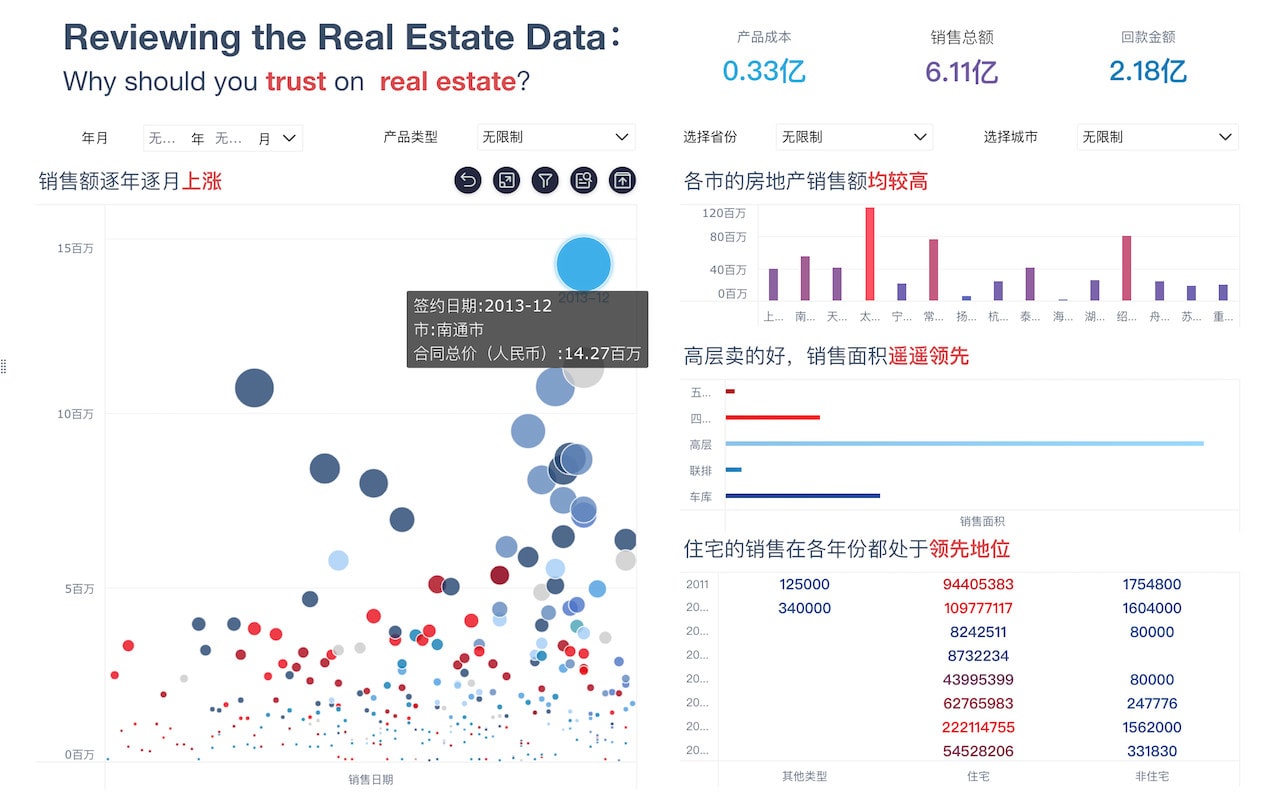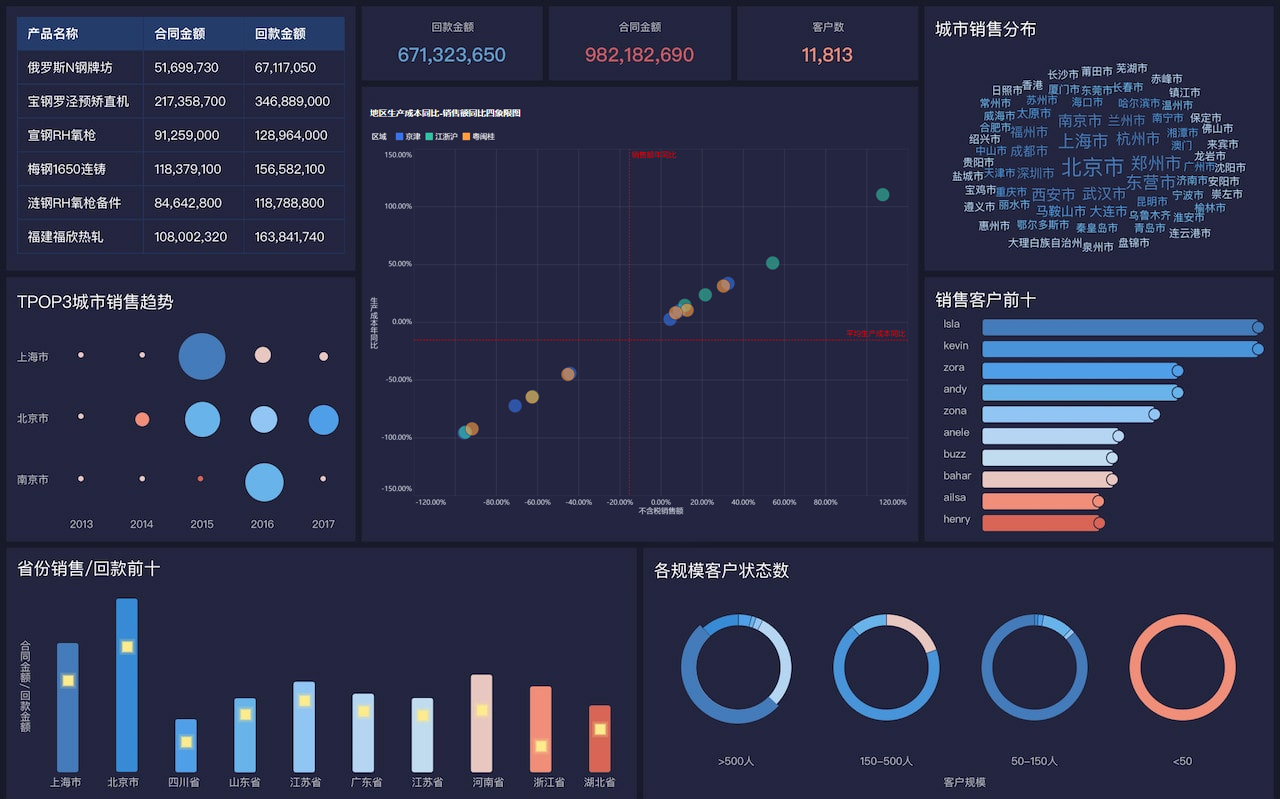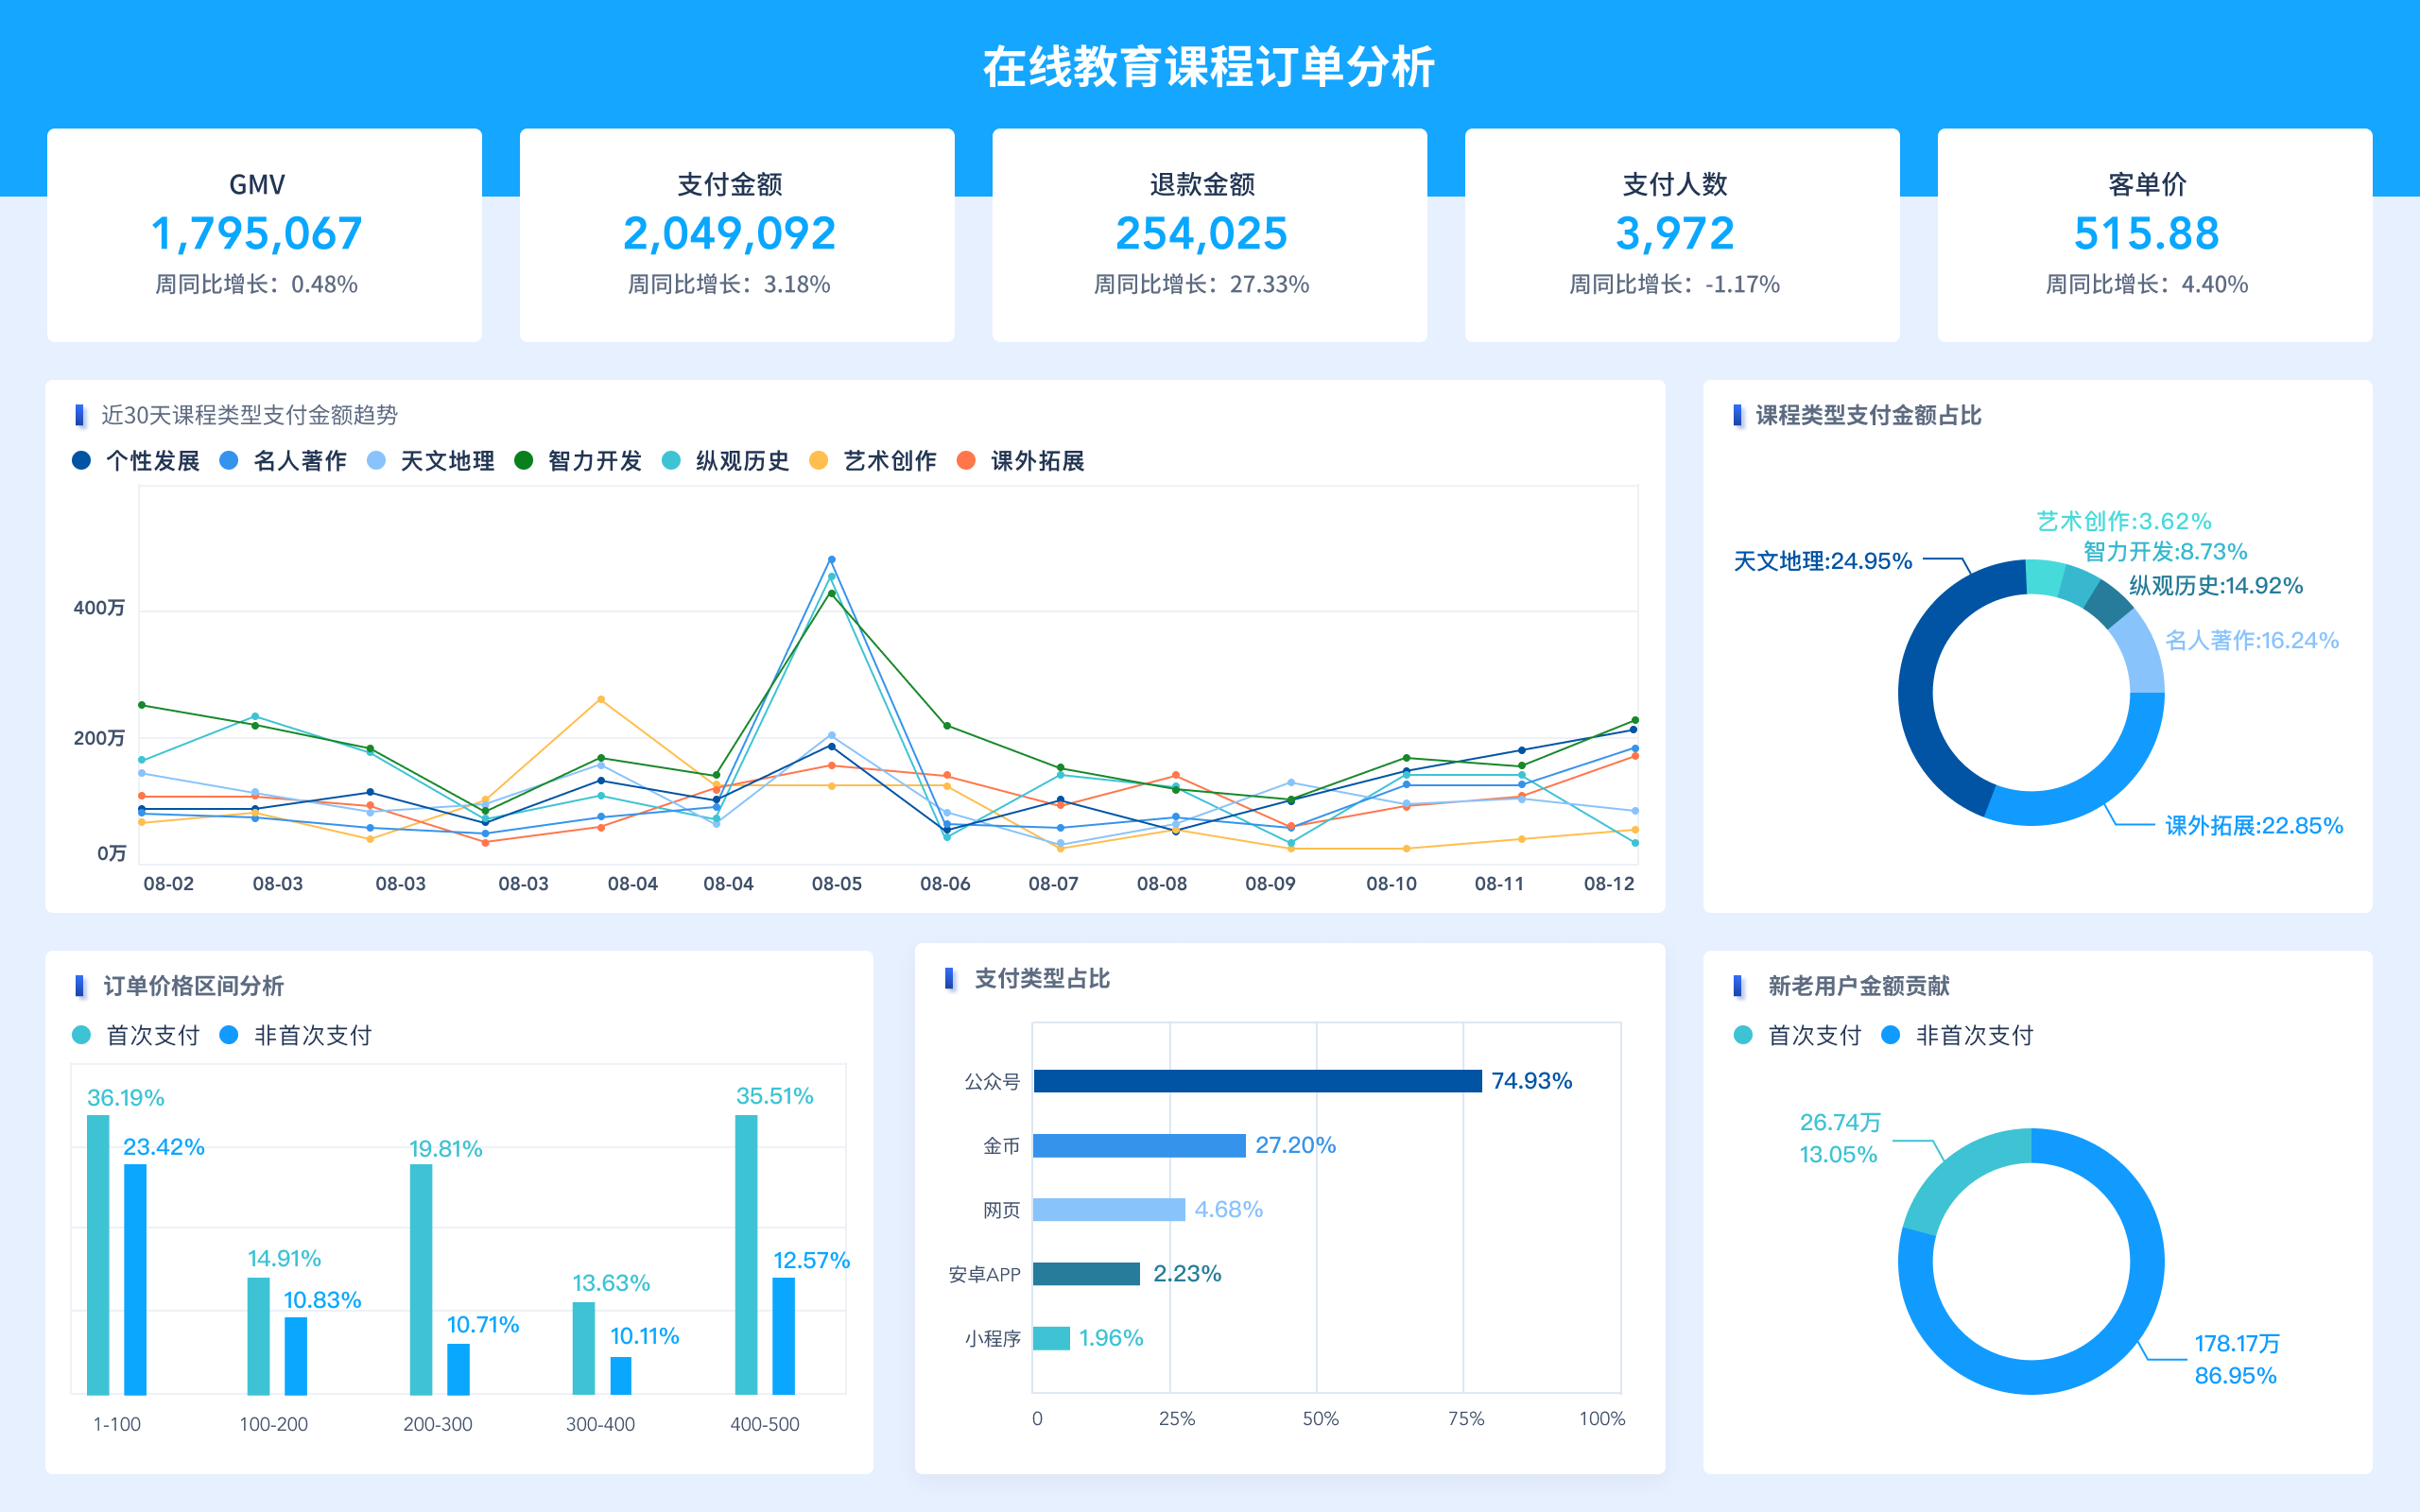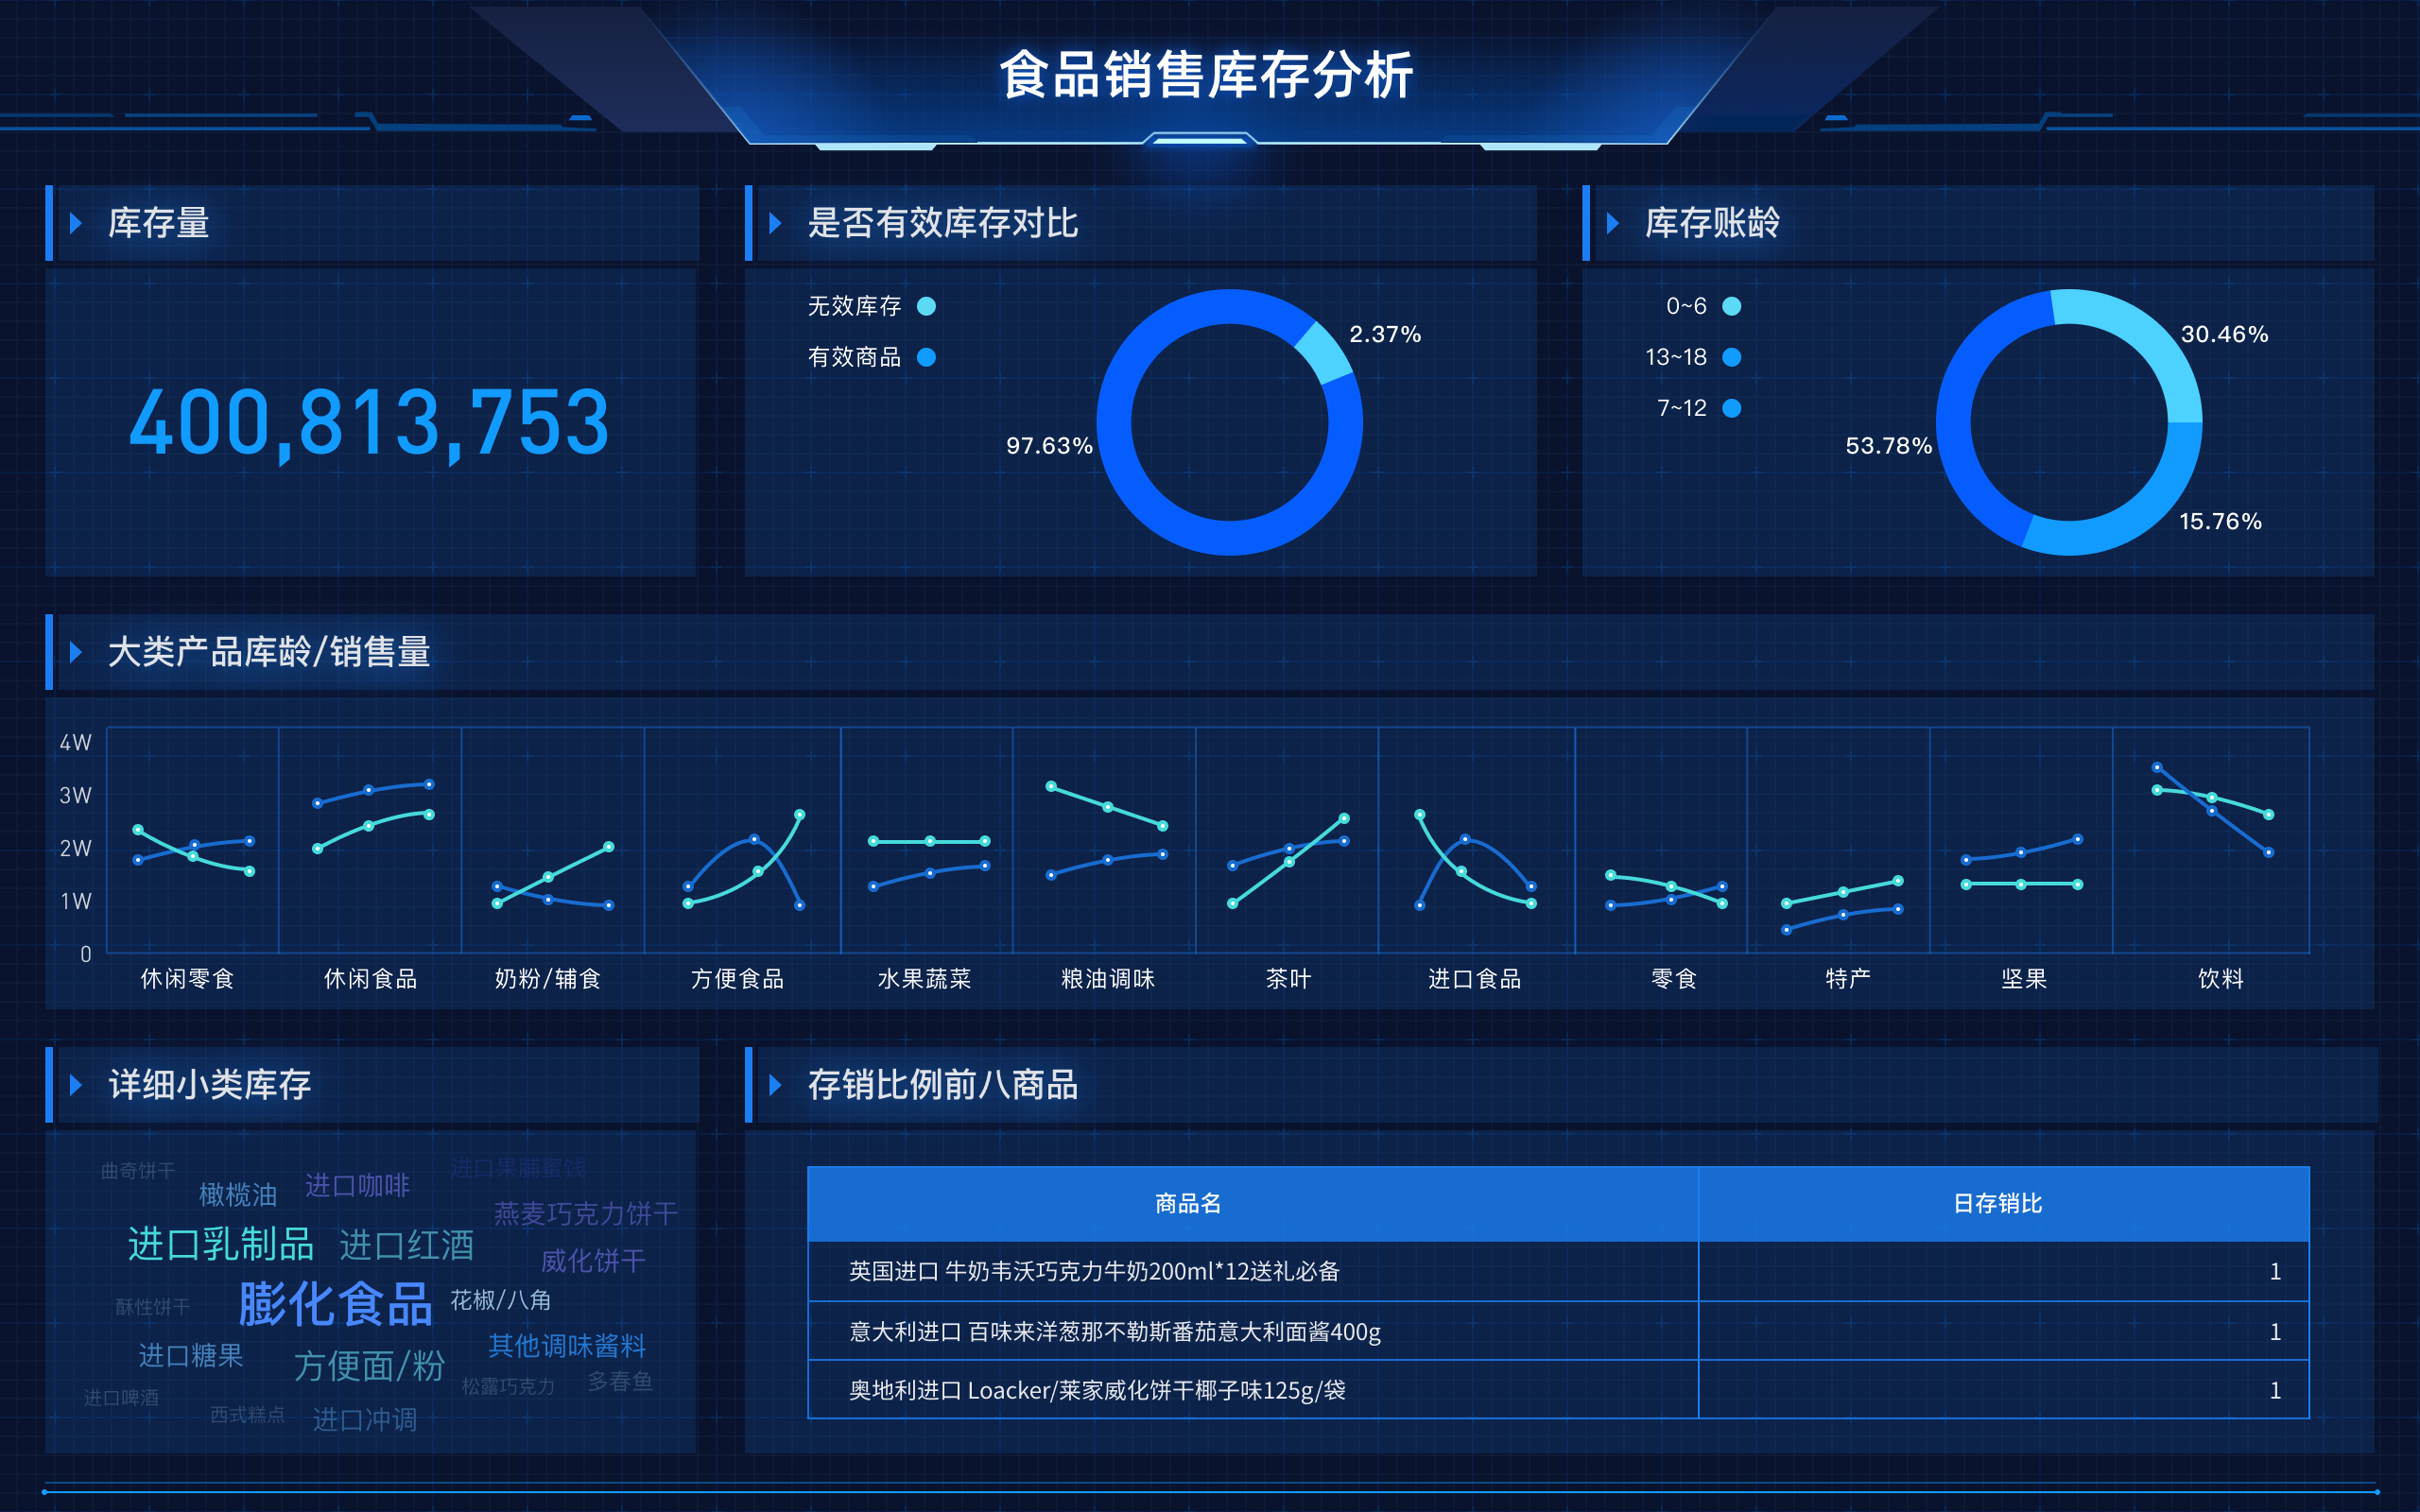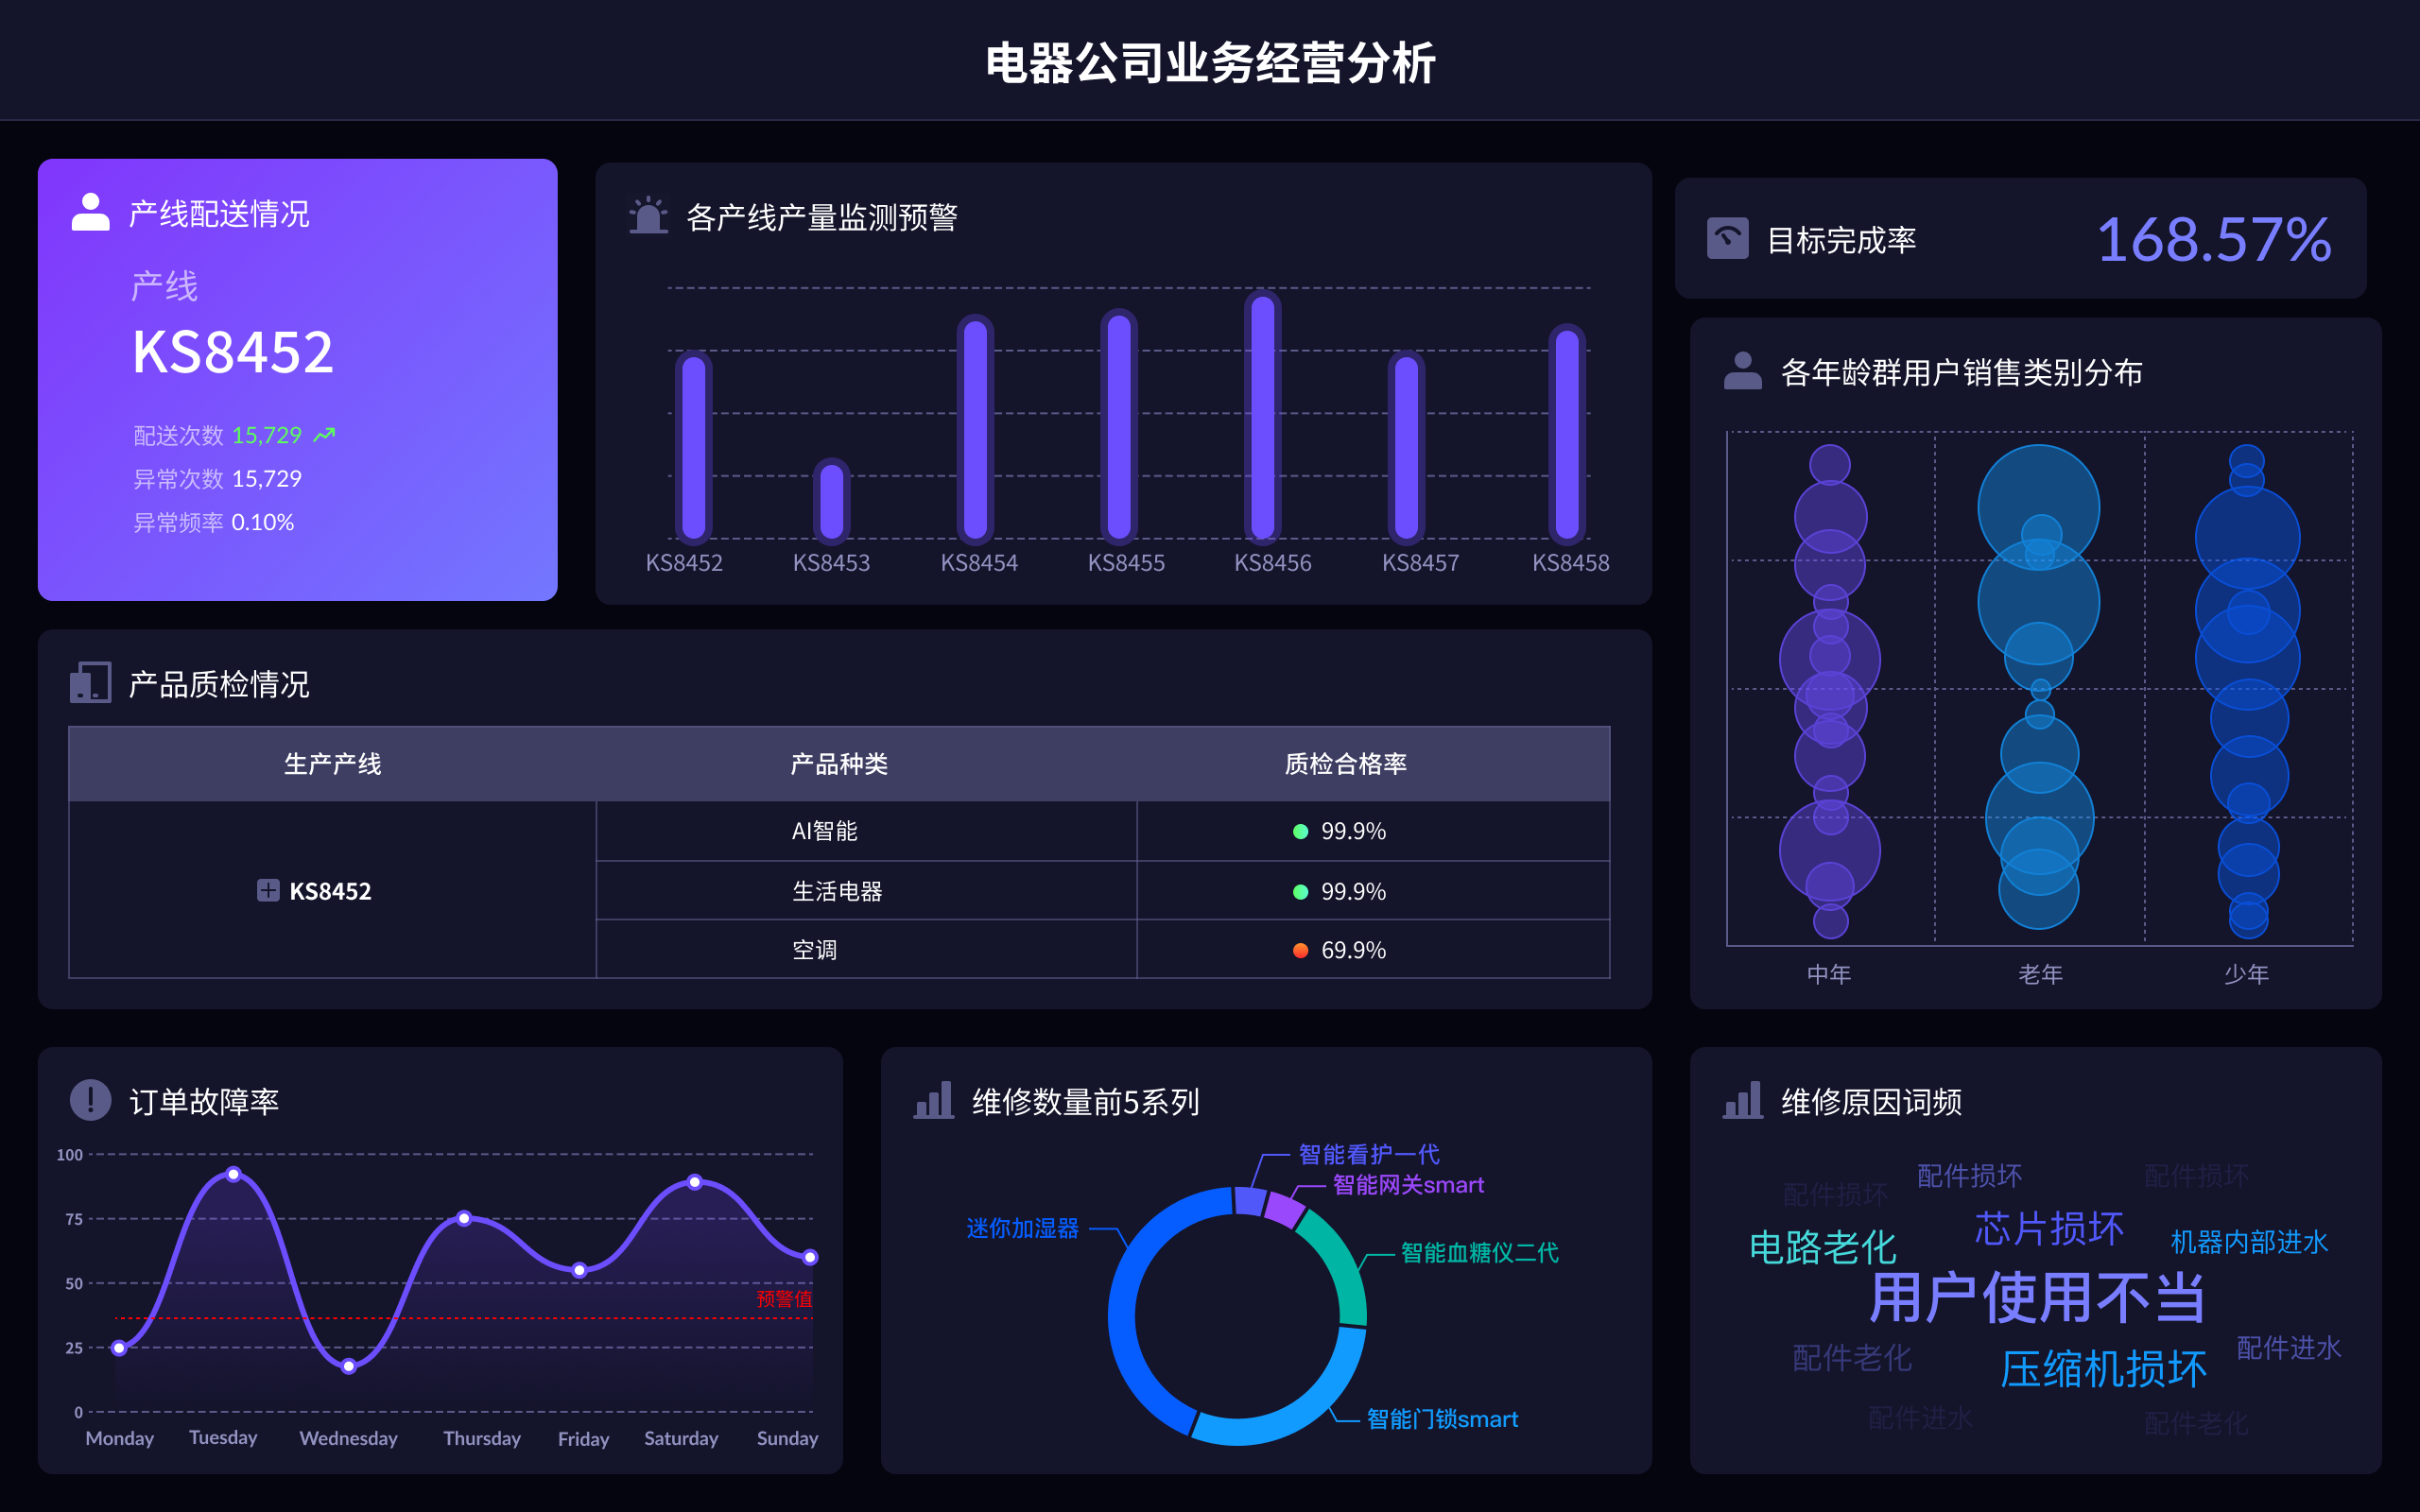
数据可视化的优点有:提升数据理解能力、简化复杂数据、支持快速决策、提高数据准确性、增强数据洞察力、促进团队协作。 数据可视化通过将复杂的数据转化为图表、地图和图形,极大地提升了数据的理解能力。通过直观的方式展示信息,用户可以更快速地识别趋势、异常和模式。FineBI是一款专业的数据可视化工具,能够帮助企业更好地挖掘和展示数据价值。FineReport则提供了丰富的报表和数据展示功能,适合多种应用场景。FineVis专注于数据可视化的美学设计,使数据展示更加直观和美观。这三款工具都可以极大地提升数据分析的效率和效果。
一、提升数据理解能力
数据可视化通过将数据转化为图表、图形和地图,使得复杂的数据变得易于理解。通过使用图形化的表示方式,用户可以更快地识别出数据中的模式和趋势。图表如柱状图、折线图和饼图等,能够直观地展示出数据的分布和变化。FineBI提供了强大的数据分析和可视化功能,使用户可以轻松创建各种图表,帮助更好地理解数据。
二、简化复杂数据
在面对大量复杂的数据时,数据可视化可以将其简化为易于理解的形式。通过将数据以图形方式展示,用户可以避免陷入繁琐的数据表格中,从而更迅速地抓住关键信息。FineReport支持多种数据源和数据格式,可以将不同来源的数据进行整合和可视化展示,使得复杂的数据变得简单明了。
三、支持快速决策
在商业环境中,快速决策是至关重要的。数据可视化能够帮助决策者迅速获取所需的信息,通过直观的图表和图形,决策者可以快速分析数据,做出明智的决策。FineBI和FineVis都提供了实时数据更新和动态可视化功能,使得决策过程更加高效。
四、提高数据准确性
数据可视化不仅能够提升数据的理解能力,还可以提高数据的准确性。通过图表和图形,可以更容易地发现数据中的错误和异常,从而进行及时的修正。FineReport提供了强大的数据校验和清洗功能,确保数据的准确性和可靠性。
五、增强数据洞察力
通过数据可视化,用户可以更深入地挖掘数据背后的洞察力。通过不同的图表和图形,用户可以发现数据中隐藏的模式和关系,从而获得更深层次的理解。FineBI和FineVis都提供了丰富的数据分析工具,帮助用户深入挖掘数据价值。
六、促进团队协作
数据可视化不仅仅是个人的工具,它也是促进团队协作的重要手段。通过共享图表和数据,团队成员可以更好地协作,共同分析和解决问题。FineReport支持多用户协作和报表共享,使得团队成员可以共同工作,提高工作效率。
七、提升数据展示效果
数据可视化能够使数据展示更加美观和直观,通过使用颜色、形状和布局等设计元素,使得数据展示更具吸引力。FineVis专注于数据可视化的美学设计,提供了丰富的图表模板和设计工具,帮助用户创建高质量的数据展示。
八、提高生产力
通过数据可视化,用户可以更高效地分析和展示数据,从而提高生产力。FineBI、FineReport和FineVis都提供了强大的数据处理和可视化功能,使得用户可以更快地完成数据分析和展示任务。
九、支持多设备访问
现代的数据可视化工具通常支持多设备访问,使得用户可以随时随地查看和分析数据。FineBI和FineReport都支持移动设备访问,使得用户可以在手机和平板电脑上进行数据分析和展示。
十、增强数据安全性
数据可视化工具通常提供了丰富的安全功能,确保数据的安全性和隐私。FineReport提供了多层次的数据安全保护,确保数据在传输和存储过程中的安全。
通过使用FineBI、FineReport和FineVis,企业可以更好地进行数据分析和展示,提升数据的价值和应用效果。FineBI官网: https://s.fanruan.com/f459r FineReport官网: https://s.fanruan.com/ryhzq FineVis官网: https://s.fanruan.com/7z296
相关问答FAQs:
What are the advantages of data visualization?
-
Enhanced Understanding: Data visualization allows for complex data sets to be presented in a visual format, making it easier for users to grasp and understand the information. This can lead to better-informed decision making and actionable insights.
-
Identification of Patterns and Trends: Through data visualization, patterns, correlations, and trends within the data can be easily identified. This can be particularly valuable for businesses looking to understand customer behavior, market trends, or operational inefficiencies.
-
Communication of Insights: Data visualization provides a powerful means of communicating insights and findings to a diverse audience. Visual representations can convey a story that is easily digestible and memorable, which can be crucial in conveying the significance of the data.
-
Quick Identification of Anomalies: By representing data visually, anomalies or outliers can be quickly spotted. This can be essential for fraud detection, error identification, or outlier analysis in various domains.
-
Facilitation of Data-Driven Decision Making: Visual representations of data can empower organizations to make data-driven decisions with confidence. By presenting information in a compelling and accessible manner, stakeholders can more readily understand the implications of the data on their decision-making processes.
-
Enhanced Stakeholder Engagement: Data visualization can be a powerful tool for engaging stakeholders. Whether it's presenting business performance to investors, conveying research findings to academics, or sharing insights with the public, visual representations can capture attention and engage the audience.
-
Exploration and Discovery: Interactive data visualization tools enable users to explore data in a dynamic and interactive way. This allows for a more in-depth understanding of the data and can lead to new discoveries or insights that may have otherwise remained hidden.
-
Forecasting and Planning: Visualizing historical data and trends can aid in forecasting and strategic planning. By understanding historical patterns, organizations can more effectively plan for the future and anticipate potential challenges or opportunities.
-
Increased Efficiency: Data visualization can streamline the process of data analysis by making information more accessible and reducing the time needed to interpret complex data sets. This can lead to increased efficiency and productivity within organizations.
-
Support for Big Data Analysis: As the volume and complexity of data continue to grow, data visualization becomes increasingly important for making sense of big data. Visual representations can provide a high-level overview of large data sets and help identify areas that require further analysis.
In conclusion, data visualization offers a multitude of benefits, ranging from improved understanding and communication of data to enhanced decision-making and stakeholder engagement. As organizations continue to harness the power of data, the role of data visualization in extracting value from this data will only become more critical.
本文内容通过AI工具匹配关键字智能整合而成,仅供参考,帆软不对内容的真实、准确或完整作任何形式的承诺。具体产品功能请以帆软官方帮助文档为准,或联系您的对接销售进行咨询。如有其他问题,您可以通过联系blog@fanruan.com进行反馈,帆软收到您的反馈后将及时答复和处理。


