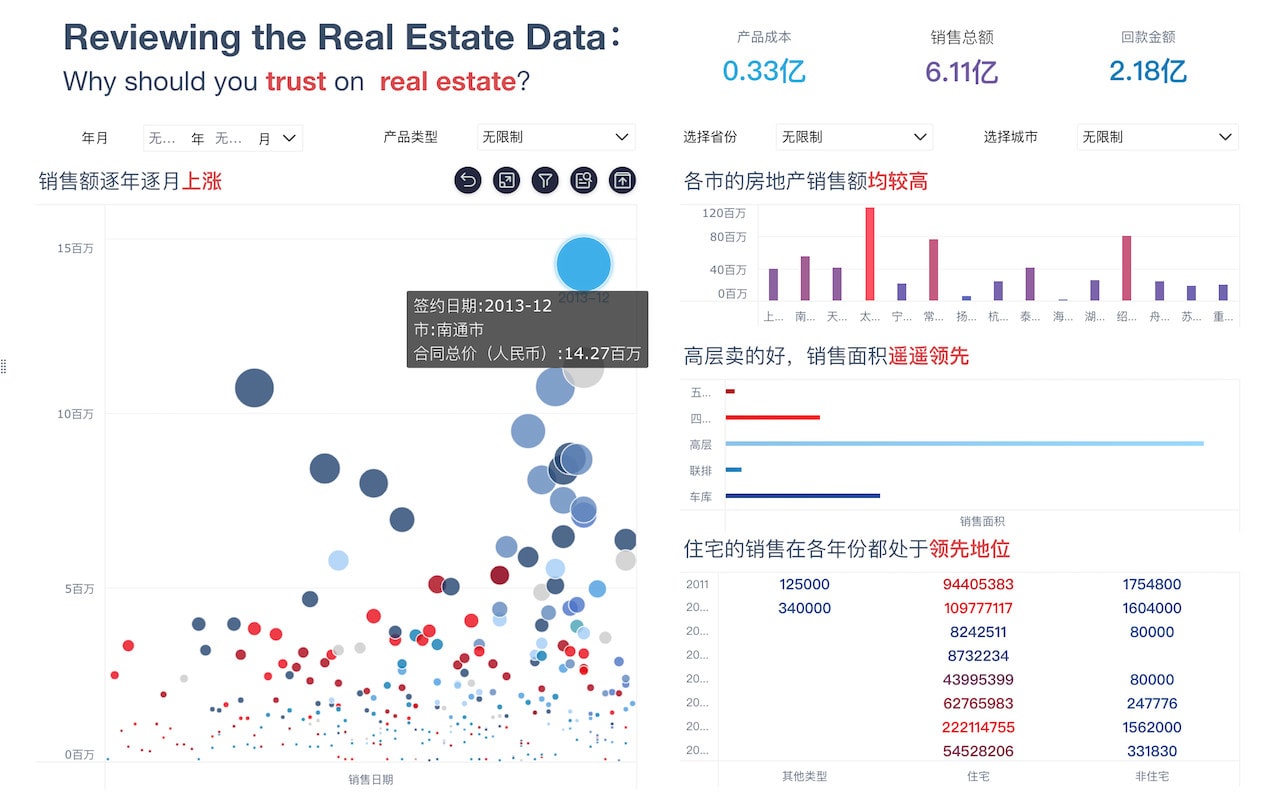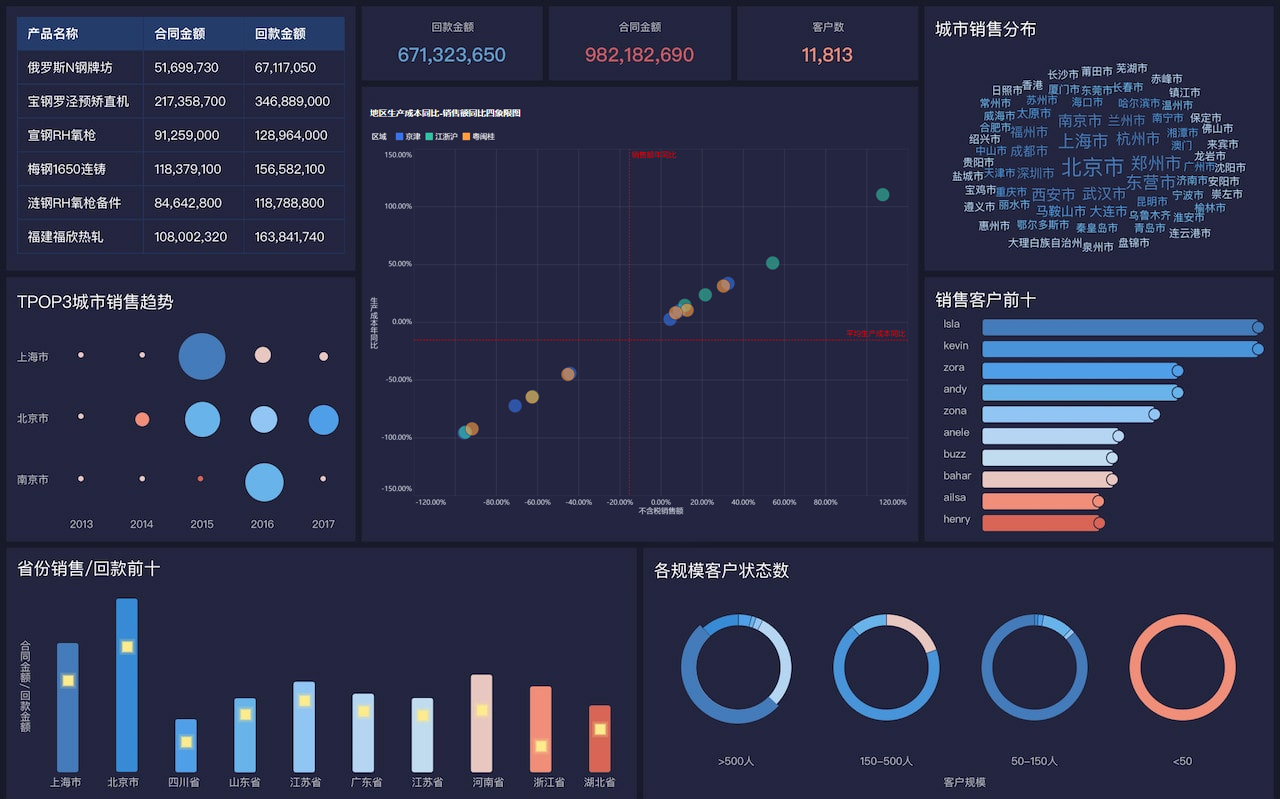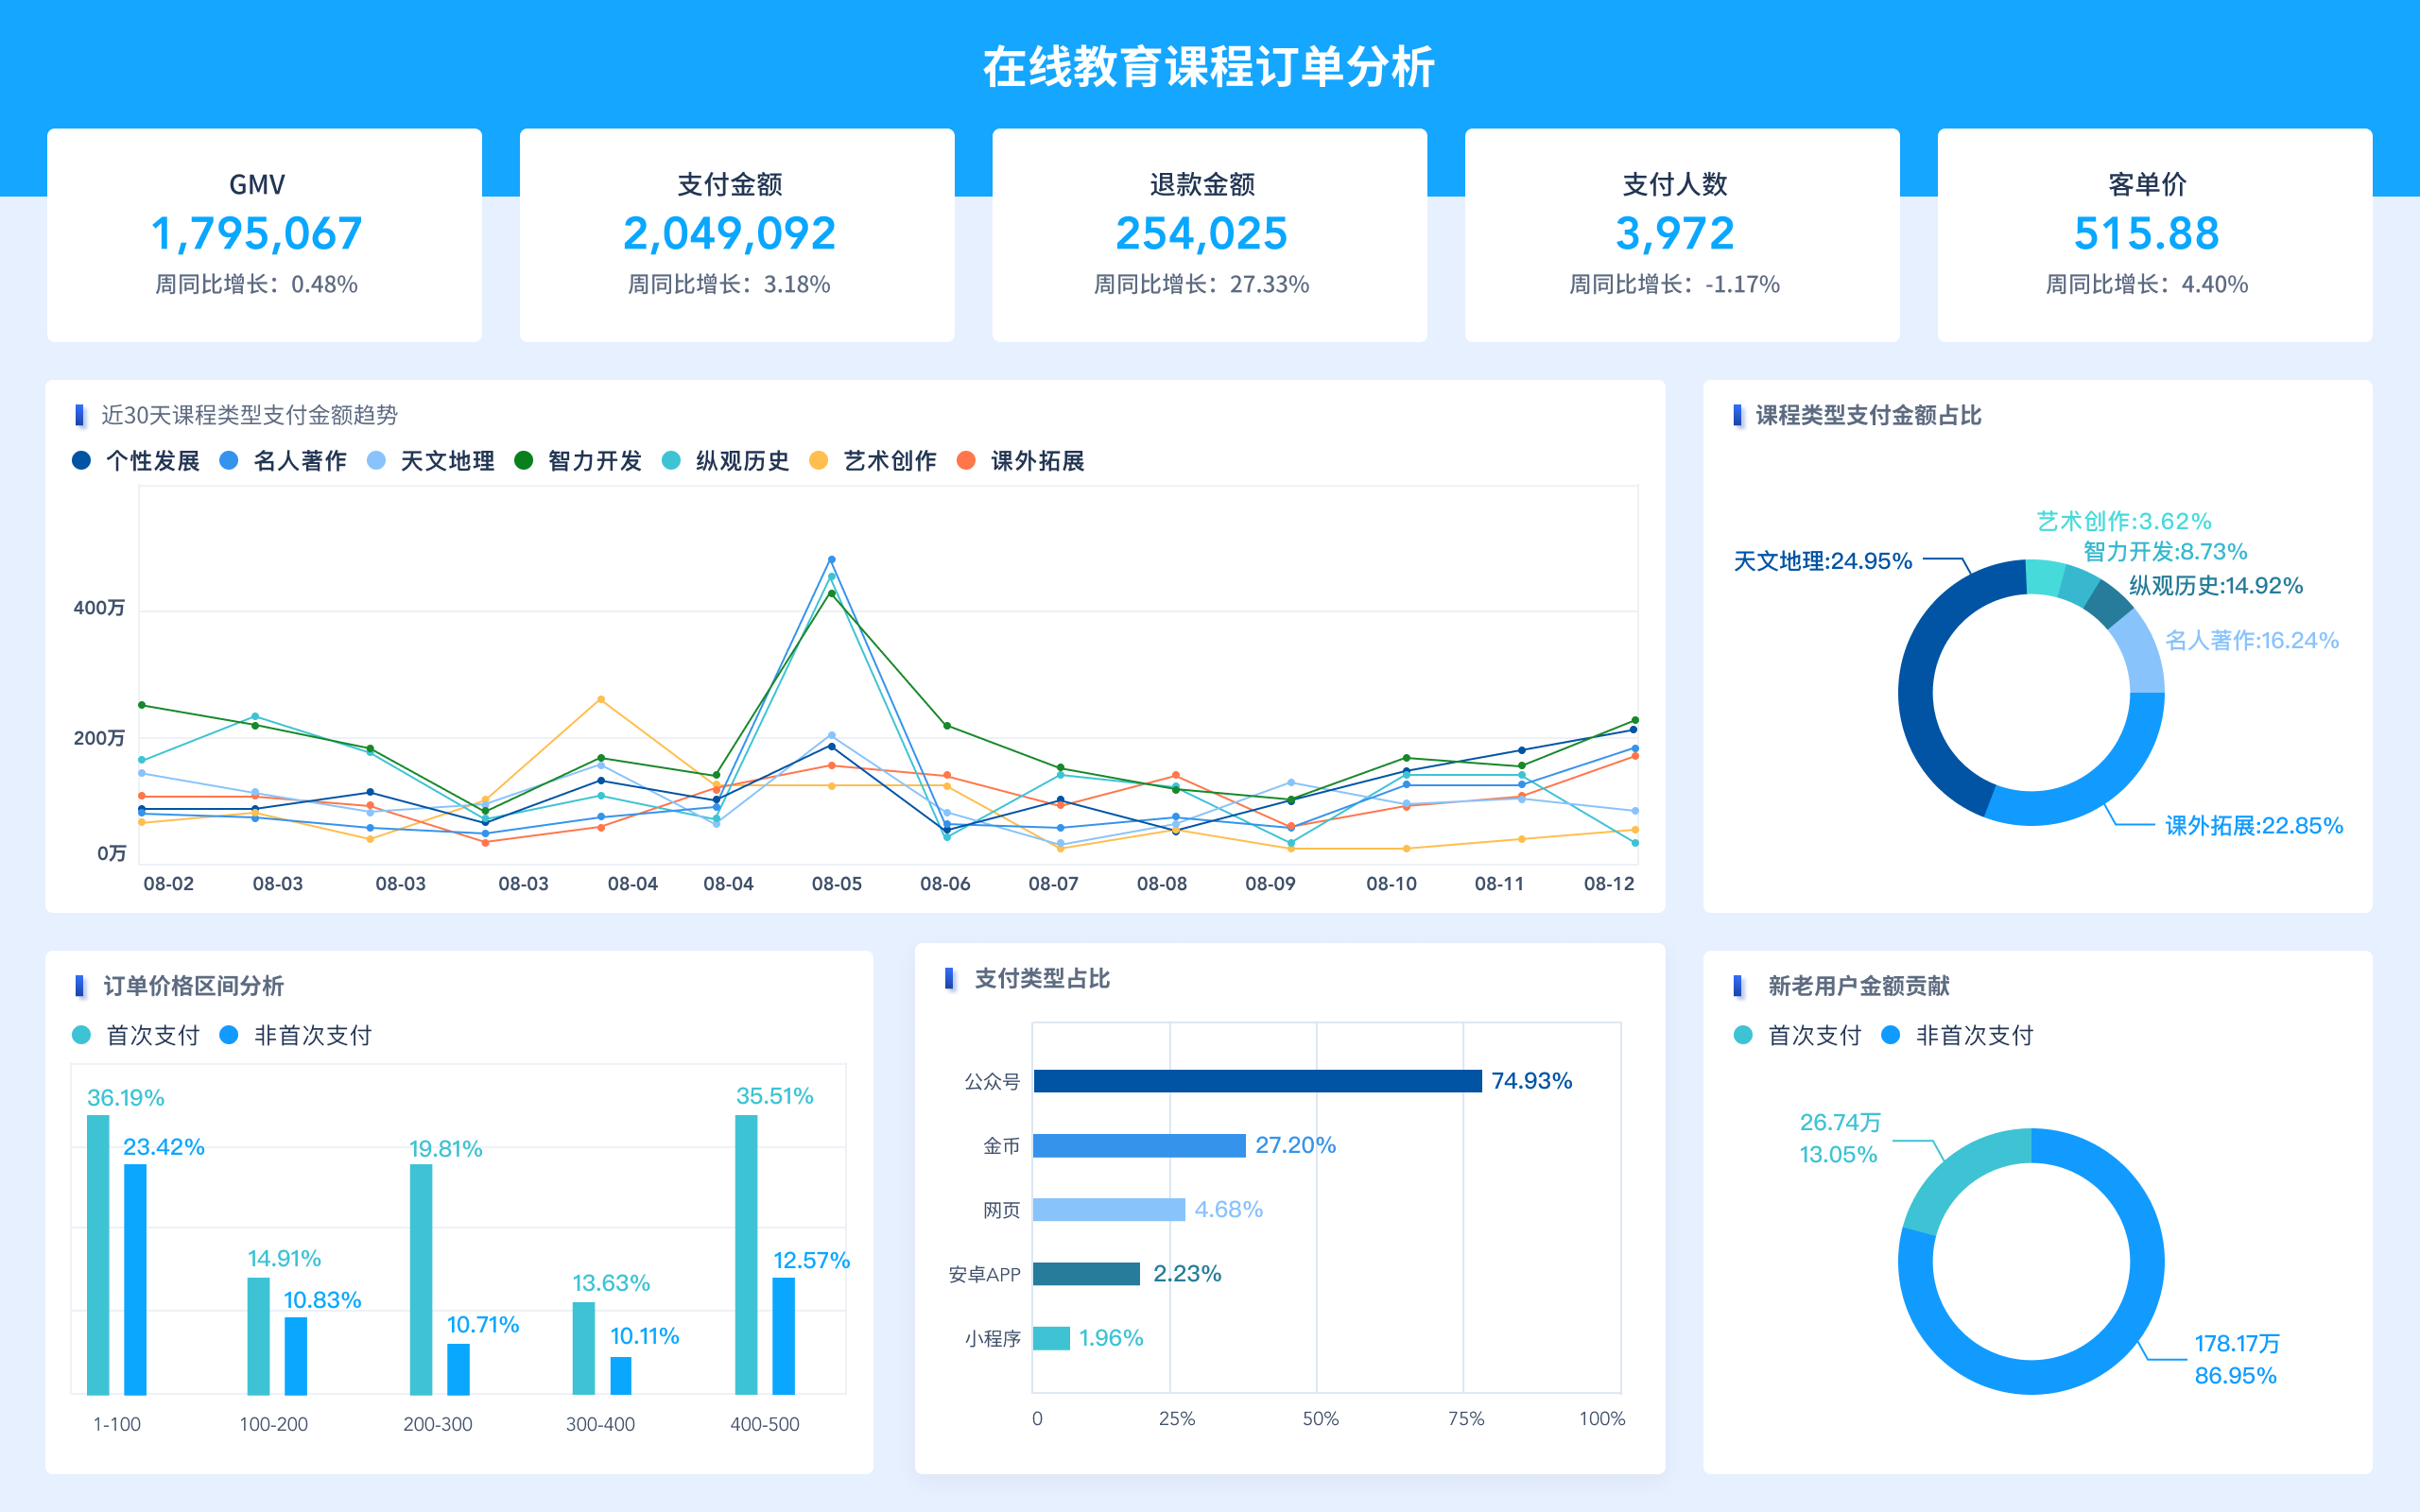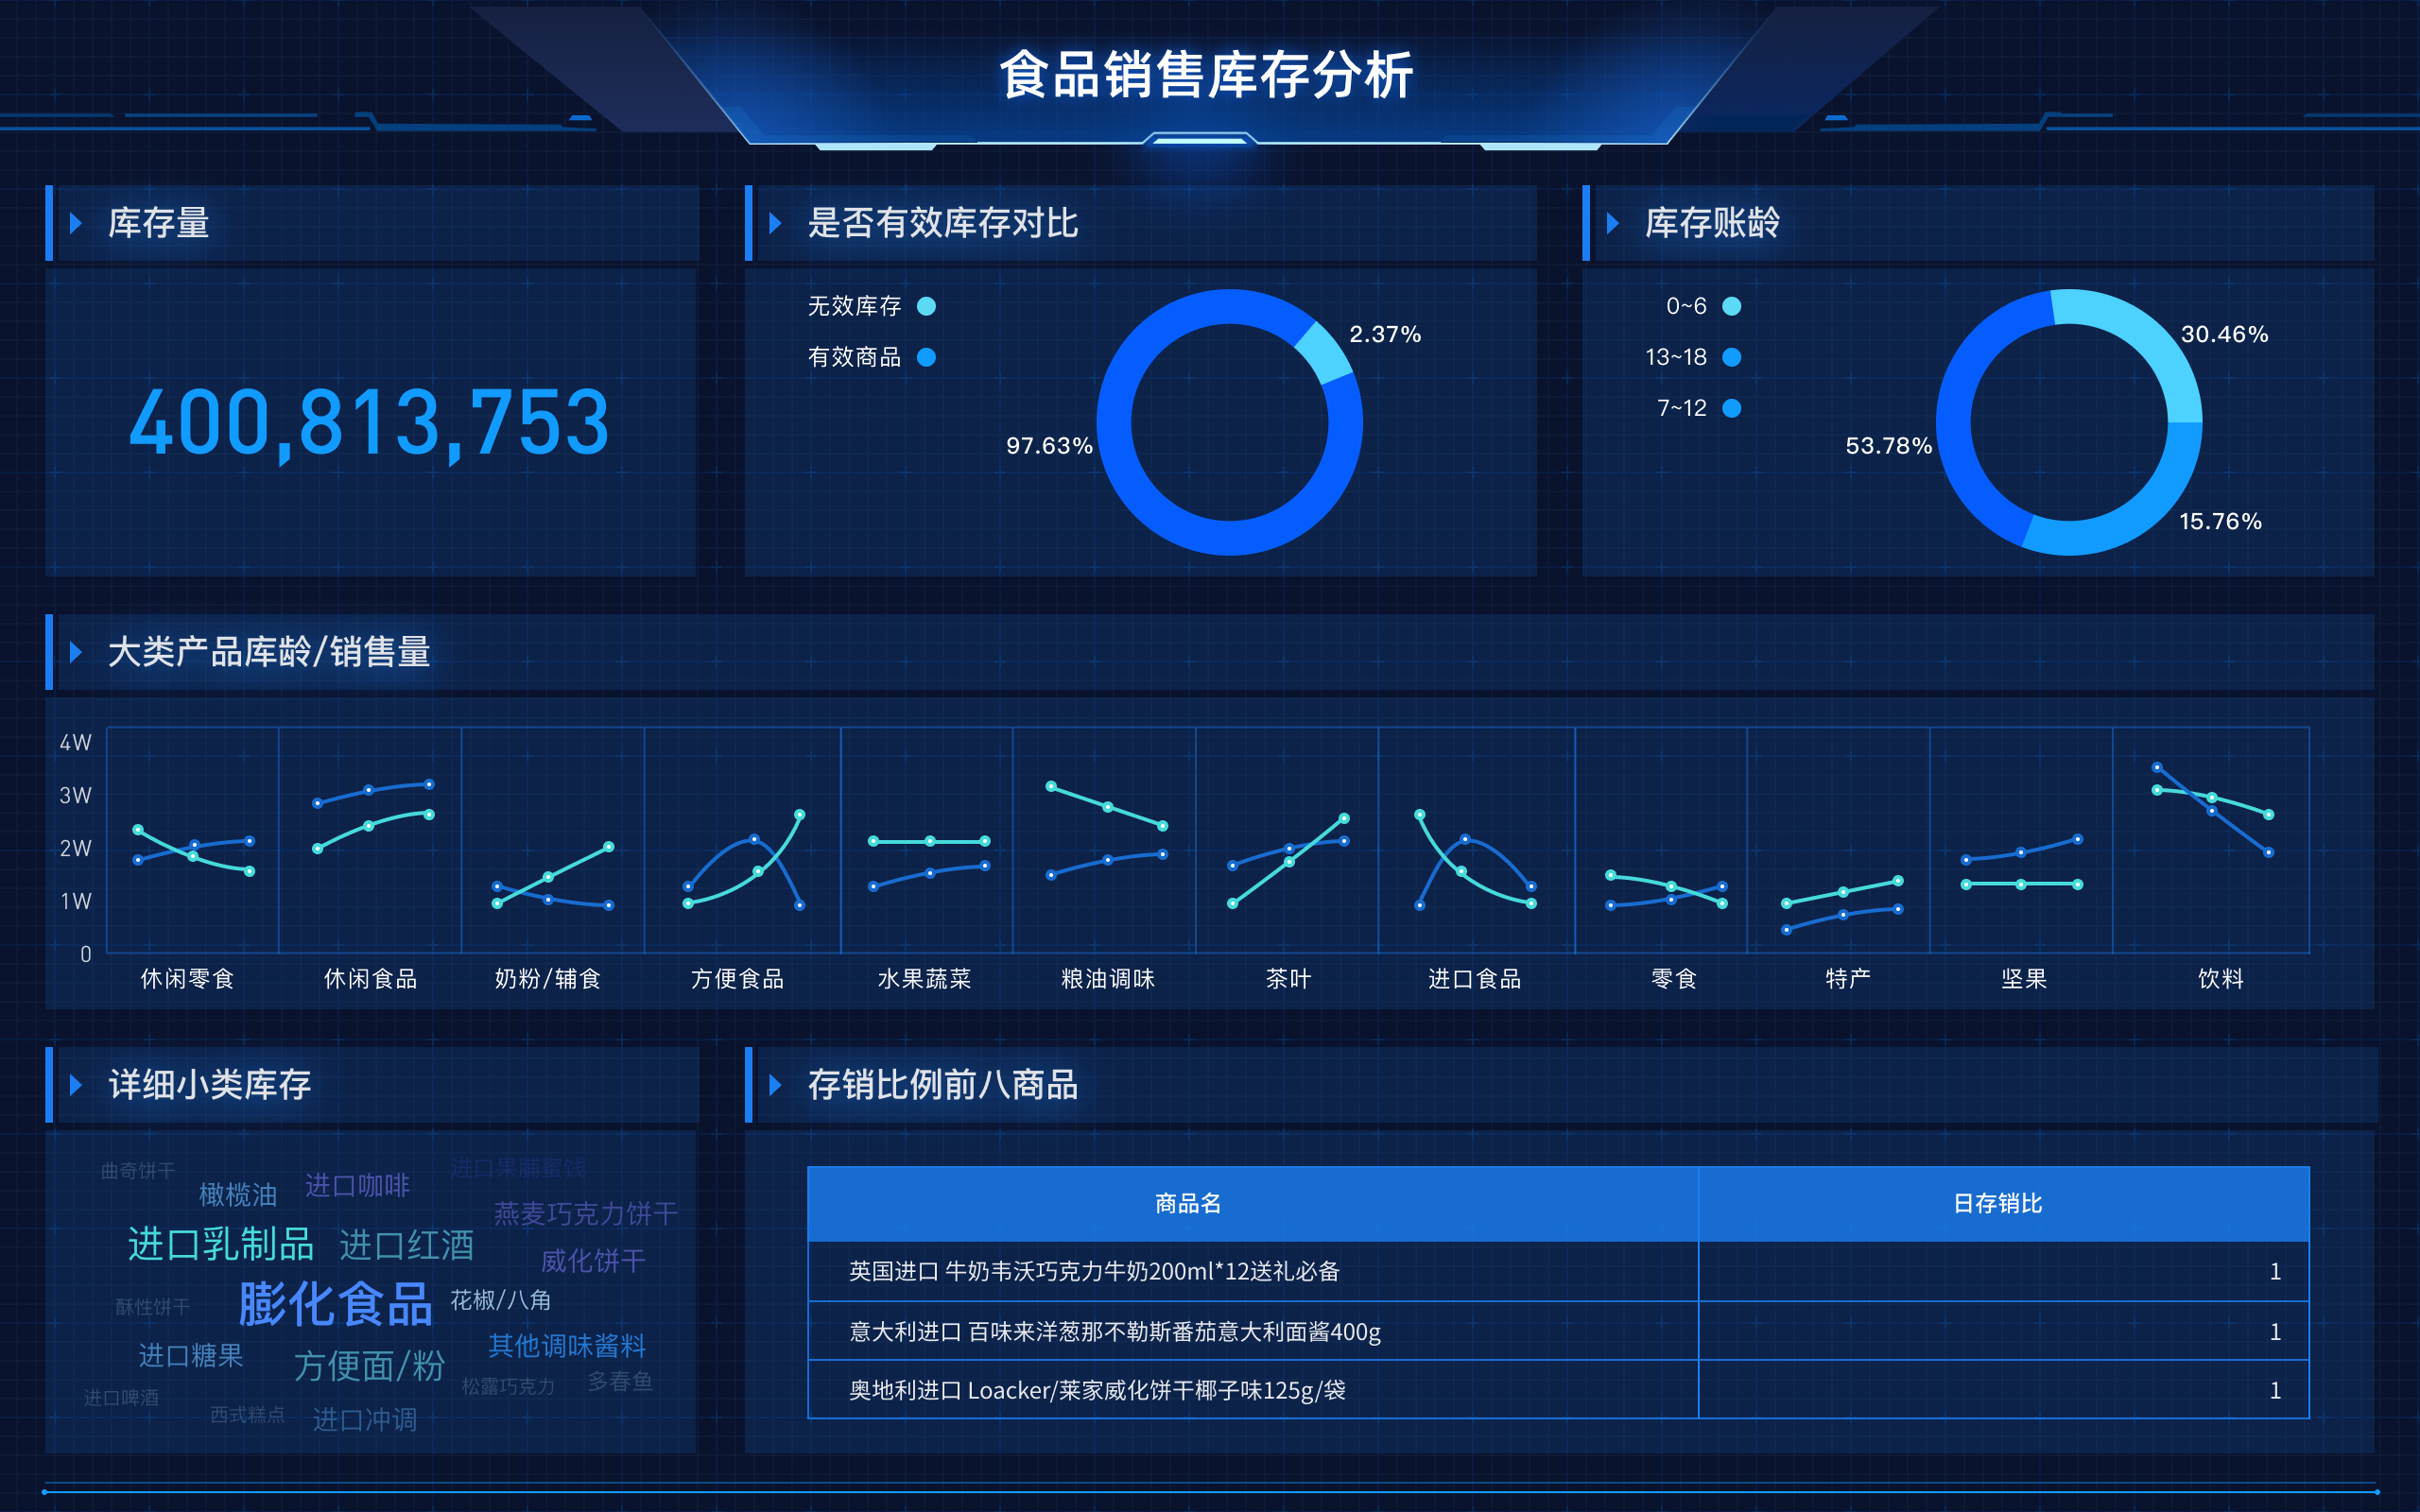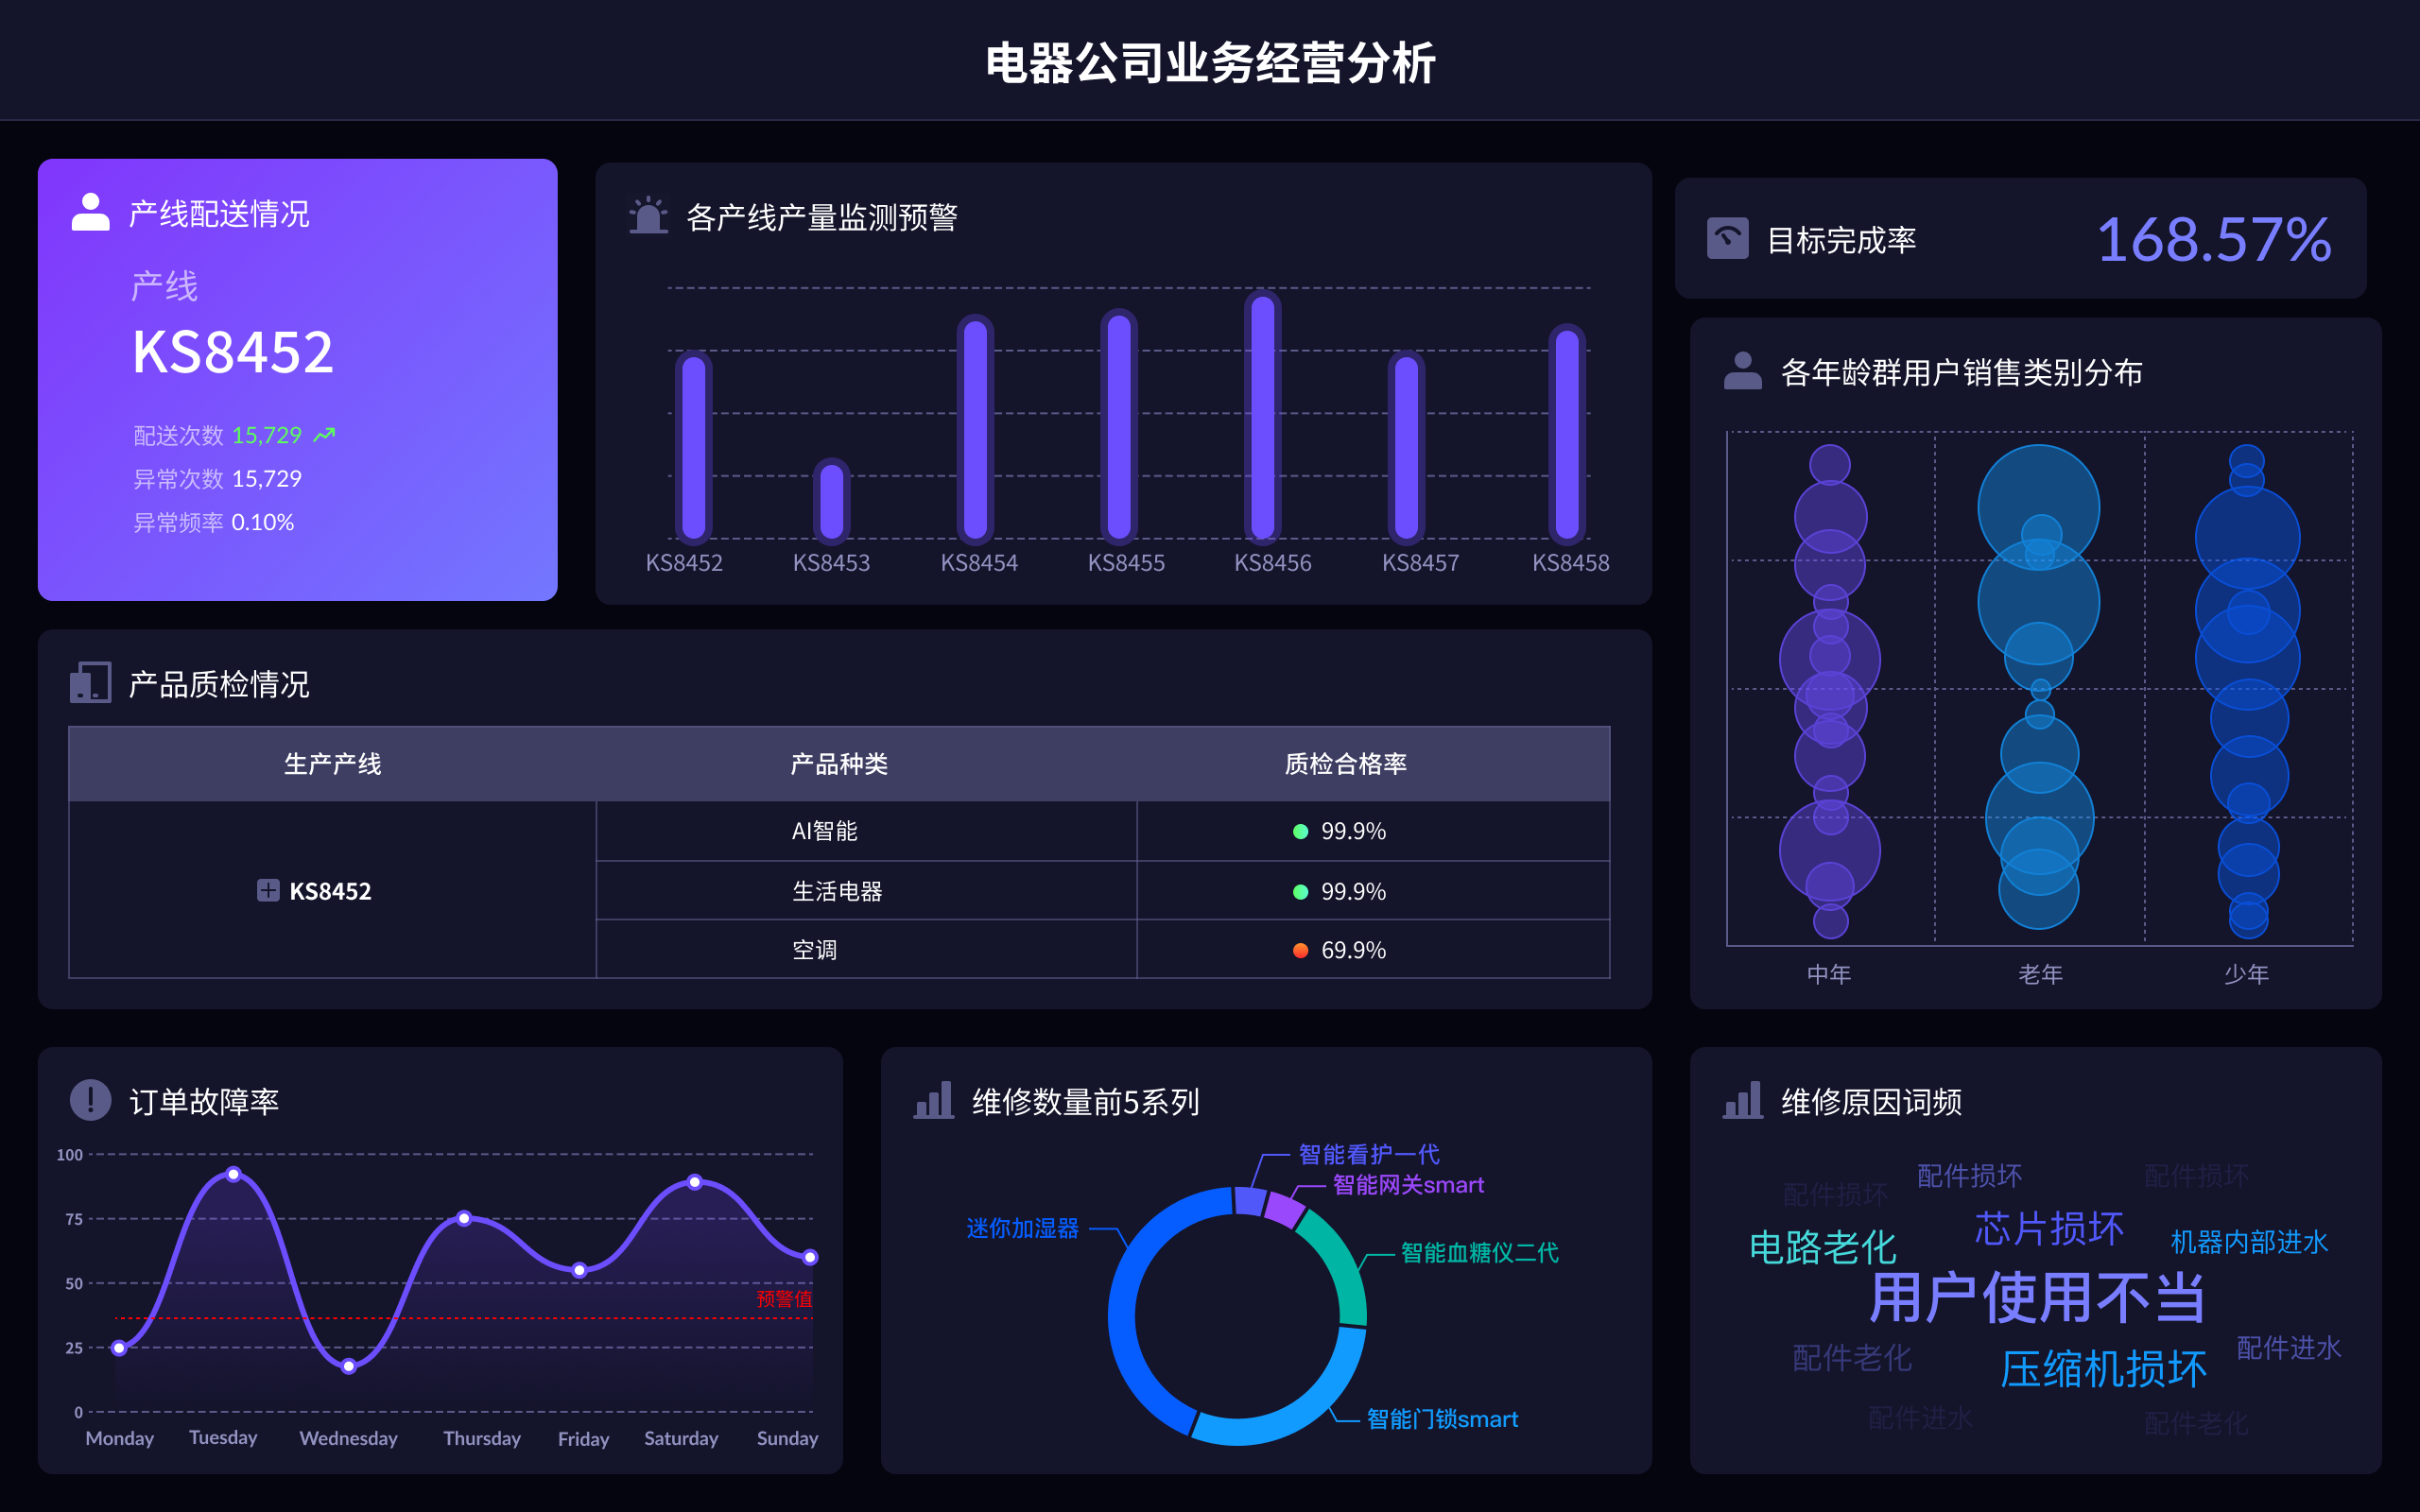
数据可视化常用代码包括:Python的Matplotlib、Seaborn,R语言的ggplot2,JavaScript的D3.js、Chart.js,SQL的窗口函数。其中,Python的Matplotlib和Seaborn因其强大的功能和丰富的图表类型,成为了数据科学家和分析师的首选。例如,Matplotlib几乎可以绘制任何类型的图表,且与其他Python库兼容性极高,使其成为数据可视化的基础工具。而Seaborn则在Matplotlib的基础上,提供了更高级的接口和更美观的默认设置,特别适用于统计数据的可视化。无论是基本的折线图、柱状图,还是复杂的热图、关联图,Matplotlib和Seaborn都能轻松实现。
一、MATPLOTLIB
Matplotlib是Python中最常用的绘图库之一,广泛用于绘制各种图表。它的功能非常强大,可以绘制折线图、柱状图、散点图、饼图、箱线图等。以下是一些常用的Matplotlib代码示例:
import matplotlib.pyplot as plt
折线图
x = [1, 2, 3, 4, 5]
y = [10, 20, 25, 30, 35]
plt.plot(x, y)
plt.title('Line Chart')
plt.xlabel('X-axis')
plt.ylabel('Y-axis')
plt.show()
柱状图
x = ['A', 'B', 'C', 'D']
y = [23, 45, 56, 78]
plt.bar(x, y)
plt.title('Bar Chart')
plt.xlabel('Categories')
plt.ylabel('Values')
plt.show()
散点图
x = [1, 2, 3, 4, 5]
y = [5, 7, 8, 7, 2]
plt.scatter(x, y)
plt.title('Scatter Plot')
plt.xlabel('X-axis')
plt.ylabel('Y-axis')
plt.show()
二、SEABORN
Seaborn是建立在Matplotlib之上的高级可视化库,它提供了更美观的默认设置和更高级的接口,特别适用于统计数据的可视化。以下是一些常用的Seaborn代码示例:
import seaborn as sns
import matplotlib.pyplot as plt
数据集
tips = sns.load_dataset("tips")
箱线图
sns.boxplot(x="day", y="total_bill", data=tips)
plt.title('Box Plot')
plt.show()
热力图
corr = tips.corr()
sns.heatmap(corr, annot=True, cmap='coolwarm')
plt.title('Heatmap')
plt.show()
分类散点图
sns.catplot(x="day", y="total_bill", hue="smoker", kind="swarm", data=tips)
plt.title('Categorical Scatter Plot')
plt.show()
三、GGPLOT2
ggplot2是R语言中最流行的绘图库之一,它基于“Grammar of Graphics”理论,提供了一种非常直观和灵活的图表绘制方法。以下是一些常用的ggplot2代码示例:
library(ggplot2)
数据集
data(mpg)
折线图
ggplot(data=mpg, aes(x=displ, y=hwy)) +
  geom_line() +
  ggtitle('Line Chart') +
  xlab('Displacement') +
  ylab('Highway MPG')
柱状图
ggplot(data=mpg, aes(x=class)) +
  geom_bar() +
  ggtitle('Bar Chart') +
  xlab('Class') +
  ylab('Count')
散点图
ggplot(data=mpg, aes(x=displ, y=hwy)) +
  geom_point() +
  ggtitle('Scatter Plot') +
  xlab('Displacement') +
  ylab('Highway MPG')
四、D3.JS
D3.js是一个基于JavaScript的数据可视化库,它允许开发者使用HTML、SVG和CSS来创建动态和交互式的数据可视化图表。以下是一些常用的D3.js代码示例:
// 折线图
var svg = d3.select("svg"),
    margin = {top: 20, right: 20, bottom: 30, left: 50},
    width = +svg.attr("width") - margin.left - margin.right,
    height = +svg.attr("height") - margin.top - margin.bottom,
    g = svg.append("g").attr("transform", "translate(" + margin.left + "," + margin.top + ")");
var parseTime = d3.timeParse("%d-%b-%y");
var x = d3.scaleTime().rangeRound([0, width]),
    y = d3.scaleLinear().rangeRound([height, 0]);
var line = d3.line()
    .x(function(d) { return x(d.date); })
    .y(function(d) { return y(d.close); });
d3.tsv("data.tsv", function(d) {
  d.date = parseTime(d.date);
  d.close = +d.close;
  return d;
}, function(error, data) {
  if (error) throw error;
  x.domain(d3.extent(data, function(d) { return d.date; }));
  y.domain(d3.extent(data, function(d) { return d.close; }));
  g.append("g")
      .attr("class", "axis axis--x")
      .attr("transform", "translate(0," + height + ")")
      .call(d3.axisBottom(x));
  g.append("g")
      .attr("class", "axis axis--y")
      .call(d3.axisLeft(y))
    .append("text")
      .attr("fill", "#000")
      .attr("transform", "rotate(-90)")
      .attr("y", 6)
      .attr("dy", "0.71em")
      .attr("text-anchor", "end")
      .text("Price ($)");
  g.append("path")
      .datum(data)
      .attr("class", "line")
      .attr("d", line);
});
五、CHART.JS
Chart.js是一个简单而灵活的JavaScript图表库,它使用HTML5的Canvas元素来绘制图表。以下是一些常用的Chart.js代码示例:
<!DOCTYPE html>
<html>
<head>
  <title>Chart.js Examples</title>
  <script src="https://cdn.jsdelivr.net/npm/chart.js"></script>
</head>
<body>
<canvas id="lineChart" width="400" height="200"></canvas>
<canvas id="barChart" width="400" height="200"></canvas>
<canvas id="pieChart" width="400" height="200"></canvas>
<script>
  var ctx1 = document.getElementById('lineChart').getContext('2d');
  var lineChart = new Chart(ctx1, {
    type: 'line',
    data: {
      labels: ['January', 'February', 'March', 'April', 'May', 'June', 'July'],
      datasets: [{
        label: 'My First dataset',
        data: [65, 59, 80, 81, 56, 55, 40],
        borderColor: 'rgba(75, 192, 192, 1)',
        borderWidth: 1
      }]
    }
  });
  var ctx2 = document.getElementById('barChart').getContext('2d');
  var barChart = new Chart(ctx2, {
    type: 'bar',
    data: {
      labels: ['Red', 'Blue', 'Yellow', 'Green', 'Purple', 'Orange'],
      datasets: [{
        label: '# of Votes',
        data: [12, 19, 3, 5, 2, 3],
        backgroundColor: [
          'rgba(255, 99, 132, 0.2)',
          'rgba(54, 162, 235, 0.2)',
          'rgba(255, 206, 86, 0.2)',
          'rgba(75, 192, 192, 0.2)',
          'rgba(153, 102, 255, 0.2)',
          'rgba(255, 159, 64, 0.2)'
        ],
        borderColor: [
          'rgba(255, 99, 132, 1)',
          'rgba(54, 162, 235, 1)',
          'rgba(255, 206, 86, 1)',
          'rgba(75, 192, 192, 1)',
          'rgba(153, 102, 255, 1)',
          'rgba(255, 159, 64, 1)'
        ],
        borderWidth: 1
      }]
    }
  });
  var ctx3 = document.getElementById('pieChart').getContext('2d');
  var pieChart = new Chart(ctx3, {
    type: 'pie',
    data: {
      labels: ['Red', 'Blue', 'Yellow', 'Green', 'Purple', 'Orange'],
      datasets: [{
        label: '# of Votes',
        data: [12, 19, 3, 5, 2, 3],
        backgroundColor: [
          'rgba(255, 99, 132, 0.2)',
          'rgba(54, 162, 235, 0.2)',
          'rgba(255, 206, 86, 0.2)',
          'rgba(75, 192, 192, 0.2)',
          'rgba(153, 102, 255, 0.2)',
          'rgba(255, 159, 64, 0.2)'
        ],
        borderColor: [
          'rgba(255, 99, 132, 1)',
          'rgba(54, 162, 235, 1)',
          'rgba(255, 206, 86, 1)',
          'rgba(75, 192, 192, 1)',
          'rgba(153, 102, 255, 1)',
          'rgba(255, 159, 64, 1)'
        ],
        borderWidth: 1
      }]
    }
  });
</script>
</body>
</html>
六、SQL窗口函数
SQL窗口函数在数据分析和可视化中也非常有用,它们可以用来计算累计和滑动统计量,分组内排名等。以下是一些常用的SQL窗口函数代码示例:
-- 累计总和
SELECT
  employee,
  salary,
  SUM(salary) OVER (ORDER BY employee) AS cumulative_salary
FROM
  employees;
-- 分组内排名
SELECT
  employee,
  department,
  salary,
  RANK() OVER (PARTITION BY department ORDER BY salary DESC) AS rank
FROM
  employees;
-- 滑动平均
SELECT
  employee,
  salary,
  AVG(salary) OVER (ORDER BY employee ROWS BETWEEN 2 PRECEDING AND CURRENT ROW) AS moving_avg
FROM
  employees;
七、FINEBI、FINEREPORT、FINEVIS
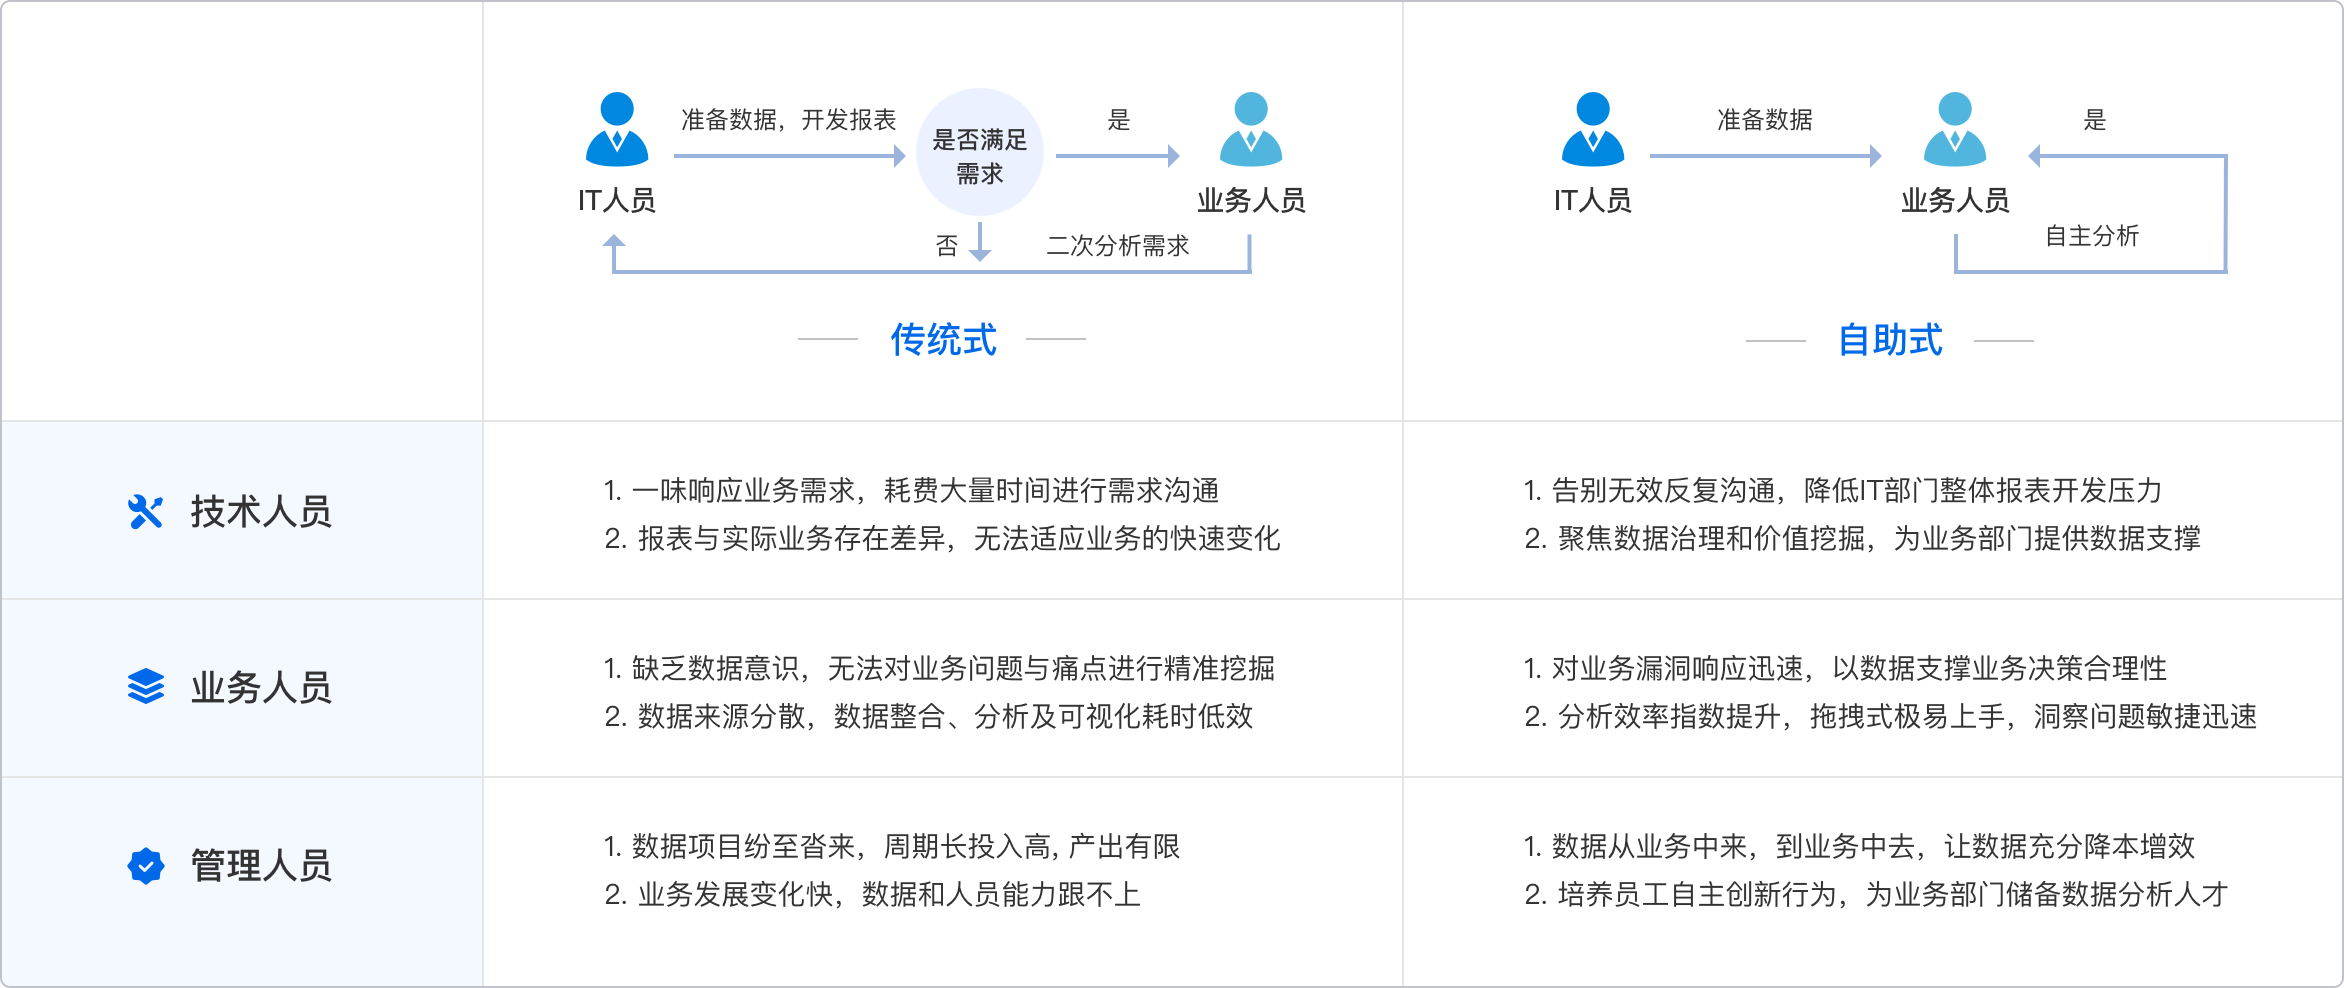
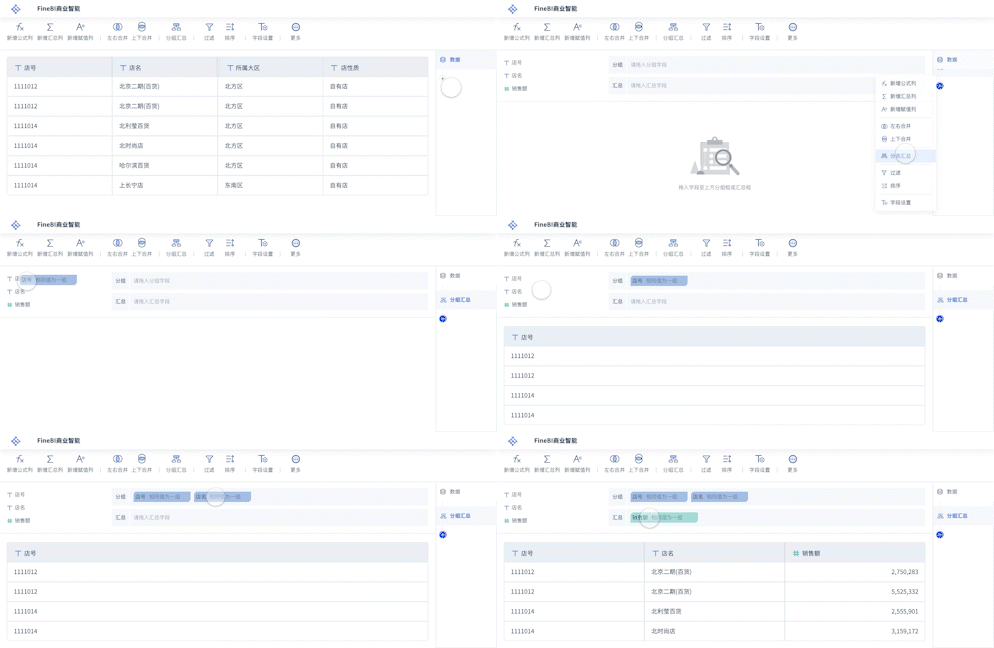
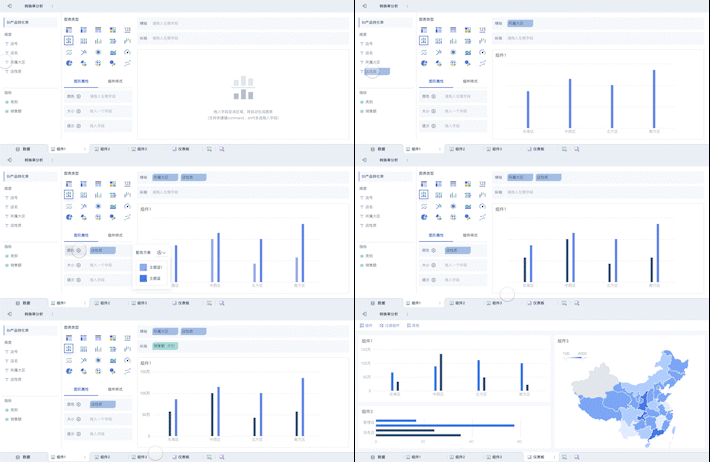
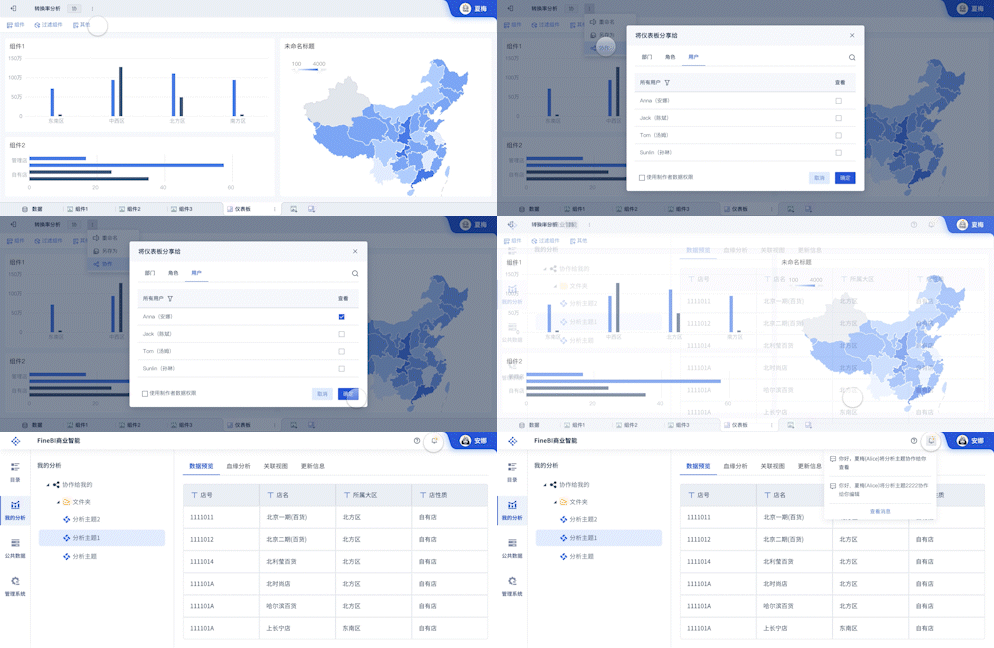
帆软旗下的FineBI、FineReport、FineVis也是非常强大的数据可视化工具。FineBI是一个商业智能分析工具,提供丰富的图表和数据分析功能。FineReport则专注于报表设计和数据展示,支持复杂报表的制作。FineVis是一款专业的数据可视化工具,提供多种图表和数据可视化方案。它们都提供了强大的数据处理和可视化功能,适用于各种业务场景。
FineBI官网: https://s.fanruan.com/f459r
FineReport官网: https://s.fanruan.com/ryhzq
FineVis官网: https://s.fanruan.com/7z296
通过使用这些工具和代码,您可以轻松地将数据转换为各种图表和可视化,帮助更好地理解和分析数据。
相关问答FAQs:
1. 什么是数据可视化?
数据可视化是指利用图表、图形、地图等可视化手段将数据呈现出来,以便更直观地理解数据之间的关系、趋势和模式。数据可视化常用于数据分析、报告呈现、决策支持等领域。
2. 常用的数据可视化代码有哪些?
-
Python中常用的数据可视化库包括Matplotlib、Seaborn和Plotly。以下是这些库的常用代码示例:
-
使用Matplotlib绘制折线图:
import matplotlib.pyplot as plt
x = [1, 2, 3, 4, 5]
y = [10, 20, 25, 30, 35]
plt.plot(x, y)
plt.show()
- 使用Seaborn绘制散点图:
import seaborn as sns
import pandas as pd
data = {'x': [1, 2, 3, 4, 5], 'y': [10, 20, 25, 30, 35]}
df = pd.DataFrame(data)
sns.scatterplot(x='x', y='y', data=df)
- 使用Plotly绘制柱状图:
import plotly.express as px
data = {'x': [1, 2, 3, 4, 5], 'y': [10, 20, 25, 30, 35]}
df = pd.DataFrame(data)
fig = px.bar(df, x='x', y='y')
fig.show()
-
在R语言中,常用的数据可视化包括ggplot2和Plotly。以下是这些包的常用代码示例:
-
使用ggplot2绘制箱线图:
library(ggplot2)
data <- data.frame(x = rep(1:3, each = 10), y = rnorm(30))
ggplot(data, aes(factor(x), y)) + geom_boxplot()
- 使用Plotly绘制饼图:
library(plotly)
labels <- c('A', 'B', 'C', 'D')
values <- c(20, 30, 25, 25)
plot_ly(labels = labels, values = values, type = 'pie')
3. 数据可视化代码如何选择?
选择数据可视化代码应根据数据类型、呈现方式和个人偏好来决定。例如,对于时间序列数据,折线图和柱状图可能更合适;对于分类数据,散点图和饼图可能更直观。同时,也可以根据代码的易用性、灵活性和功能丰富程度来选择合适的数据可视化库和代码。
本文内容通过AI工具匹配关键字智能整合而成,仅供参考,帆软不对内容的真实、准确或完整作任何形式的承诺。具体产品功能请以帆软官方帮助文档为准,或联系您的对接销售进行咨询。如有其他问题,您可以通过联系blog@fanruan.com进行反馈,帆软收到您的反馈后将及时答复和处理。


