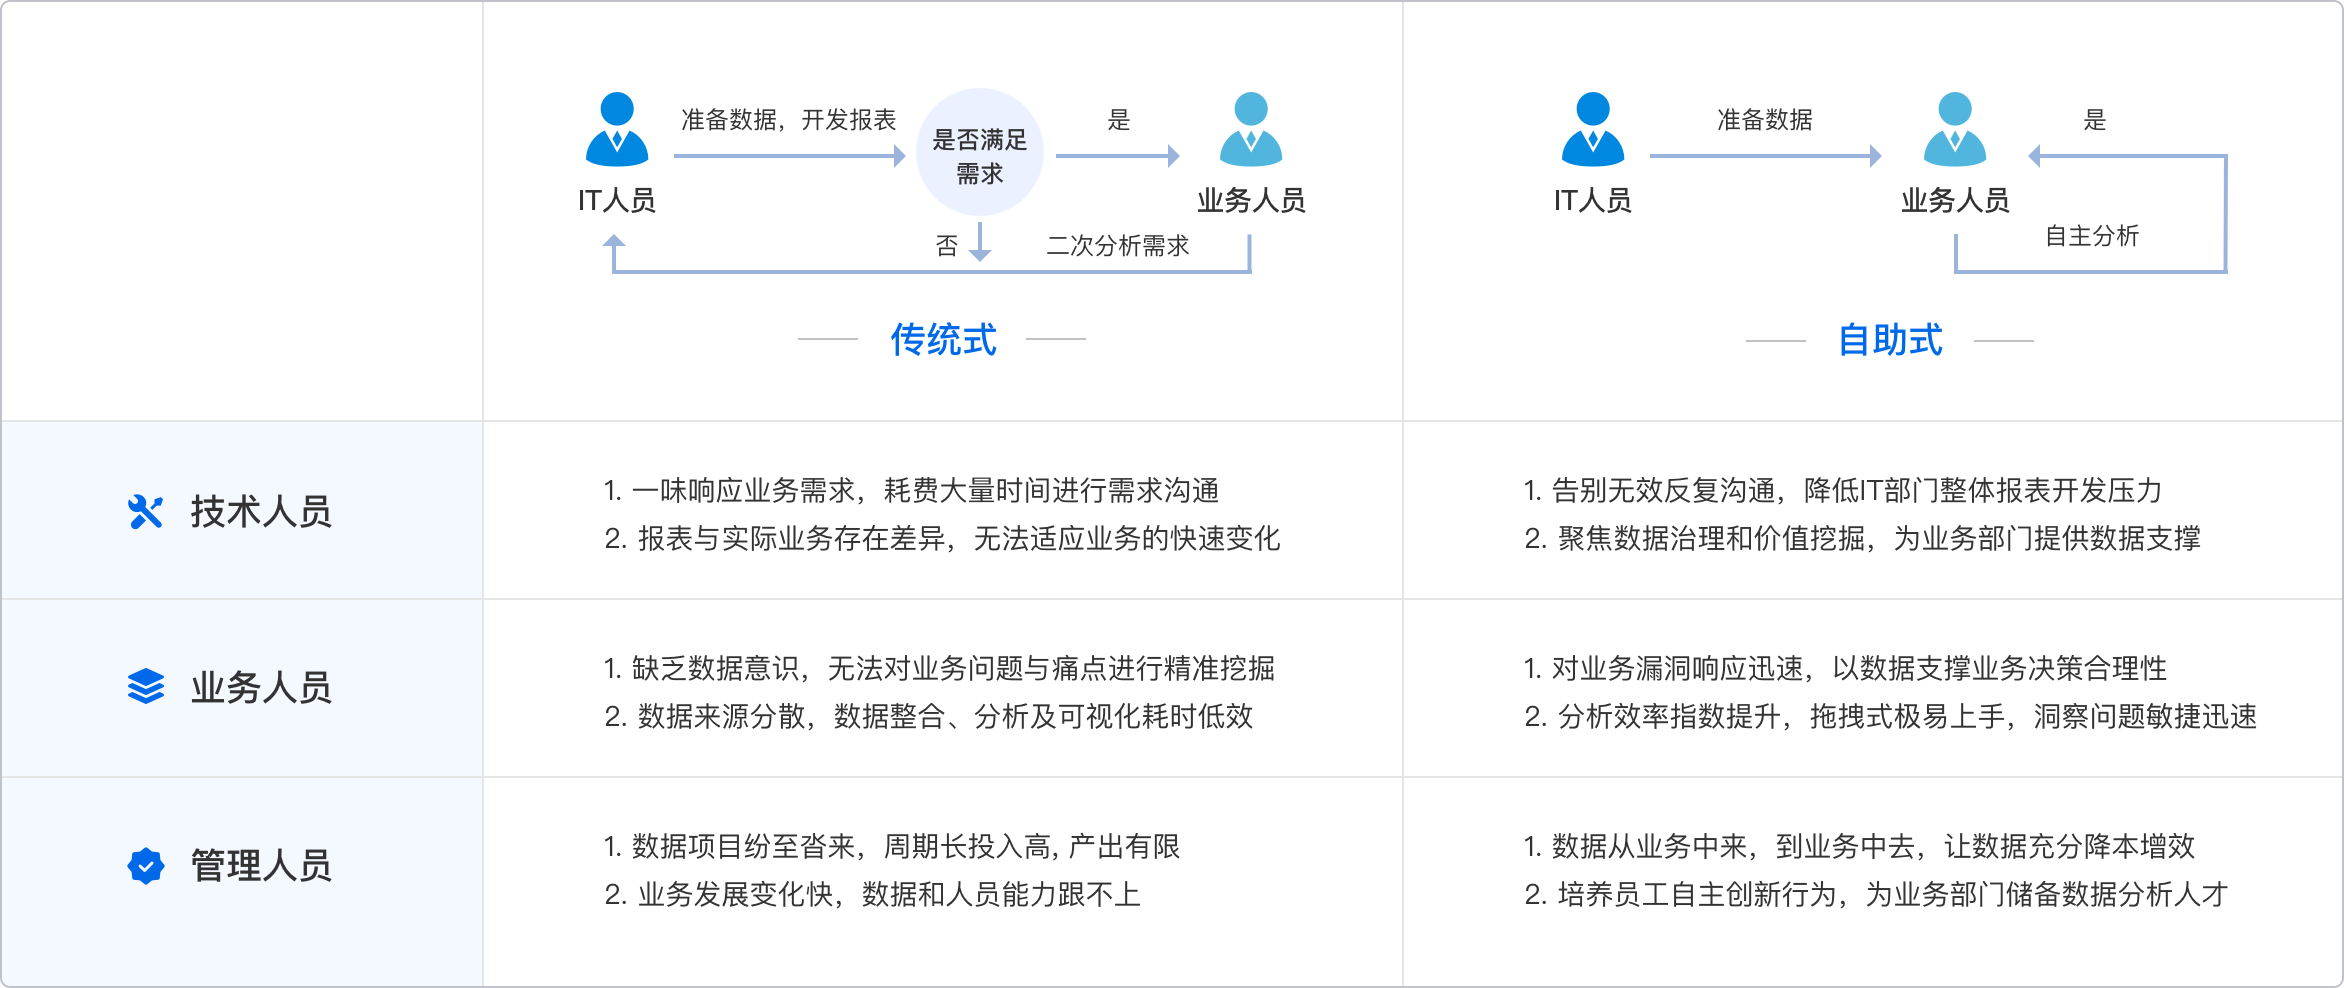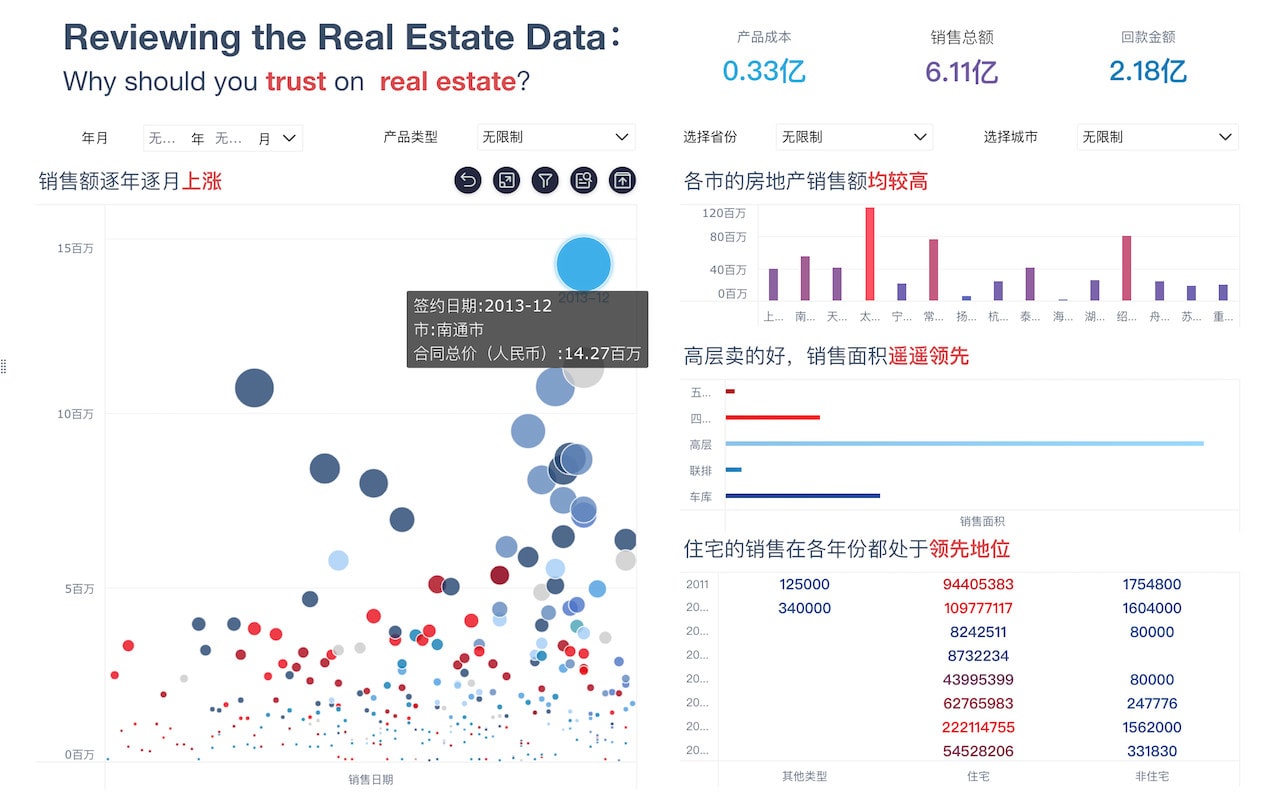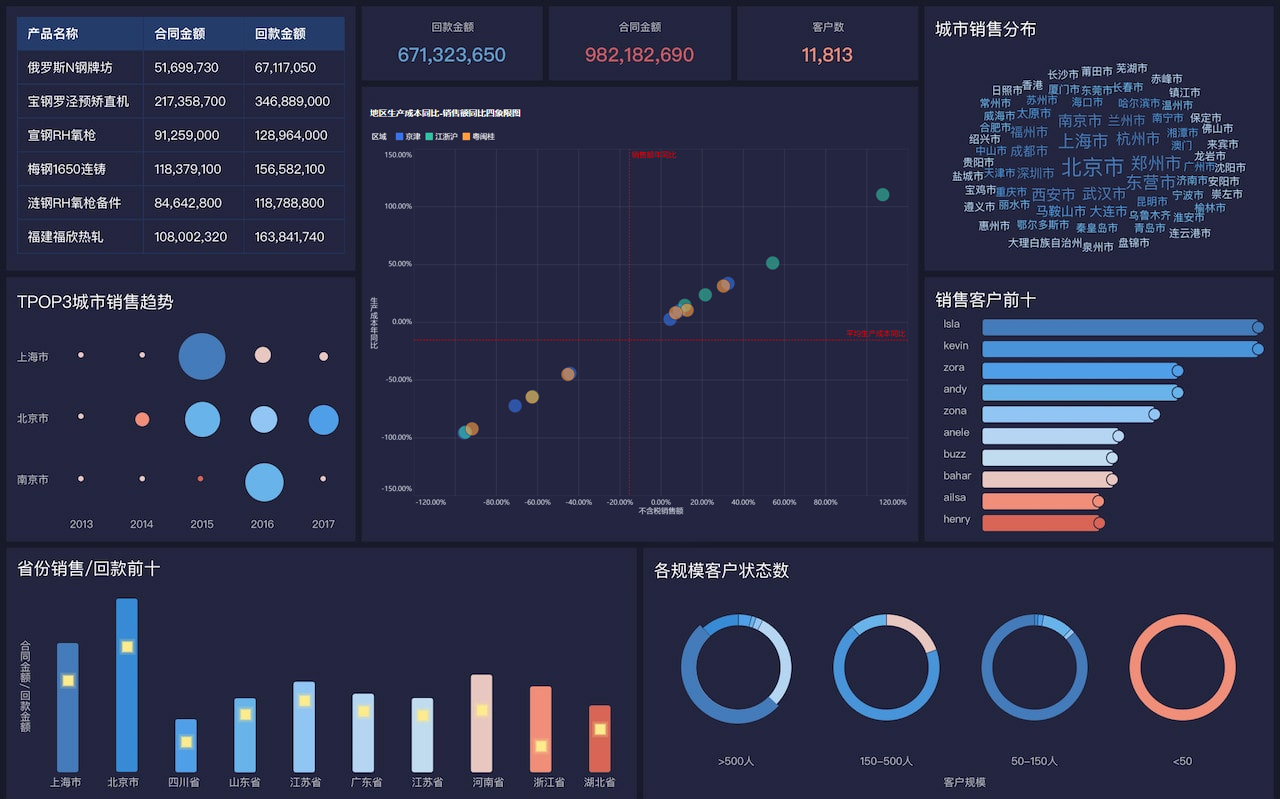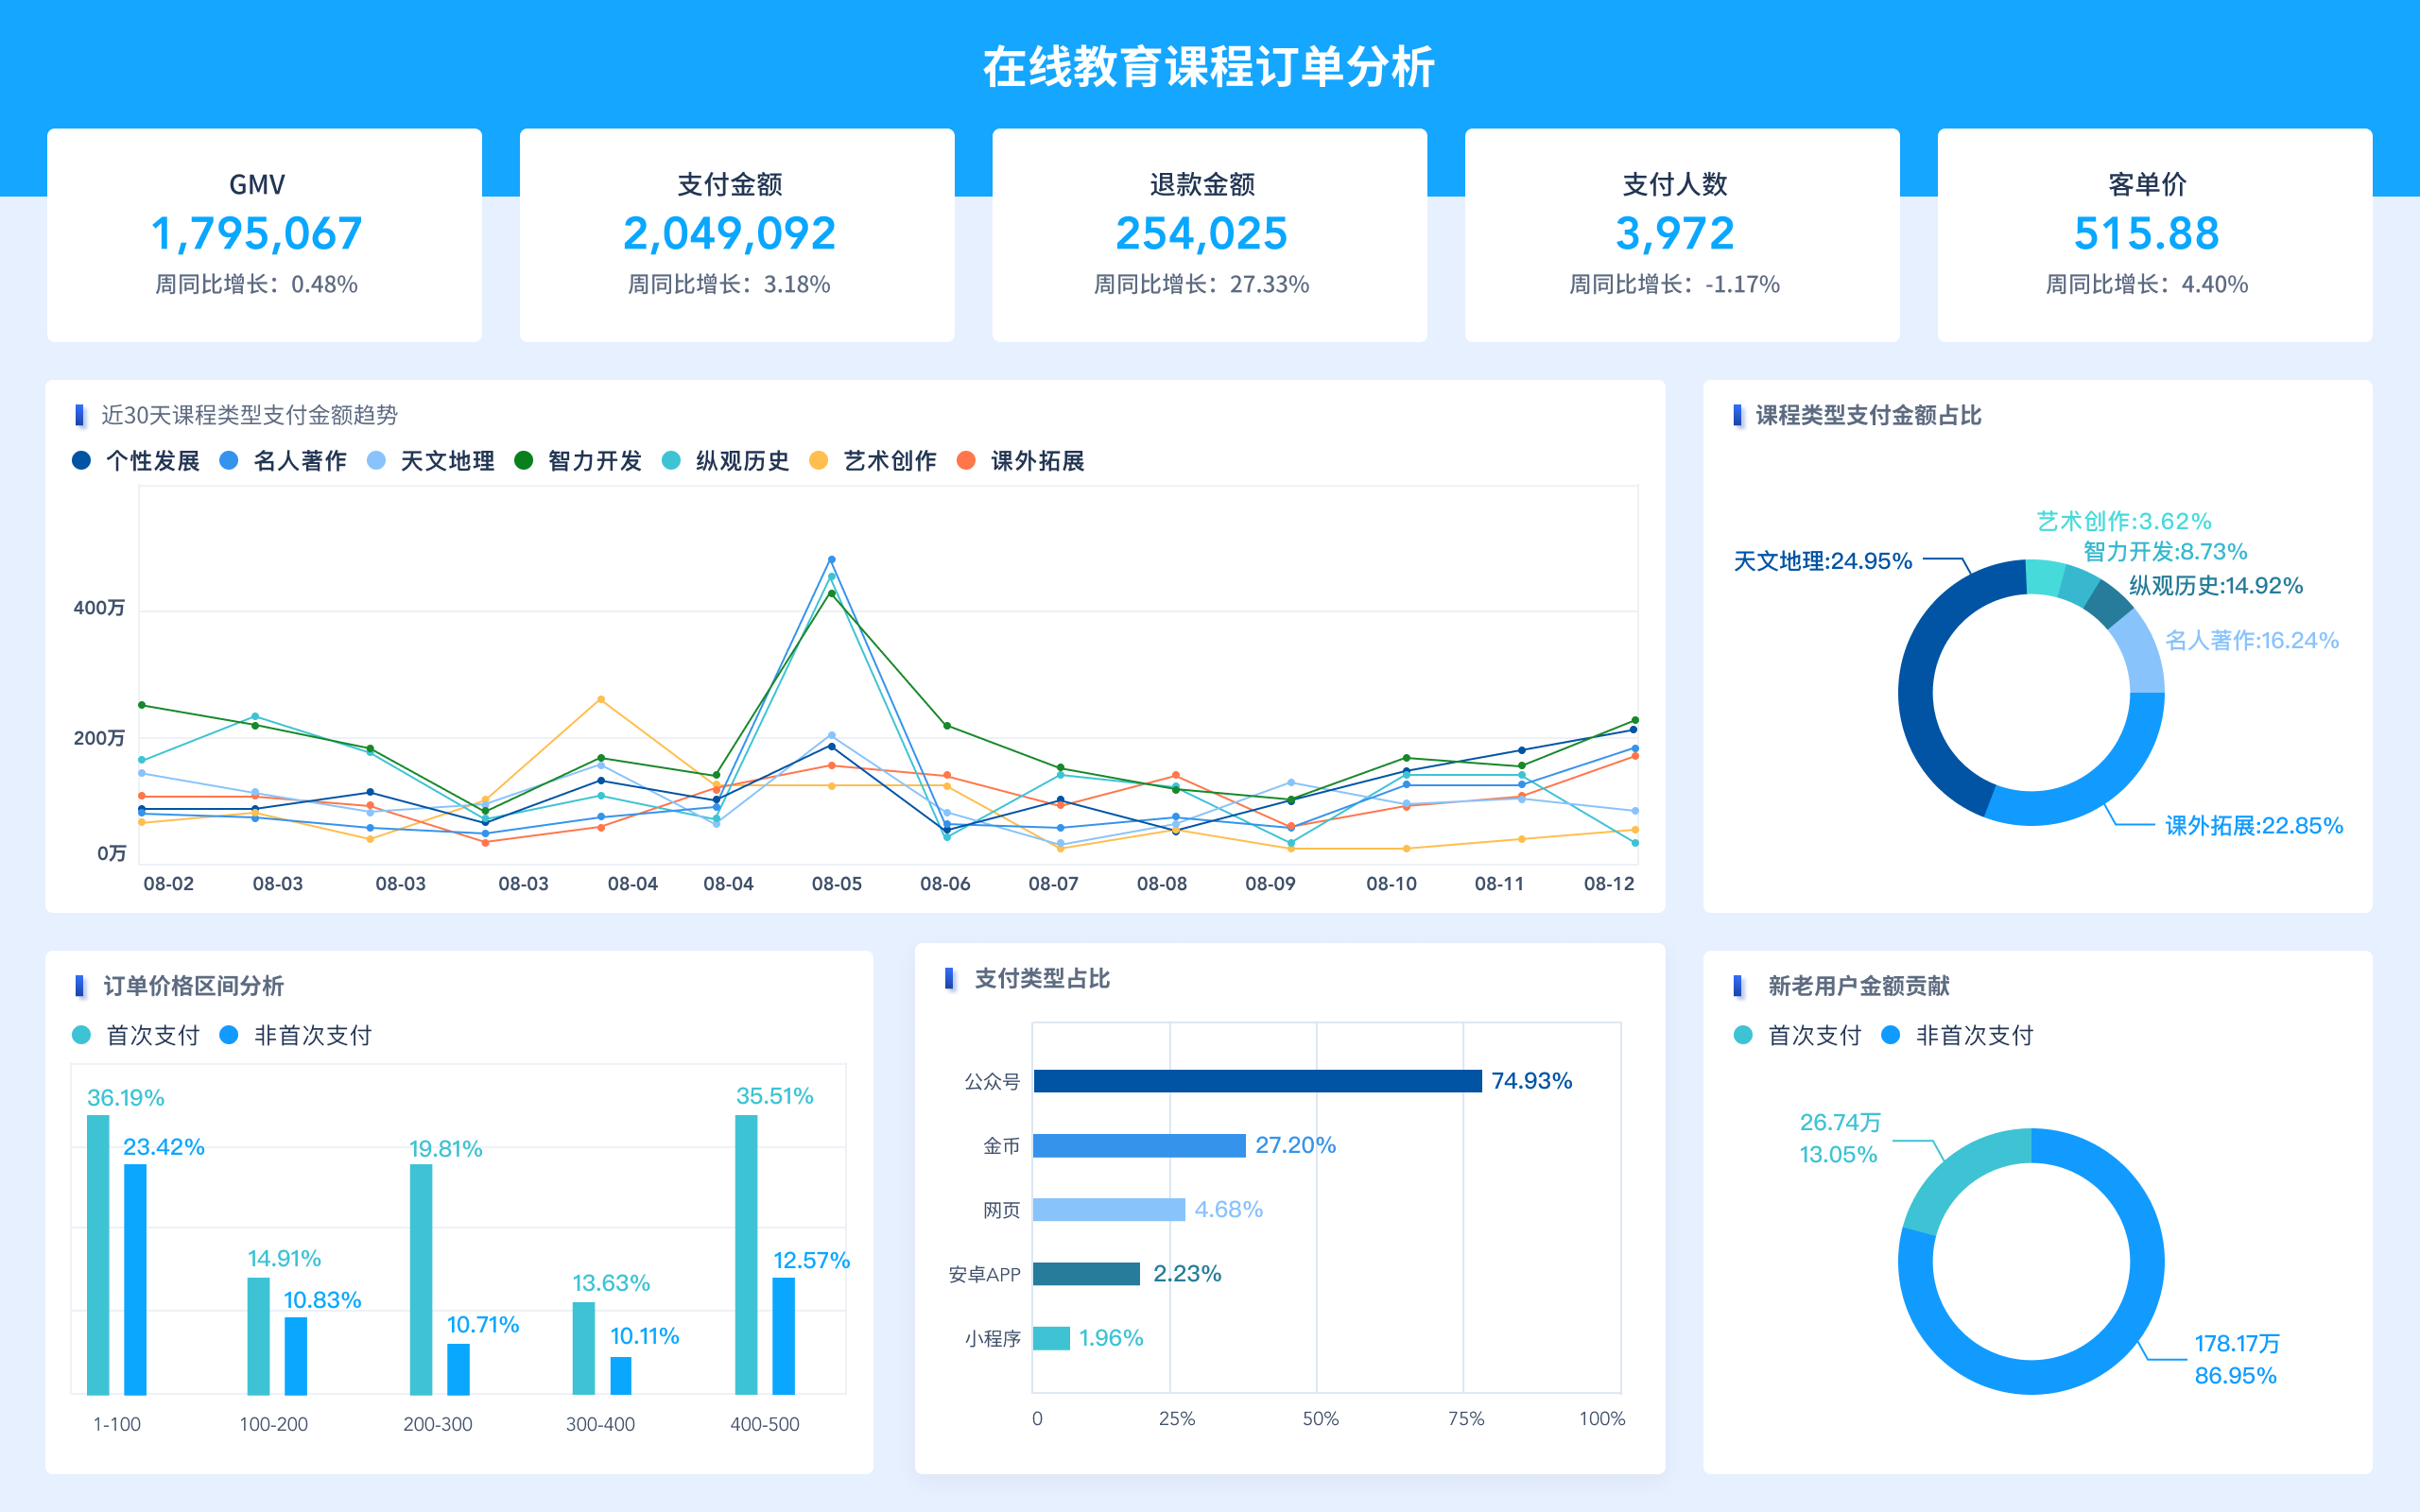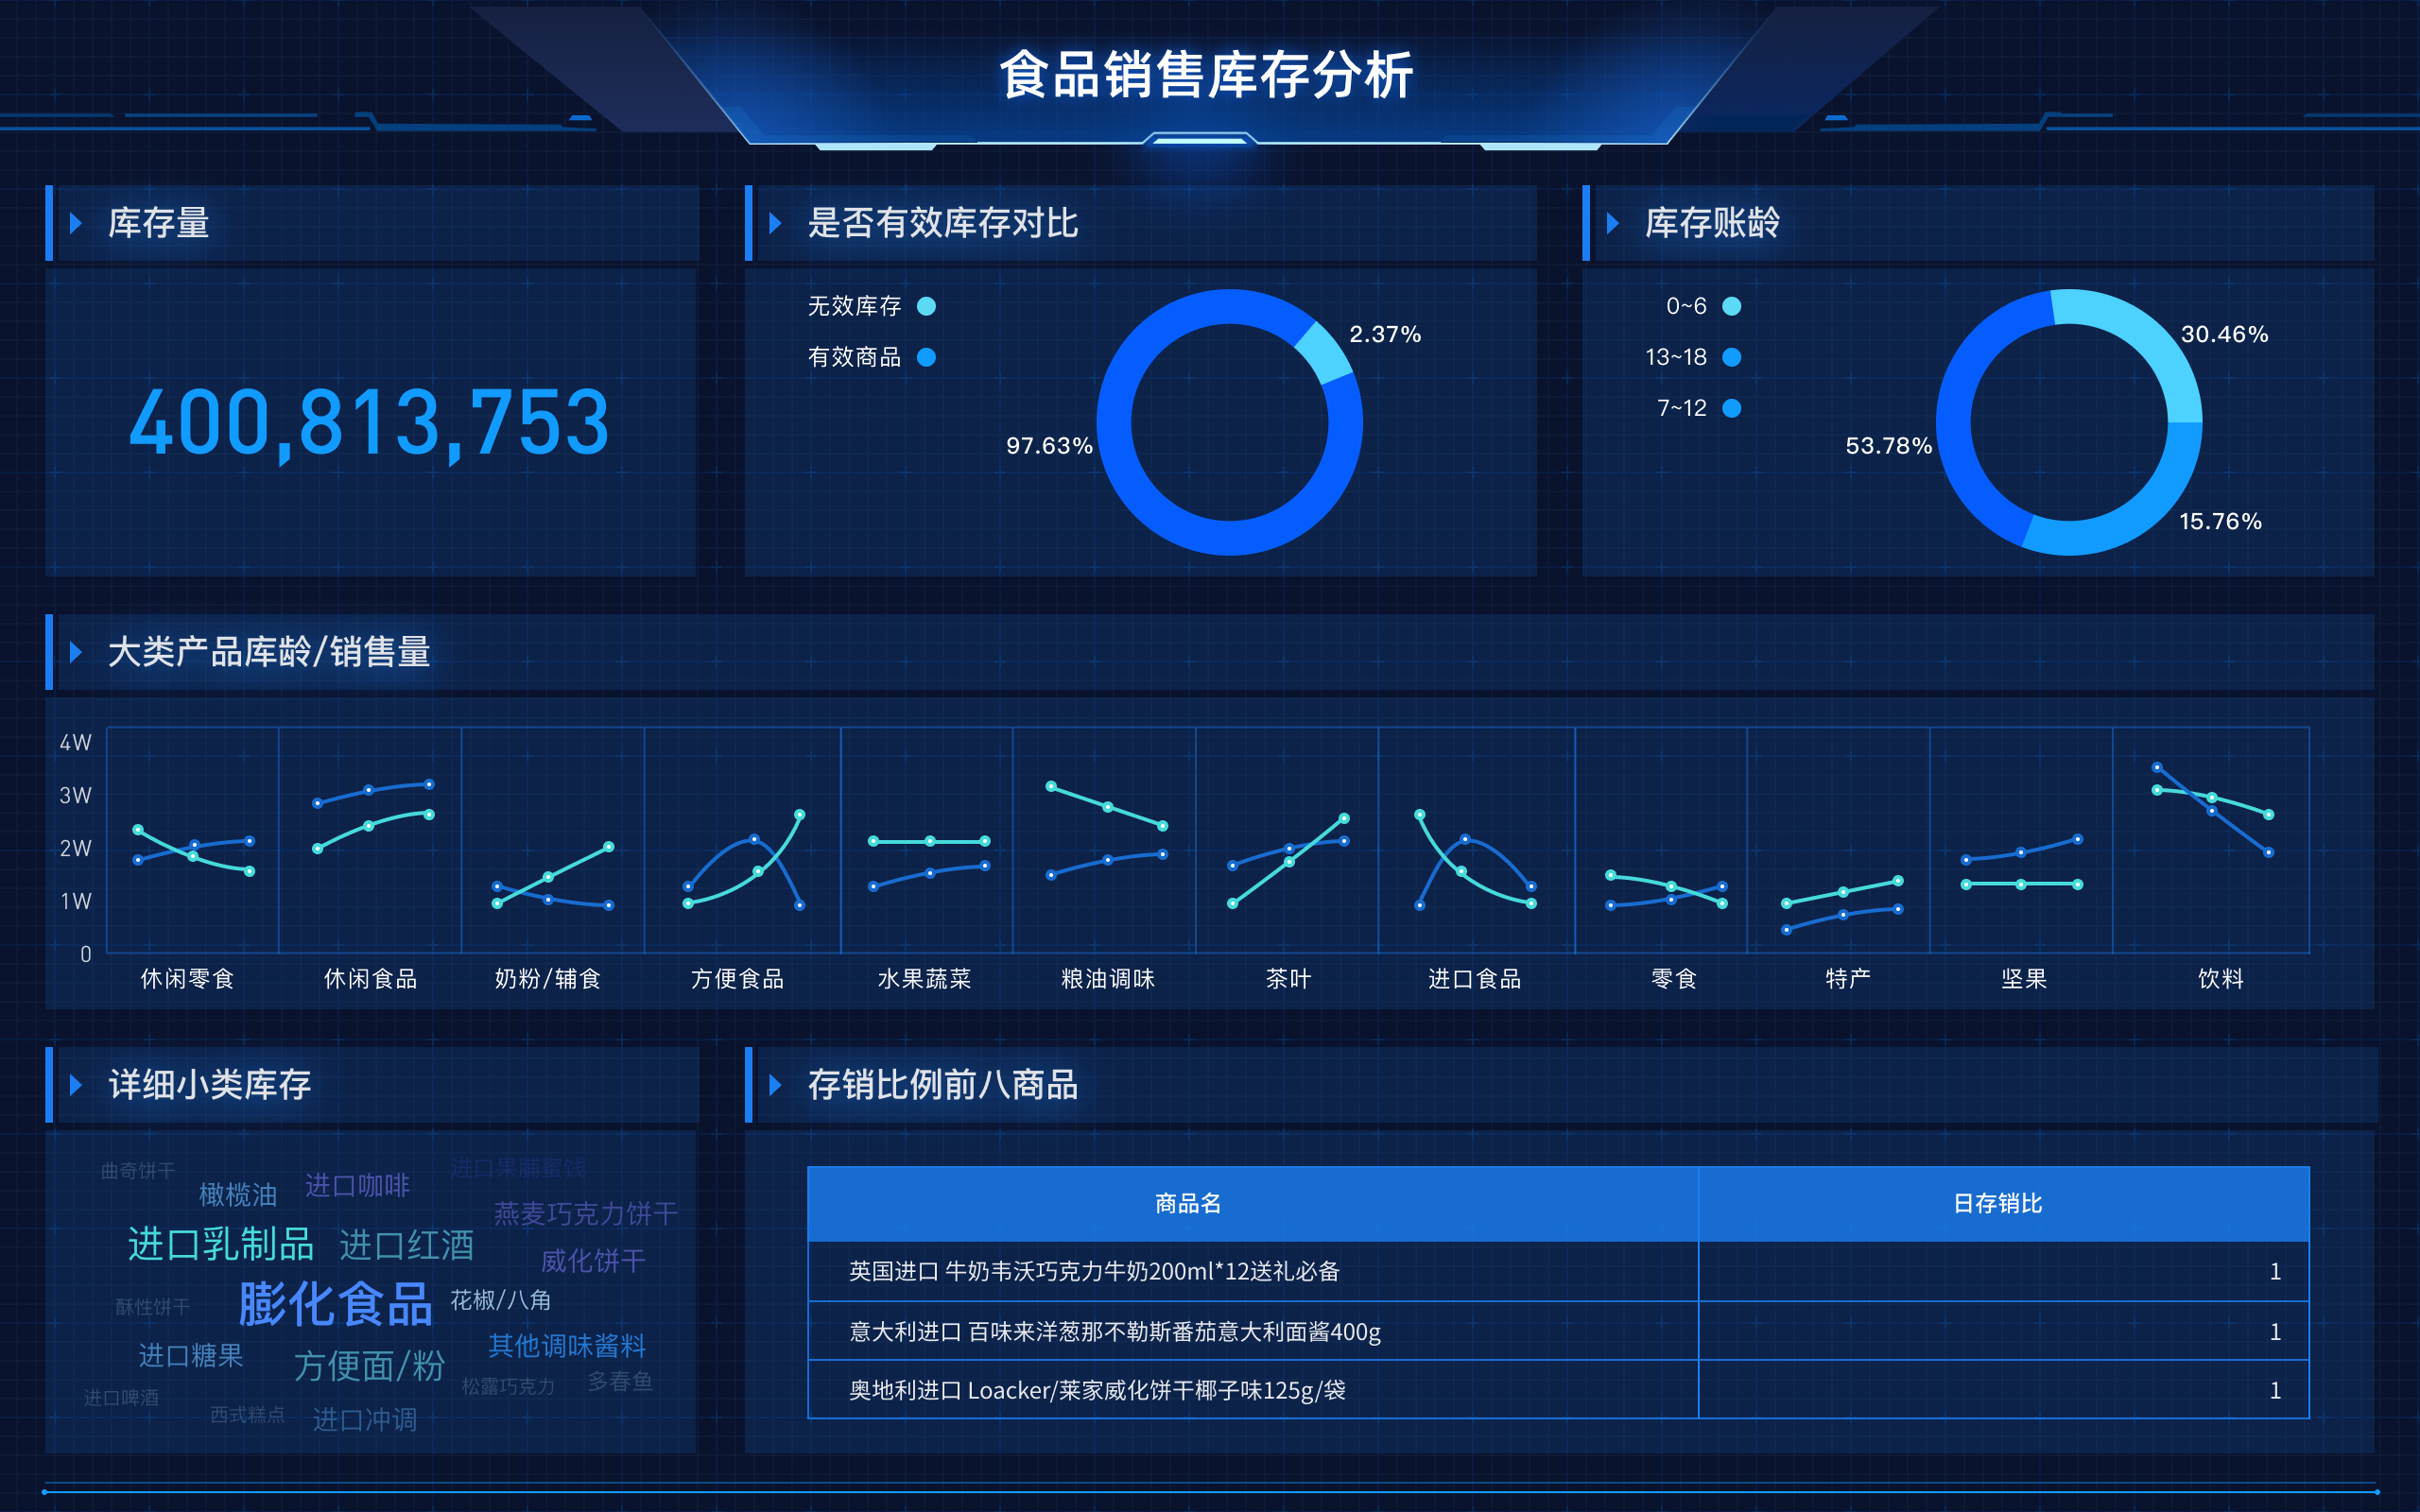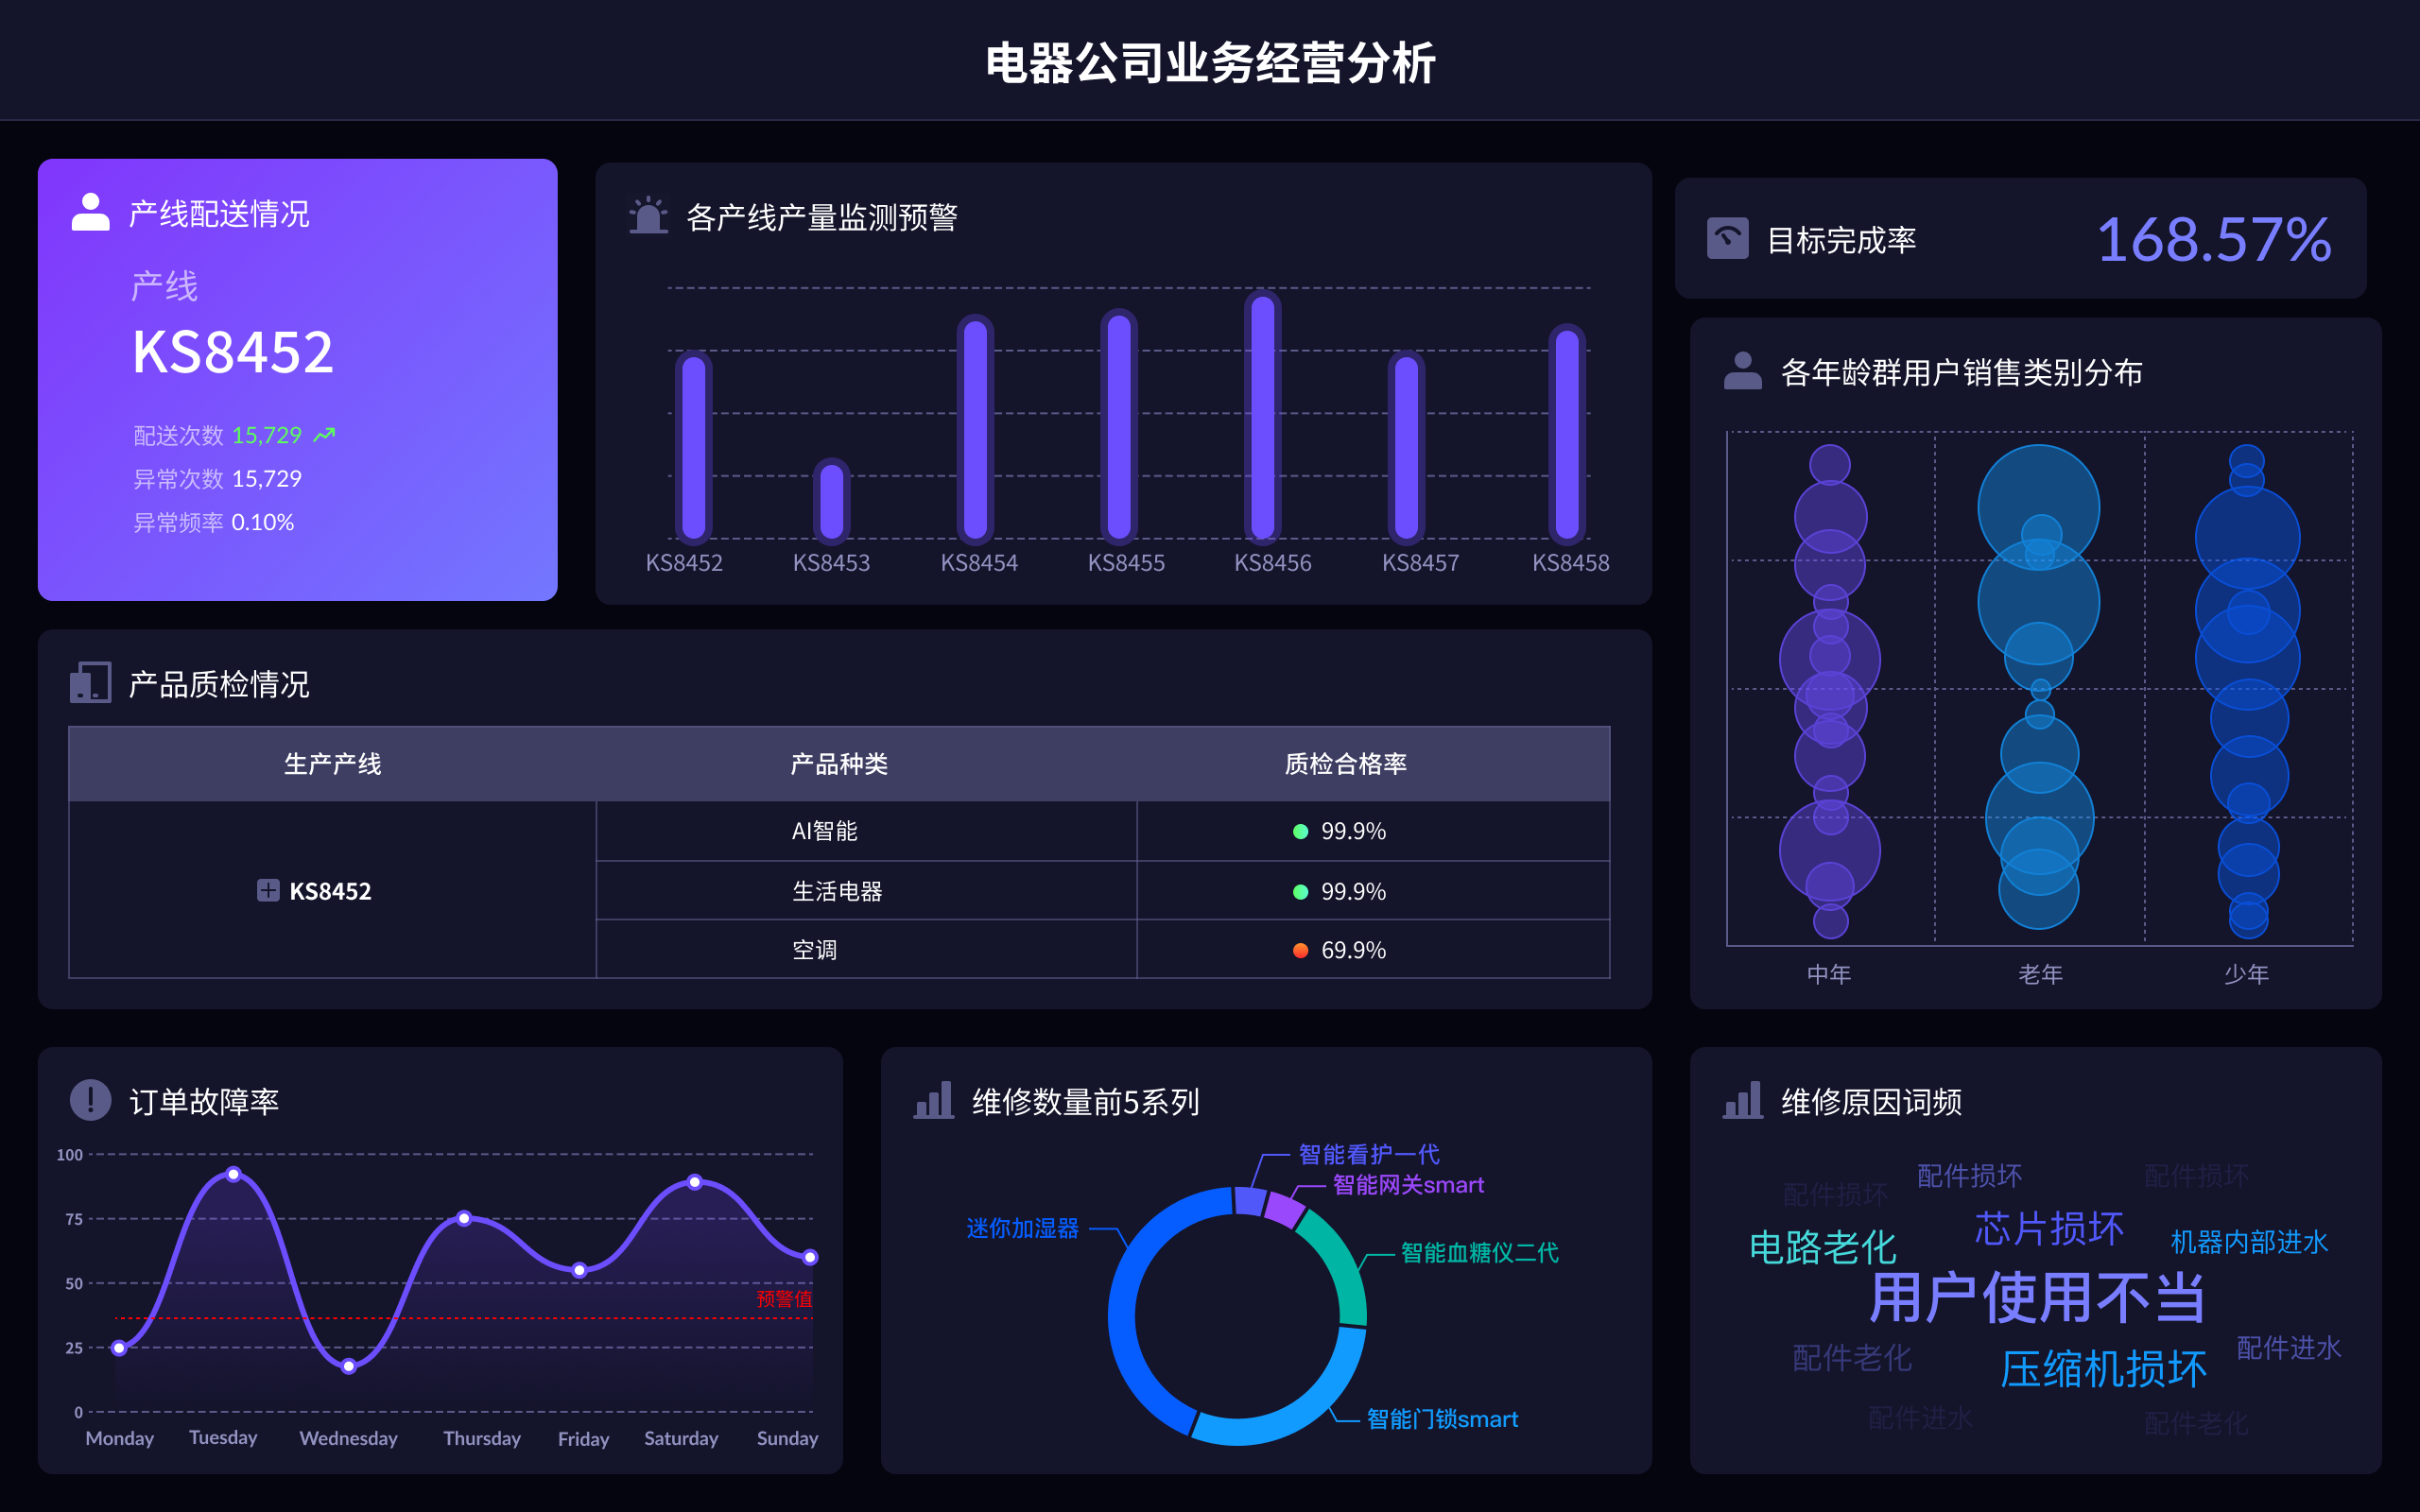
供销社数据可视化平台有FineBI、FineReport、FineVis、Power BI、Tableau。其中,FineBI 因其易用性强、功能全面、数据分析能力出色等优势,备受推崇。FineBI 是一款由帆软公司开发的数据分析和可视化工具,提供丰富的图表类型、灵活的数据处理功能,并且支持多种数据源连接。该平台不仅能够满足企业日常的数据分析需求,还能通过拖拽式的操作界面,让用户无需编程即可快速上手,实现高效的数据可视化和洞察。
一、FINEBI、功能全面、易用性强、数据分析能力出色
FineBI 是帆软公司推出的专业数据分析和可视化平台,适用于企业数据分析和商业智能需求。其主要优势在于操作简便,无需编程即可使用。FineBI 提供多种图表和仪表盘,能够对数据进行深入分析和展示。支持多种数据源,包括数据库、Excel、CSV 等,方便用户整合和处理不同来源的数据。FineBI 还提供了强大的数据处理功能,包括数据清洗、数据转换和数据聚合,使用户能够对数据进行灵活的操作和处理。
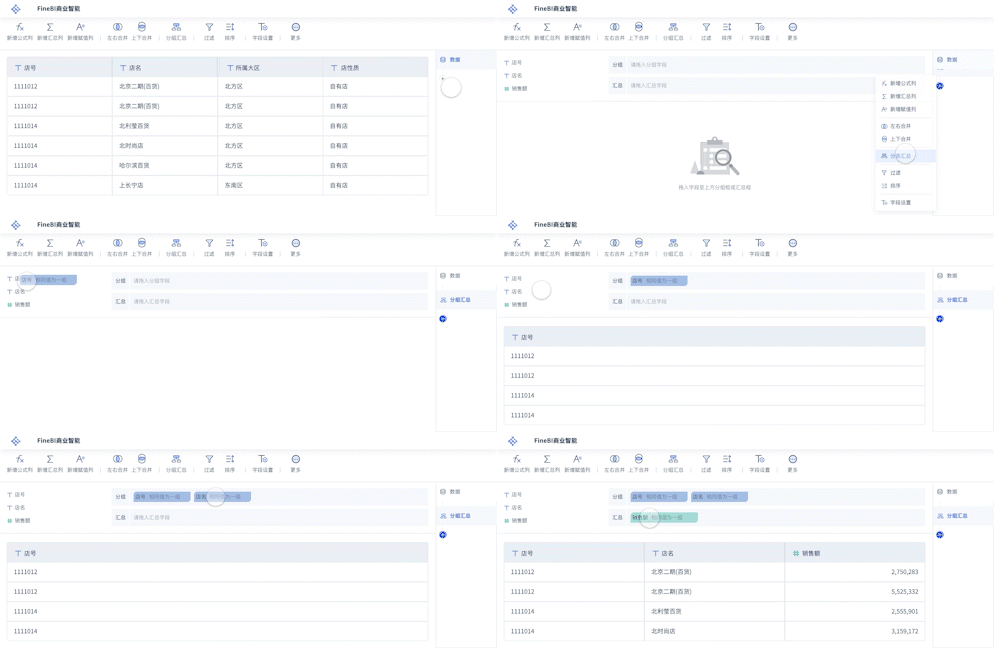
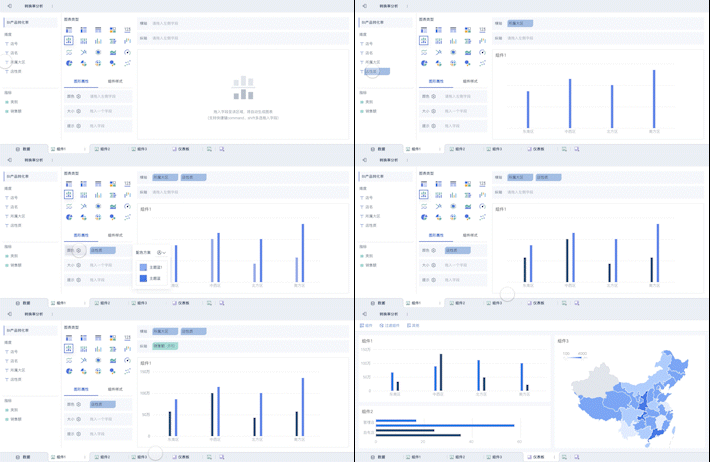
在数据分析方面,FineBI 提供丰富的分析功能,包括数据透视、数据分组、数据筛选和数据排序等。用户可以通过拖拽操作轻松完成数据分析和展示,实时获取数据洞察。FineBI 还支持多种数据可视化方式,如柱状图、折线图、饼图、散点图等,满足不同类型的数据展示需求。此外,FineBI 还具备智能预警功能,能够根据设定的规则自动监控数据变化,及时发现和处理异常情况。
FineBI 官网: https://s.fanruan.com/f459r
二、FINEBI、EASY TO USE、POWERFUL DATA ANALYSIS CAPABILITIES
FineBI stands out in the data visualization field due to its user-friendly interface and robust data analysis capabilities. The drag-and-drop functionality allows users to create visualizations without the need for programming skills. This ease of use makes FineBI an excellent choice for organizations looking to empower their employees with data analysis tools. FineBI's comprehensive features include multiple chart types, dynamic dashboards, and real-time data processing capabilities. It supports integration with various data sources, making it a versatile tool for different business needs.
FineBI also offers advanced data processing functionalities such as data cleaning, transformation, and aggregation, enabling users to manipulate and analyze their data effectively. The platform's powerful analytical capabilities allow users to perform complex data operations, such as pivoting, grouping, filtering, and sorting. With FineBI, users can gain deep insights into their data, facilitating better decision-making and strategic planning.
三、FINEREPORT、DETAILED REPORTING、CUSTOMIZABLE TEMPLATES
FineReport is another excellent product from FanRuan, designed for detailed reporting and data visualization. It excels in creating customizable and comprehensive reports. FineReport supports a wide range of data sources and offers flexible report design capabilities, making it ideal for businesses that require detailed and customized reporting solutions. Users can create complex reports with multiple data sources, incorporating various visualization elements such as charts, tables, and text.
FineReport's robust reporting features include parameterized reports, cascading reports, and drill-down reports, allowing users to interact with and explore their data in-depth. The platform also supports scheduling and automated report distribution, ensuring that stakeholders receive timely and accurate information. FineReport's integration capabilities enable seamless connectivity with other enterprise systems, enhancing data accessibility and usability.
FineReport 官网: https://s.fanruan.com/ryhzq
四、FINEVIS、INTERACTIVE VISUALIZATIONS、EASY DATA EXPLORATION
FineVis is designed for creating interactive visualizations and facilitating easy data exploration. It provides users with intuitive tools to create dynamic and engaging visualizations. FineVis supports various chart types and interactive features, allowing users to drill down into data, filter information, and explore data relationships visually. This interactivity helps users uncover insights and trends that might be hidden in static reports.
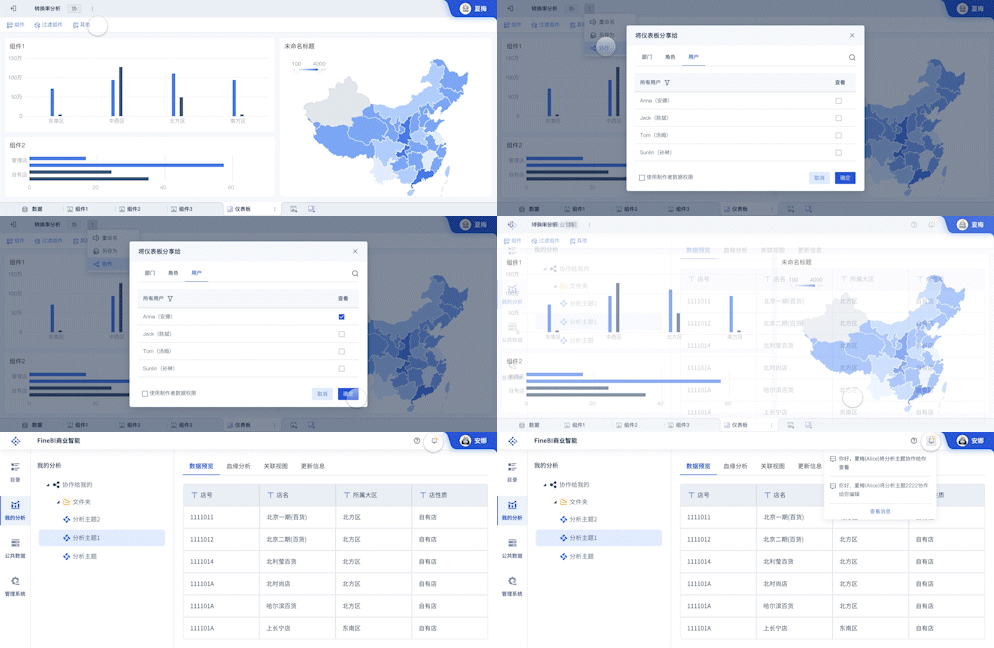
FineVis's user-friendly interface and drag-and-drop functionality make it accessible to users of all skill levels. The platform's real-time data processing capabilities ensure that users have access to the most up-to-date information, enhancing the accuracy and relevance of their analyses. FineVis also supports collaboration, enabling teams to share and discuss visualizations, fostering a data-driven culture within the organization.
FineVis 官网: https://s.fanruan.com/7z296
五、POWER BI、MICROSOFT INTEGRATION、COMPREHENSIVE ANALYTICS
Power BI is a widely used data visualization tool from Microsoft, known for its seamless integration with other Microsoft products and comprehensive analytics capabilities. Power BI provides a robust platform for creating detailed and interactive visualizations. It supports a wide range of data sources, including Excel, SQL Server, and Azure, making it a versatile tool for various business environments.
Power BI offers powerful data modeling and transformation capabilities, enabling users to prepare their data for analysis effectively. The platform's advanced analytics features, such as AI-driven insights and custom visuals, help users uncover deeper insights and make informed decisions. Power BI's integration with Microsoft 365 and other enterprise systems enhances collaboration and data sharing, making it a valuable tool for organizations looking to leverage their data for strategic advantage.
六、TABLEAU、ADVANCED VISUALIZATION CAPABILITIES、USER COMMUNITY
Tableau is renowned for its advanced visualization capabilities and strong user community. It offers a wide range of visualization options and interactive features. Tableau supports integration with various data sources and provides powerful tools for data preparation and analysis. Users can create complex and interactive visualizations, exploring data from different angles and uncovering hidden patterns and trends.
Tableau's advanced features, such as data blending, real-time analytics, and geospatial visualization, make it a powerful tool for comprehensive data analysis. The platform's intuitive interface and drag-and-drop functionality enable users to create visualizations without extensive technical knowledge. Tableau's active user community and extensive resources provide valuable support and learning opportunities for users, enhancing their ability to leverage the platform effectively.
供销社数据可视化平台的选择应根据具体需求和预算来确定。无论是FineBI、FineReport、FineVis,还是Power BI 和Tableau,每个平台都有其独特的优势和适用场景。通过详细了解各平台的功能和特点,企业可以选择最适合其需求的数据可视化解决方案,提升数据分析能力和业务决策水平。
相关问答FAQs:
供销社数据可视化平台有哪些?
供销社作为中国农村经济的重要组成部分,近年来在数据管理和分析方面越来越重视。数据可视化平台的出现,为供销社的决策提供了有效支持。以下是一些常见的供销社数据可视化平台:
-
Tableau:Tableau 是一个强大的数据可视化工具,广泛应用于各个行业。供销社可以利用 Tableau 的拖放功能,轻松创建交互式仪表板和报表。通过连接多种数据源,供销社能够实时监控销售数据、库存水平和客户反馈等关键信息。
-
Power BI:微软的 Power BI 是一款用户友好的数据分析和可视化工具,适合供销社使用。它支持多种数据源的整合,用户可以通过简单的界面设计出丰富的图表和报告,帮助管理层快速了解业务现状,优化经营策略。
-
Echarts:Echarts 是一个基于 JavaScript 的开源图表库,特别适合需要嵌入网页的可视化需求。供销社可以利用 Echarts 创建各种图表,如折线图、柱状图和饼图等,方便展示销售趋势、区域分布等信息,并且可以根据需要进行自定义。
-
QlikView:QlikView 是一款商业智能工具,通过其独特的关联数据模型,供销社能够快速发现数据之间的关系,进行深入分析。该平台支持多维度数据分析,适合处理复杂的供销业务数据,帮助管理者做出精准决策。
-
D3.js:D3.js 是一个强大的 JavaScript 库,适合需要高度定制的可视化项目。供销社可以利用 D3.js 根据自身需求创建各种数据可视化效果,展示如销售数据、市场趋势等信息,提升数据展示的灵活性和美观性。
-
Google Data Studio:Google Data Studio 提供了一个免费的数据可视化平台,用户可以创建交互式报告和仪表板。供销社可以将来自 Google Analytics、Google Sheets 等多种数据源的数据集成,便于实时监控和分析业务表现。
-
SAP Analytics Cloud:SAP 提供的这一平台,结合了数据分析、可视化和规划功能,适合大型供销社使用。通过集成企业内部和外部数据,供销社可以进行深入分析,制定长期发展战略。
-
Looker:Looker 是一款现代数据平台,支持 SQL 数据分析和可视化。供销社可以利用 Looker 生成可自定义的仪表板,跟踪关键业务指标,实现数据驱动的决策。
通过以上平台,供销社能够实现数据的可视化,便于管理层快速获取信息,优化决策过程,提高整体运营效率。不同平台各具特色,供销社可以根据自身的需求和技术能力选择合适的工具进行数据可视化。
本文内容通过AI工具匹配关键字智能整合而成,仅供参考,帆软不对内容的真实、准确或完整作任何形式的承诺。具体产品功能请以帆软官方帮助文档为准,或联系您的对接销售进行咨询。如有其他问题,您可以通过联系blog@fanruan.com进行反馈,帆软收到您的反馈后将及时答复和处理。


