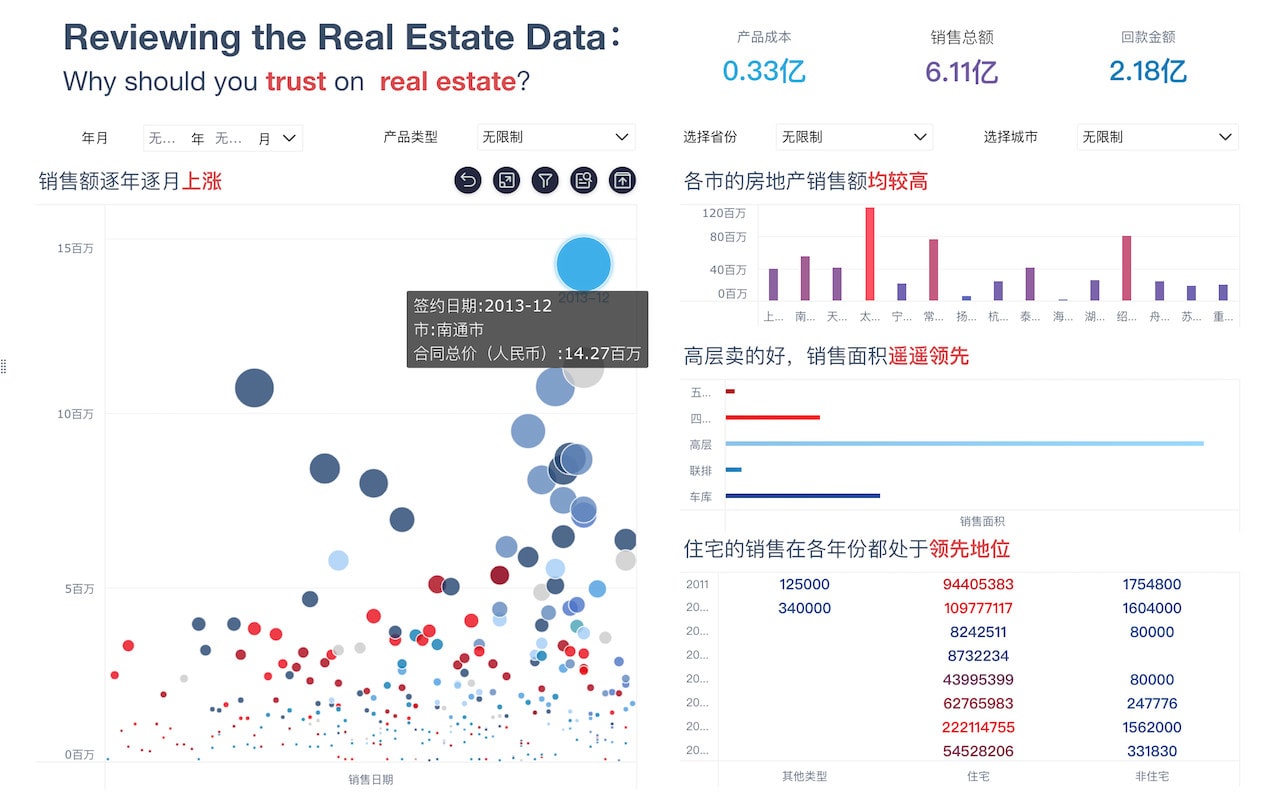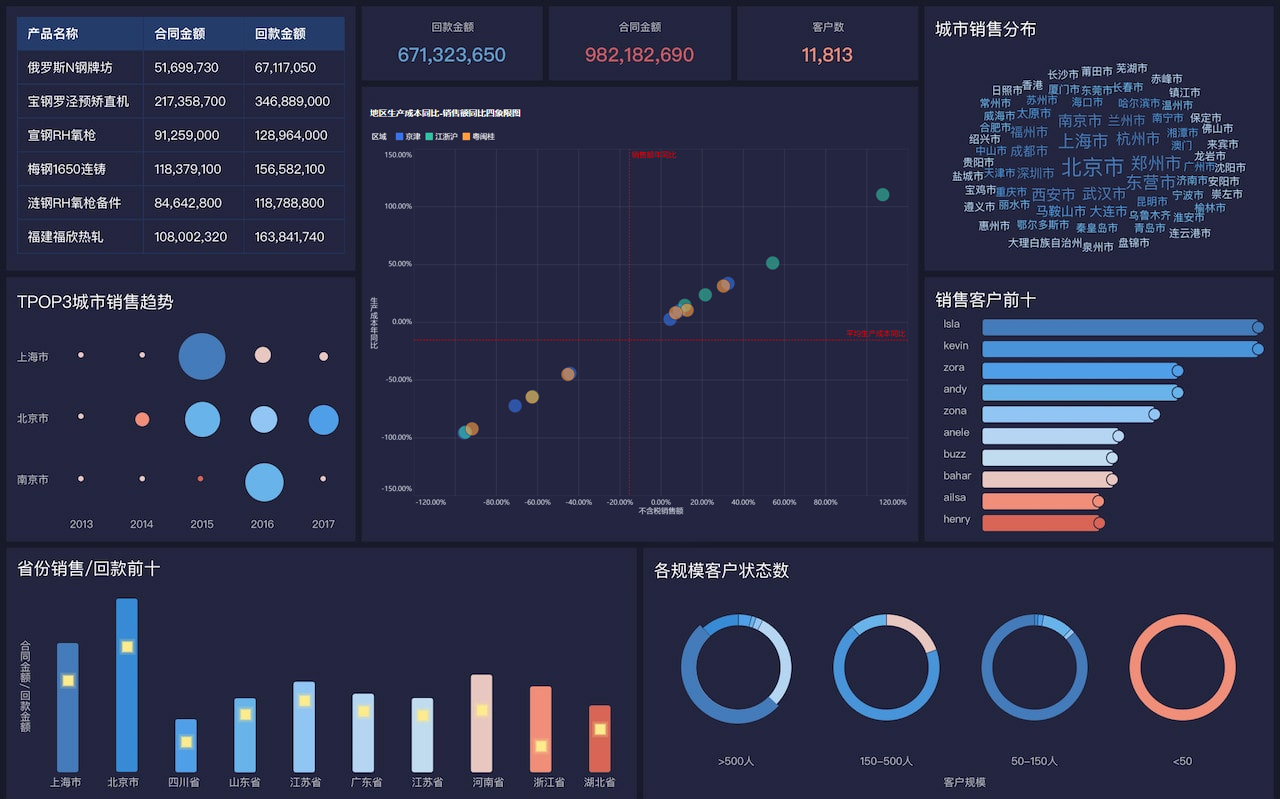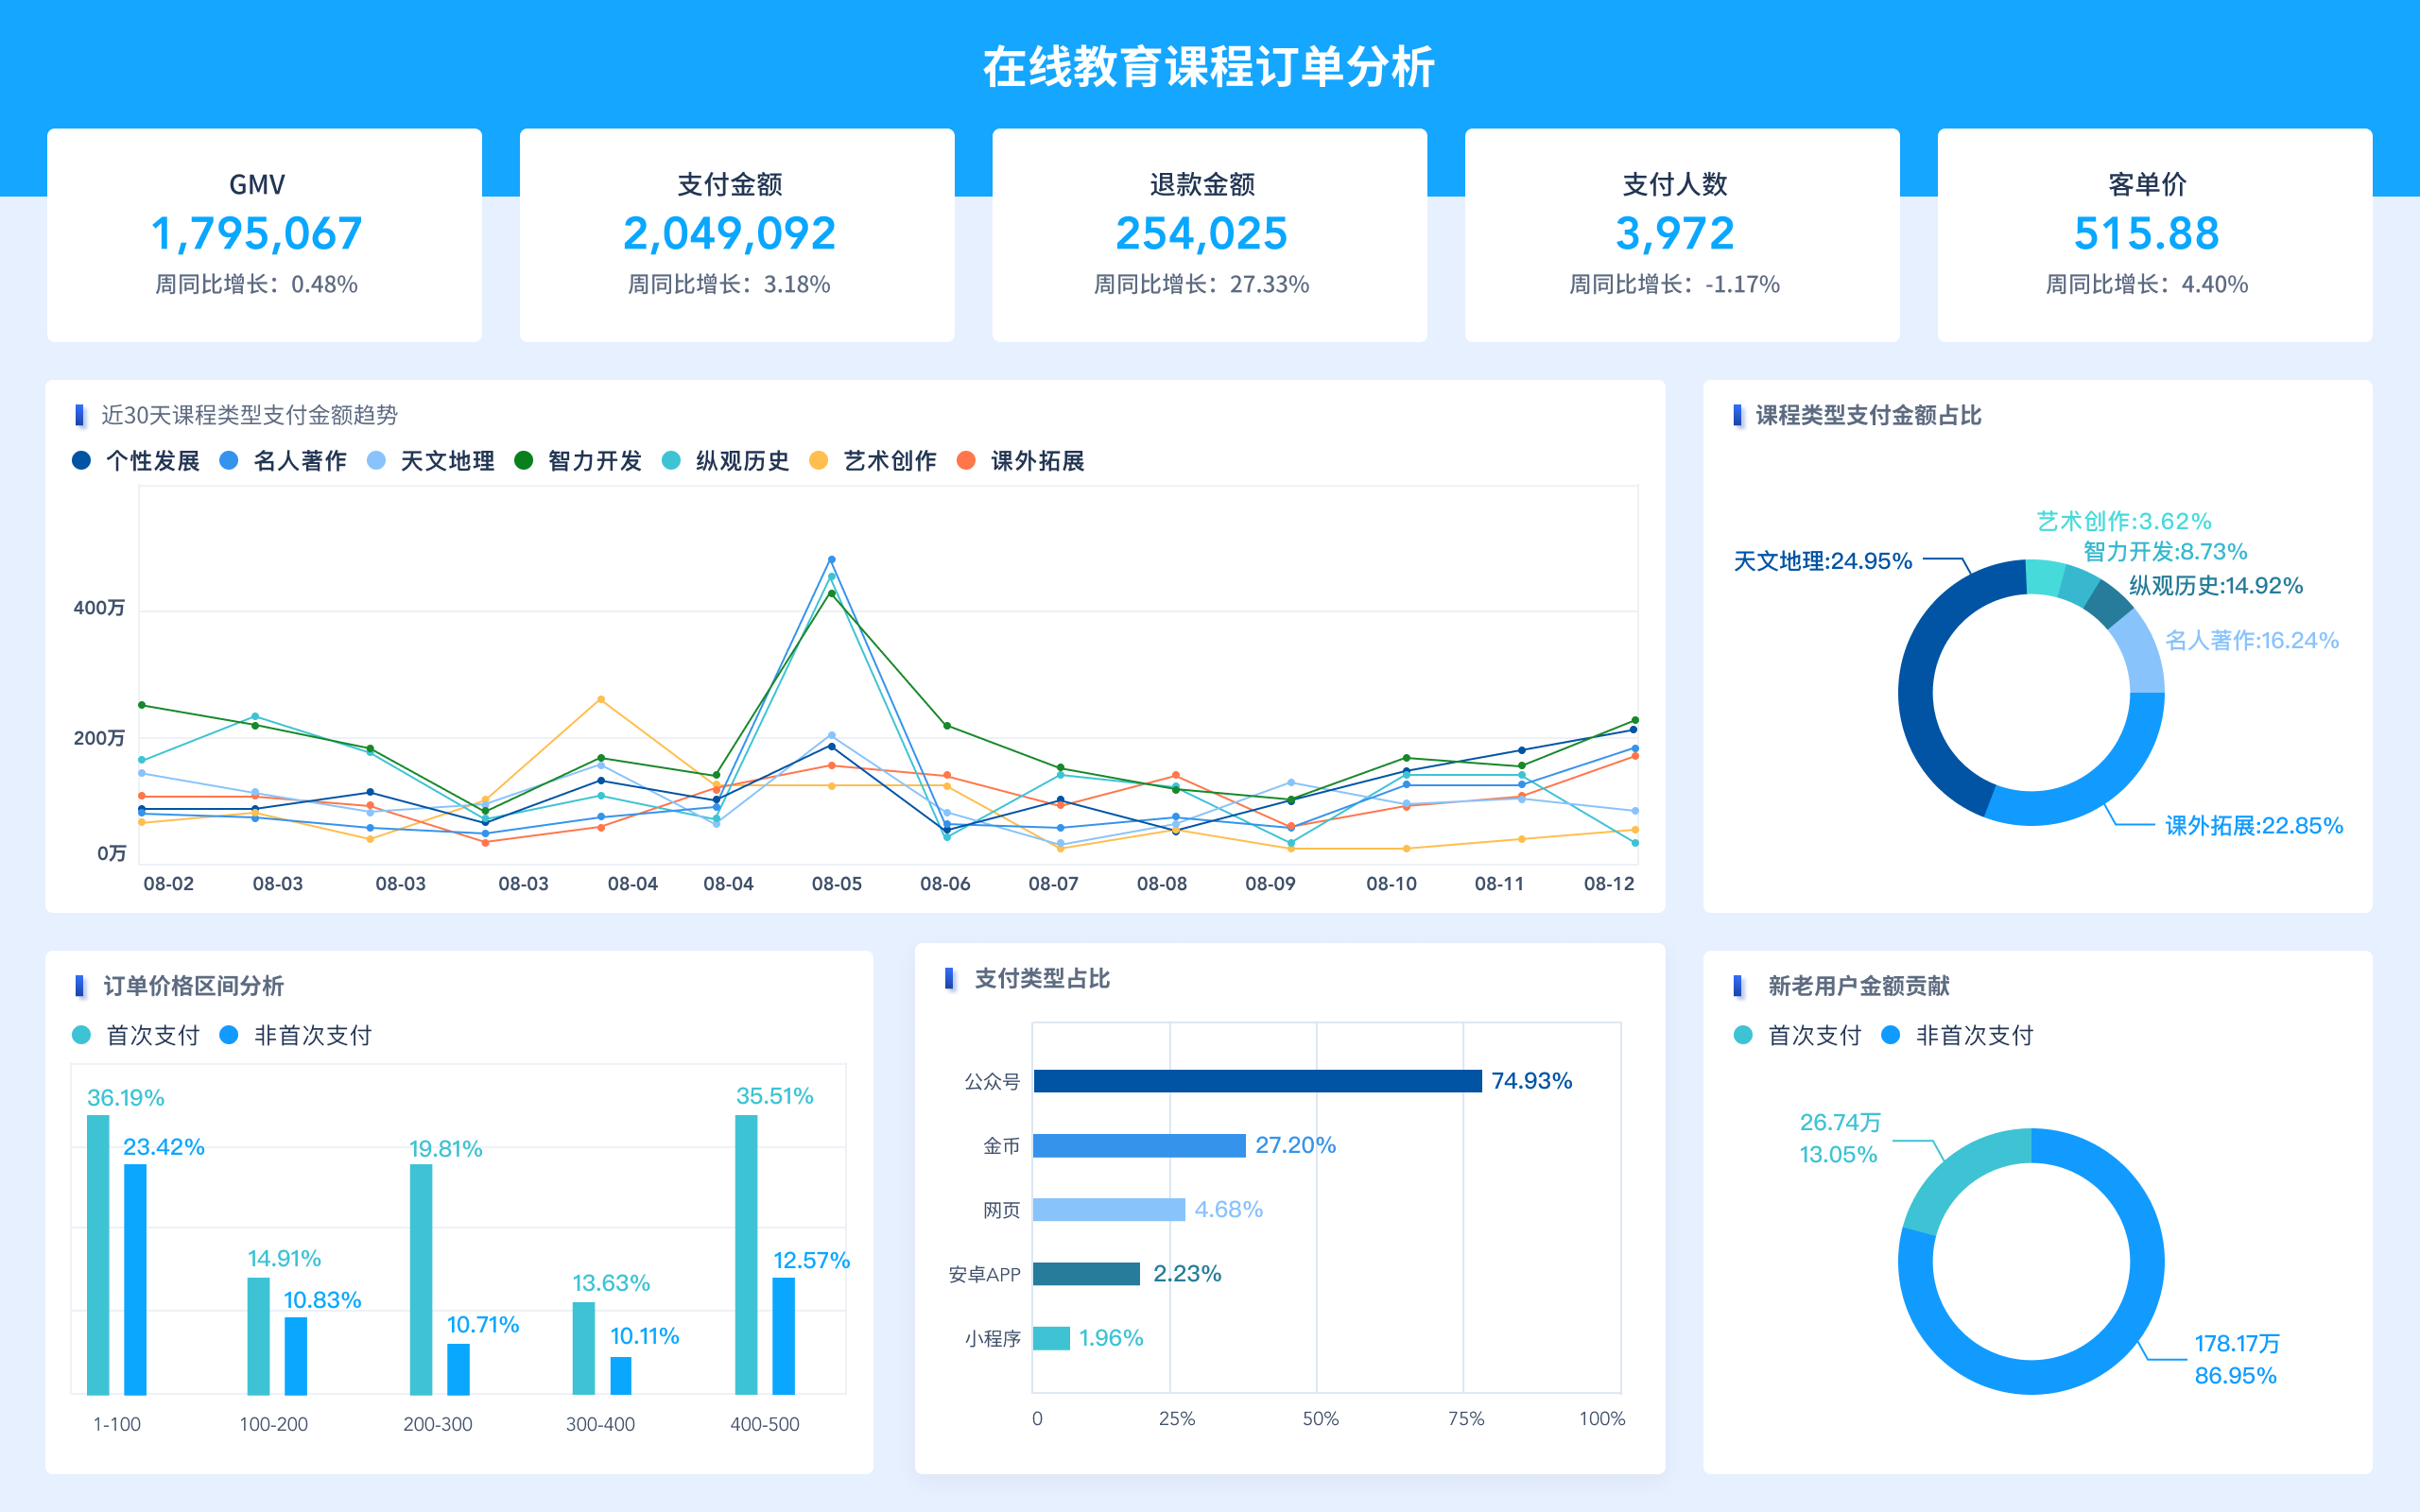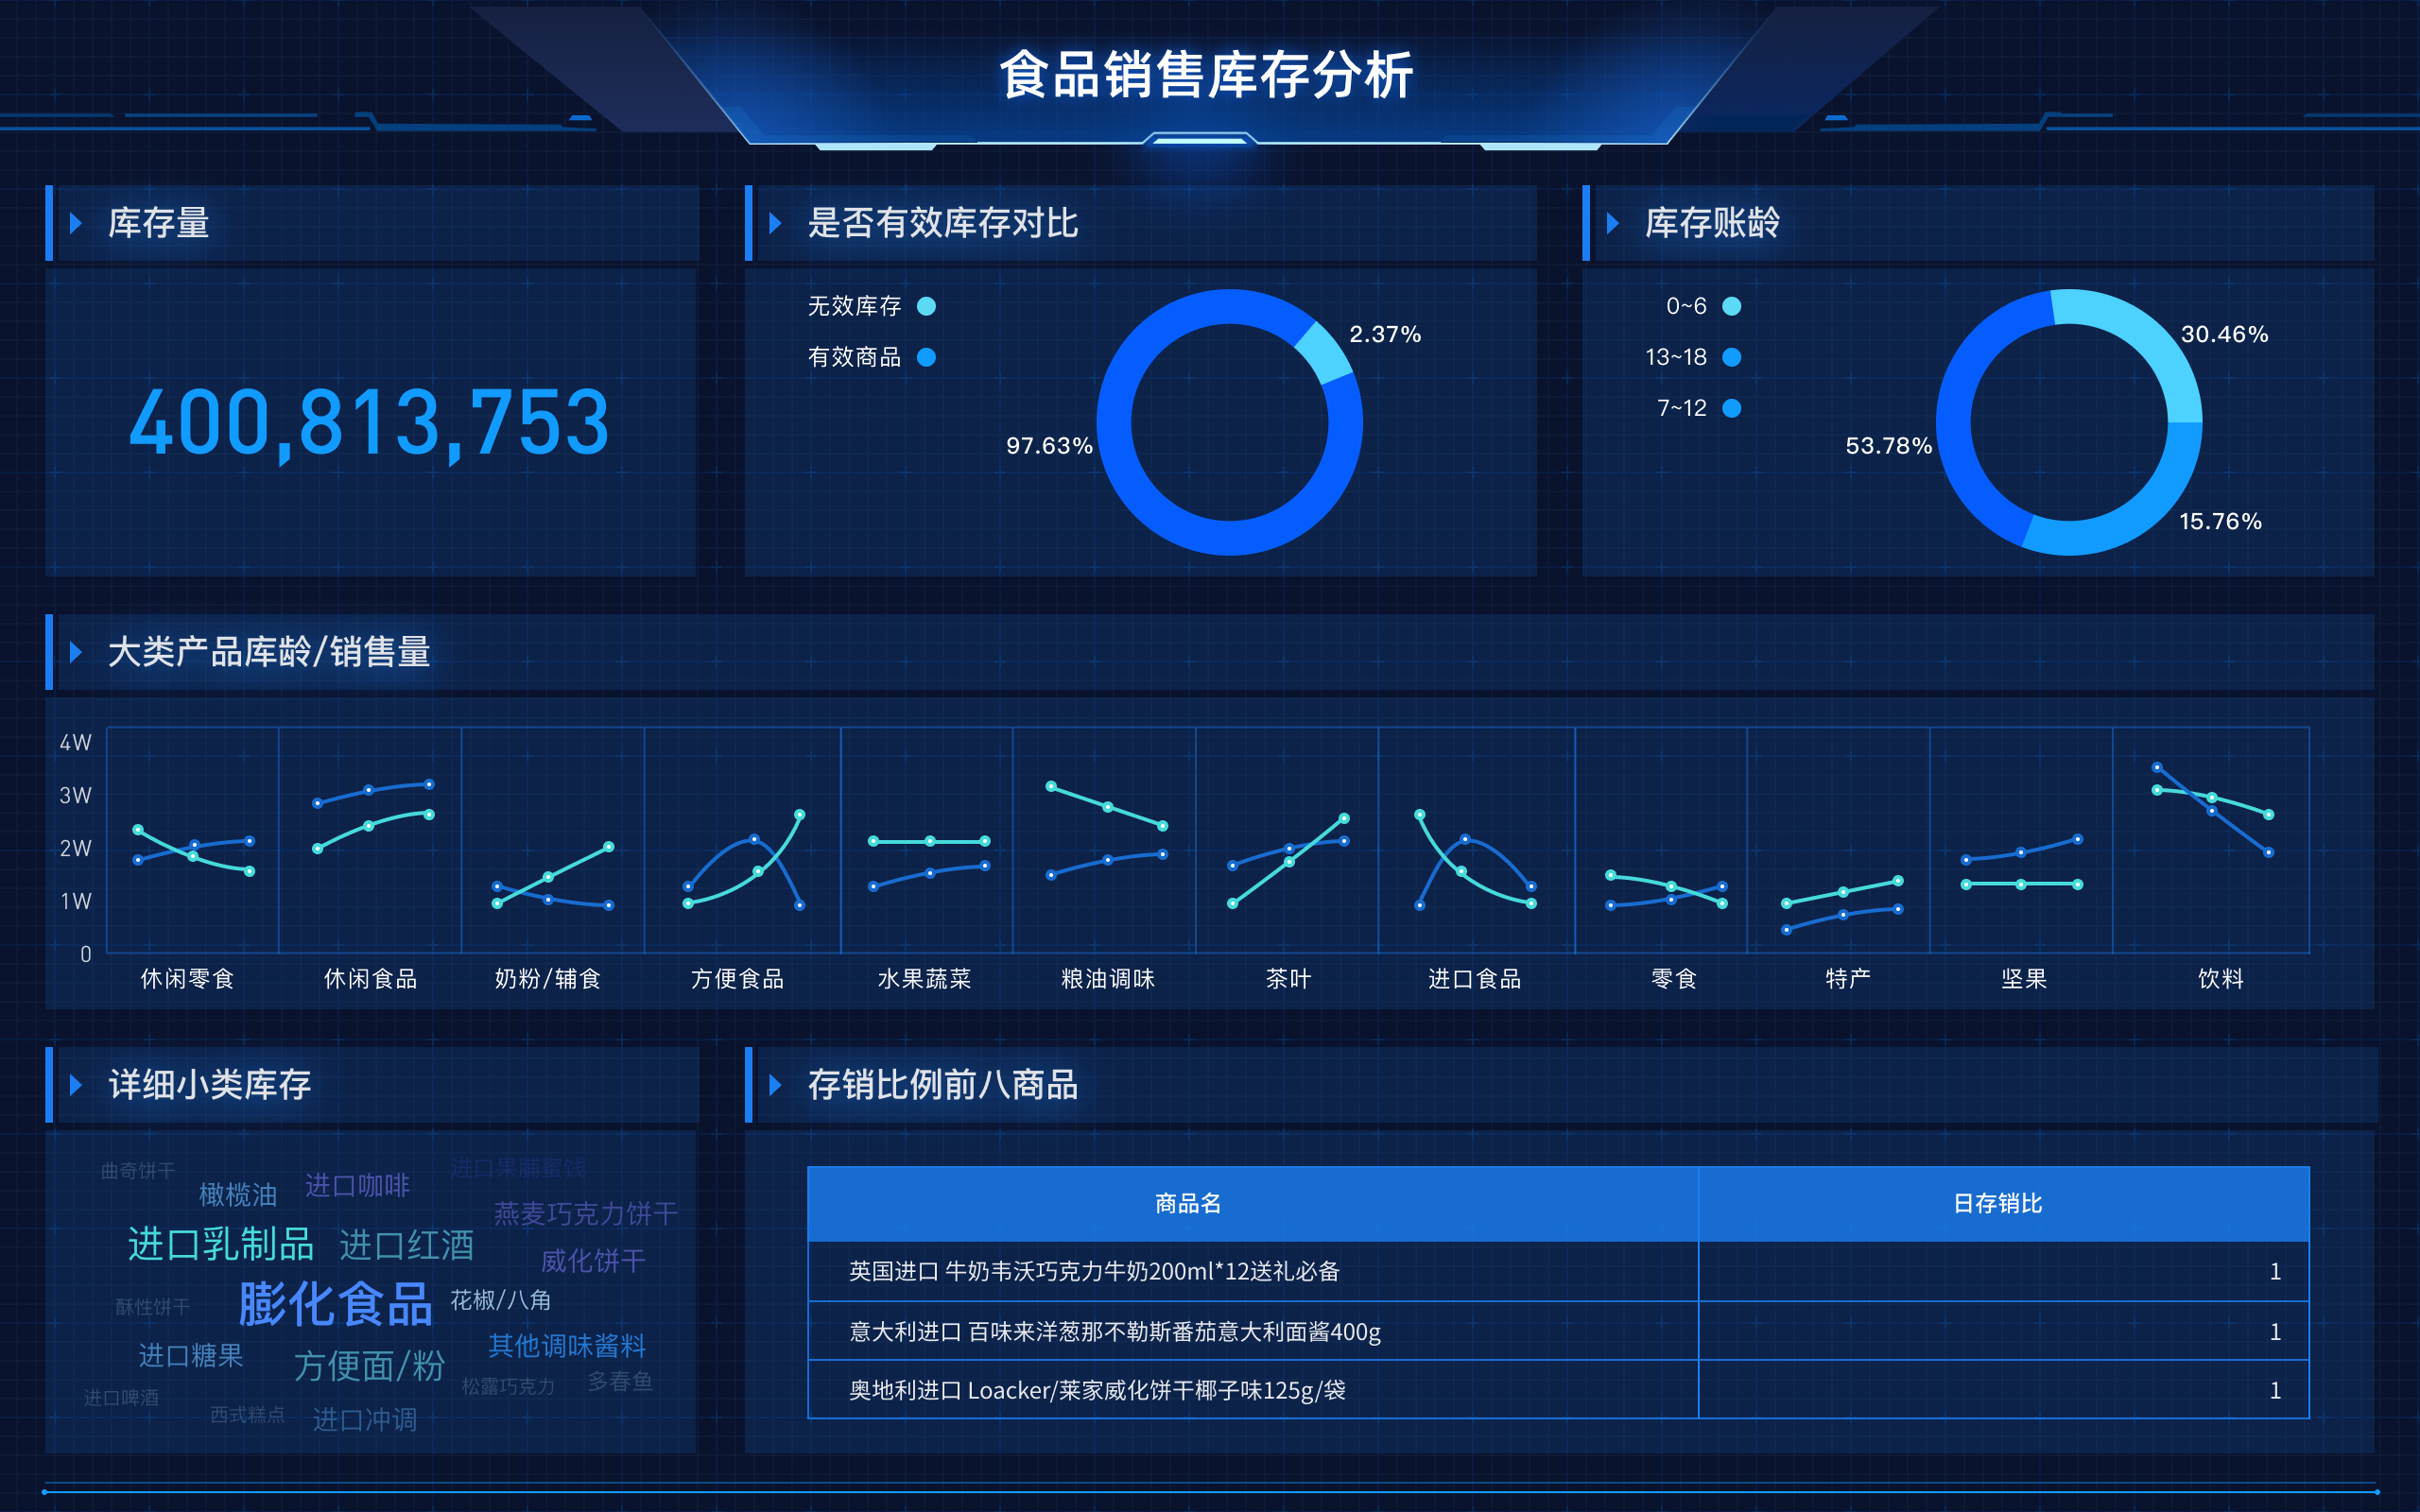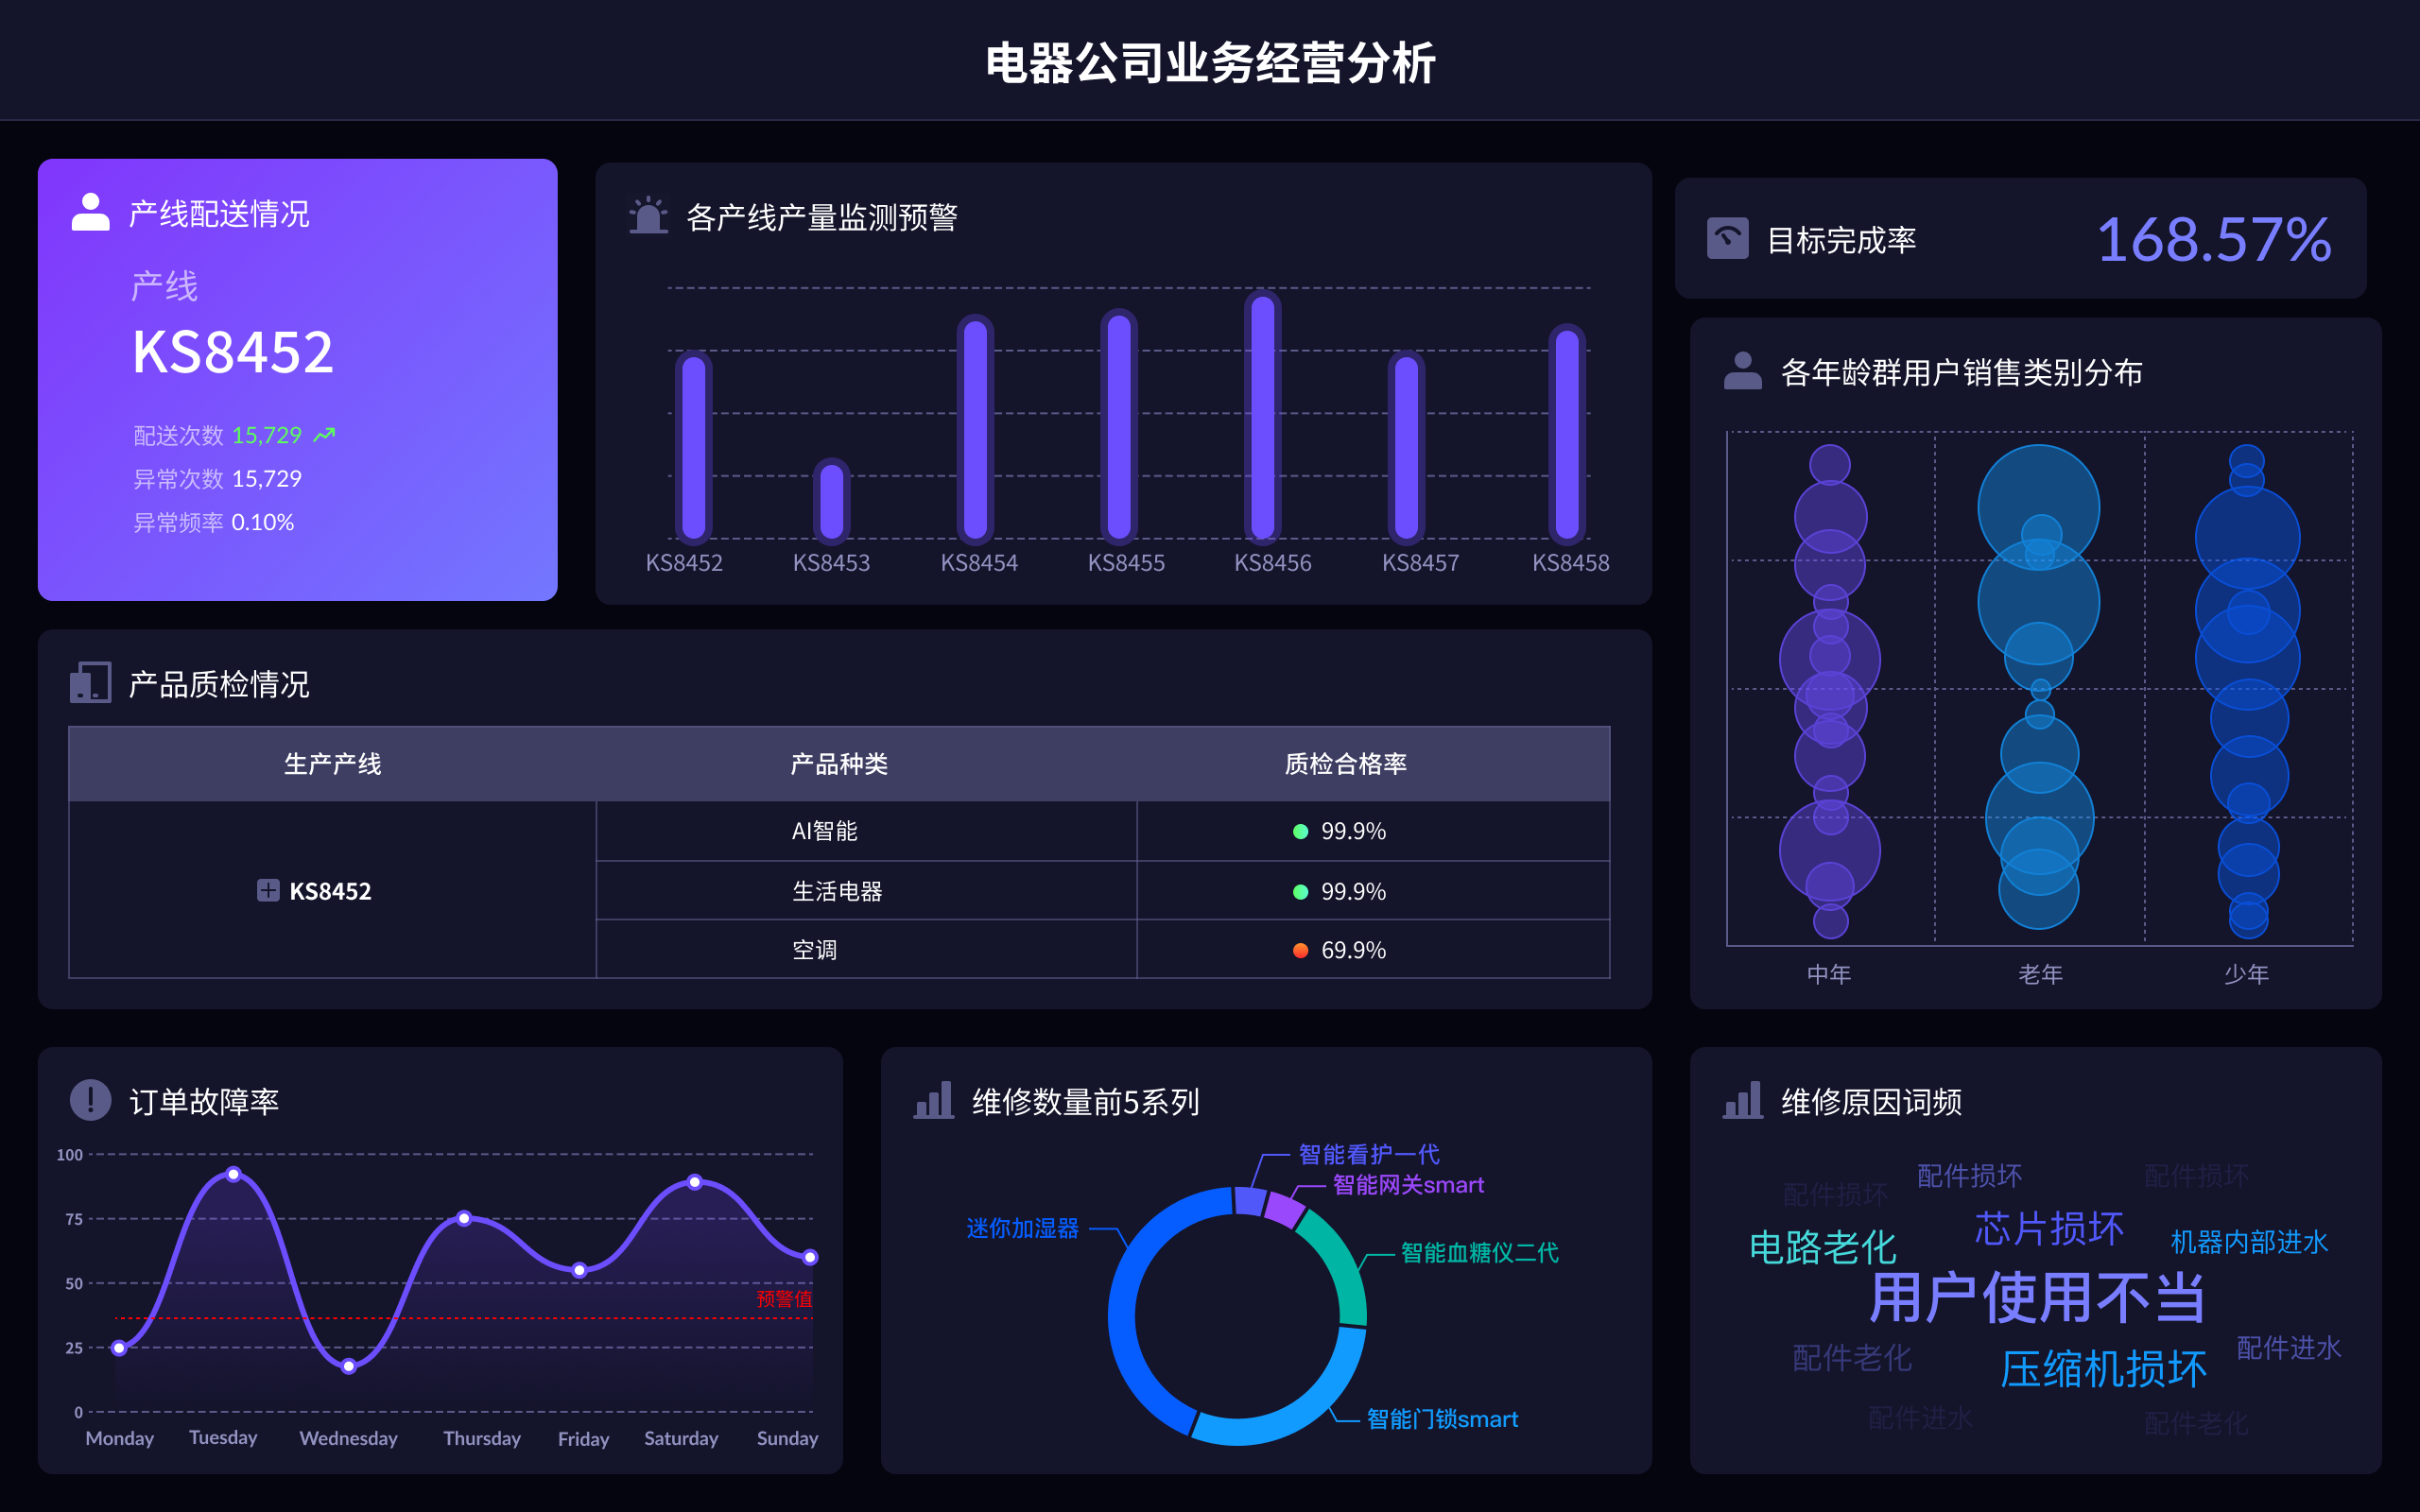
Writing an English paper on big data visualization involves several key steps, such as a clear introduction, a thorough review of related work, a detailed methodology, results and discussion, and a concise conclusion. Focusing on the uniqueness of your visualization techniques, the insights gained from the data, and how your work advances the field can make your paper stand out. For example, emphasize the innovative aspects of your visualization approach, such as its ability to handle large-scale data or provide novel insights. A detailed methodology section should explain the tools and techniques used, including any software or algorithms developed specifically for your study.
I、INTRODUCTION
Big data visualization is essential for interpreting vast amounts of data generated in various fields, from finance to healthcare. The goal is to transform complex data sets into understandable, actionable insights. This paper discusses the importance of big data visualization, reviews existing methods, and introduces a novel approach for enhancing data comprehension and decision-making. By addressing the challenges of data volume, variety, and velocity, effective visualization techniques enable users to gain deeper insights and make informed decisions. This introduction sets the stage for a comprehensive discussion on the state-of-the-art in big data visualization and the innovations presented in this paper.
II、RELATED WORK
The related work section reviews significant contributions to the field of big data visualization. Early methods focused on simple charts and graphs, but with the exponential growth of data, more sophisticated techniques emerged. Visual analytics combines data analysis with interactive visualizations, allowing users to explore large datasets dynamically. Tools like Tableau, FineBI, and FineReport have advanced these capabilities, providing robust platforms for creating detailed visualizations. Additionally, research on multidimensional scaling, clustering, and heat maps has contributed to the development of more intuitive visualization methods. This section highlights the evolution of visualization techniques and their impact on data analysis.
III、METHODOLOGY
The methodology section details the processes and tools used to achieve the research objectives. Data preprocessing is crucial for handling missing values, noise, and inconsistencies. Advanced algorithms like machine learning and AI can enhance the visualization process by identifying patterns and trends within the data. Software tools such as FineBI, FineReport, and FineVis offer powerful features for creating interactive and dynamic visualizations. This section also discusses the importance of user feedback in refining visualization techniques and ensuring they meet the needs of end-users. By leveraging these methodologies, researchers can develop more effective and insightful visualizations.
IV、IMPLEMENTATION
Implementation involves applying the chosen methodologies to real-world datasets. This section provides detailed examples of how big data visualization techniques can be used in various domains. For instance, in healthcare, visualizations can track disease outbreaks and monitor patient health trends. Financial institutions use visualizations to identify market trends and assess risk. The implementation process includes selecting appropriate data sets, applying preprocessing techniques, and using visualization tools to create meaningful representations of the data. This section emphasizes the practical applications of big data visualization and the benefits it brings to different industries.
V、RESULTS AND DISCUSSION
The results and discussion section presents the findings from the implemented visualizations. Clear and concise visual representations of the data help reveal insights that may not be apparent through traditional analysis methods. This section should include charts, graphs, and other visual aids to support the findings. Discuss how the visualizations help in understanding the data and making informed decisions. Any limitations of the study should also be addressed, along with suggestions for future research. This section highlights the value of big data visualization in providing actionable insights and guiding decision-making processes.
VI、CONCLUSION
The conclusion summarizes the key points discussed in the paper and reiterates the importance of big data visualization. Effective visualization techniques transform complex data into understandable and actionable insights, enabling better decision-making across various domains. The paper emphasizes the need for continuous innovation in visualization tools and techniques to keep pace with the growing volume and complexity of data. Future research should focus on developing more intuitive and interactive visualization methods that cater to the specific needs of different industries. This conclusion reinforces the significance of big data visualization in the modern data-driven world.
In summary, writing an English paper on big data visualization involves a clear and structured approach, focusing on innovative techniques, practical applications, and the insights gained from the data. By following these guidelines and utilizing advanced tools like FineBI, FineReport, and FineVis, researchers can create impactful visualizations that drive informed decision-making. For more information on these tools, visit their official websites: FineBI, FineReport, and FineVis.
相关问答FAQs:
大数据可视化英文文献怎么写?
在撰写大数据可视化的英文文献时,有几个关键要素需要考虑,以确保文献的质量和影响力。以下是一些重要的步骤和建议,帮助您进行有效的写作。
1. 确定文献的主题与研究问题
在开始写作之前,明确您要探讨的主题至关重要。大数据可视化的领域非常广泛,可能涉及数据分析、图形设计、用户交互等方面。选择一个具体的研究问题可以帮助您聚焦于文献的核心内容。例如,您可以研究大数据可视化在特定行业(如医疗、金融、教育等)的应用,或探讨某种特定可视化工具的有效性。
2. 进行广泛的文献回顾
在撰写文献之前,广泛的文献回顾是必不可少的。搜索相关的学术文章、书籍和会议论文,了解当前的研究现状、主要的理论框架和方法论。使用数据库如Google Scholar、IEEE Xplore和SpringerLink,可以帮助您获取最新的研究成果。文献回顾不仅能够帮助您了解已有的研究成果,还能为您的研究提供坚实的理论基础。
3. 采用清晰的结构
文献的结构是确保读者理解您观点的重要因素。通常,文献可以按照以下结构进行组织:
-
引言:介绍研究背景、目的和重要性。清晰地阐述您的研究问题以及它对大数据可视化领域的贡献。
-
文献综述:总结相关的研究,识别研究中的空白和争议。您可以根据不同的主题进行分类,突出不同研究之间的联系与区别。
-
方法论:详细描述您所采用的研究方法,包括数据来源、分析工具和可视化技术。这一部分需要详细且具体,以便其他研究者能够复制您的研究。
-
结果与讨论:展示您的研究结果,并与已有研究进行对比。讨论结果的意义,提出自己的见解和建议。
-
结论:总结主要发现,强调研究的局限性和未来研究的方向。
4. 注意语言的准确性与专业性
在撰写英文文献时,使用准确且专业的语言是非常重要的。避免使用模糊的表述,要确保每个术语的使用都符合领域内的标准。此外,使用被动语态和第三人称叙述可以增强文献的学术性。适当使用图表、图形和示例可以帮助解释复杂的概念和数据。
5. 引用与参考文献
准确的引用和参考文献是学术写作中不可或缺的部分。确保遵循特定的引用格式,如APA、MLA或IEEE等。引用不仅可以支持您的观点,还能为您的研究增添可信度。使用文献管理工具(如Zotero或EndNote)可以帮助您轻松管理和格式化引用。
6. 进行同行评审与修改
在提交文献之前,进行同行评审是一个非常有效的步骤。请教您的同事或导师,获取他们的反馈和建议。根据反馈进行适当的修改和调整,以提高文献的质量。此外,自我审查也是必要的,确保逻辑清晰、数据准确、语言流畅。
7. 关注最新的研究动态
大数据可视化是一个快速发展的领域,保持对最新研究动态的关注非常重要。定期参加相关的学术会议、研讨会和网络研讨会,可以帮助您了解行业趋势和前沿技术。通过与其他研究者的交流,您可以获得新的灵感和想法,从而丰富您的研究。
通过遵循上述步骤,您将能够撰写出高质量的大数据可视化英文文献,促进您在这一领域的研究与探索。
大数据可视化的主要工具有哪些?
大数据可视化工具种类繁多,各自具有独特的特点和优势,适用于不同的分析需求和数据类型。以下是一些常见的大数据可视化工具及其功能:
-
Tableau:作为当前市场上最受欢迎的可视化工具之一,Tableau允许用户通过简单的拖放操作创建交互式图表和仪表板。它支持多种数据源的连接,包括Excel、SQL数据库和云数据,适合分析大量数据。
-
Power BI:由微软开发,Power BI是一款强大的商业智能工具,能够从多种数据源提取信息,并提供丰富的可视化选项。其用户界面友好,适合企业用户进行数据分析和报告。
-
D3.js:对于具备编程能力的用户,D3.js是一种强大的JavaScript库,允许创建高度自定义的交互式图形。它支持数据驱动的文档(Data-Driven Documents),能够在网页上展示复杂的数据可视化。
-
QlikView:QlikView是一款商业智能平台,提供强大的数据关联和可视化功能。用户可以通过简单的操作构建可视化分析,适合企业级数据分析。
-
Google Data Studio:作为一款免费的在线工具,Google Data Studio允许用户创建交互式的可视化报告。它与Google Analytics等其他Google产品无缝集成,适合数字营销和网站分析。
-
Plotly:Plotly是一个开源的图表库,支持Python、R和JavaScript等多种编程语言。它适合开发者和数据科学家,能够创建专业的图表和仪表板。
-
Looker:Looker是一款现代化的商业智能工具,支持数据建模和可视化,适合企业进行复杂的数据分析和报告。
-
R和ggplot2:R语言是数据分析和统计领域的强大工具,而ggplot2是R中最流行的可视化库之一。它允许用户通过简单的语法创建复杂的图形,适合统计分析和学术研究。
以上工具各有特点,选择合适的工具应基于您的具体需求、技术能力及项目目标。
如何评估大数据可视化的效果?
评估大数据可视化的效果是确保其有效性和使用价值的重要环节。以下是一些评估可视化效果的关键指标和方法:
-
用户反馈:收集用户对可视化结果的反馈是评估效果的重要方式。通过调查问卷、访谈或用户测试,了解用户是否能够轻松理解和使用可视化工具。
-
交互性:评估可视化的交互性,用户是否可以通过交互操作(如缩放、过滤、选择等)深入探索数据。交互性强的可视化通常能够提供更深入的见解。
-
信息传递效率:分析可视化在传递信息时的效率。通过测试用户在多长时间内能够理解可视化所传达的信息,可以评估其有效性。
-
数据准确性:确保可视化所展示的数据准确无误。任何数据错误都会影响用户的决策和信任度,因此定期验证数据源和可视化结果的准确性至关重要。
-
可访问性:评估可视化的可访问性,确保所有用户,包括残障人士,都能够方便地获取和理解可视化结果。使用符合可访问性标准的设计,可以提升其使用范围。
-
可视化设计原则:评估可视化是否遵循良好的设计原则,包括色彩搭配、图形选择、排版和布局等。良好的设计能够提升可视化的吸引力和易读性。
-
决策支持:观察可视化在实际决策中的应用效果。评估其在决策过程中是否提供了有价值的信息,是否能够帮助用户做出更明智的决策。
通过综合这些评估方法,您可以全面了解大数据可视化的效果,从而不断优化和改进可视化作品,提升其在实际应用中的价值。
本文内容通过AI工具匹配关键字智能整合而成,仅供参考,帆软不对内容的真实、准确或完整作任何形式的承诺。具体产品功能请以帆软官方帮助文档为准,或联系您的对接销售进行咨询。如有其他问题,您可以通过联系blog@fanruan.com进行反馈,帆软收到您的反馈后将及时答复和处理。


