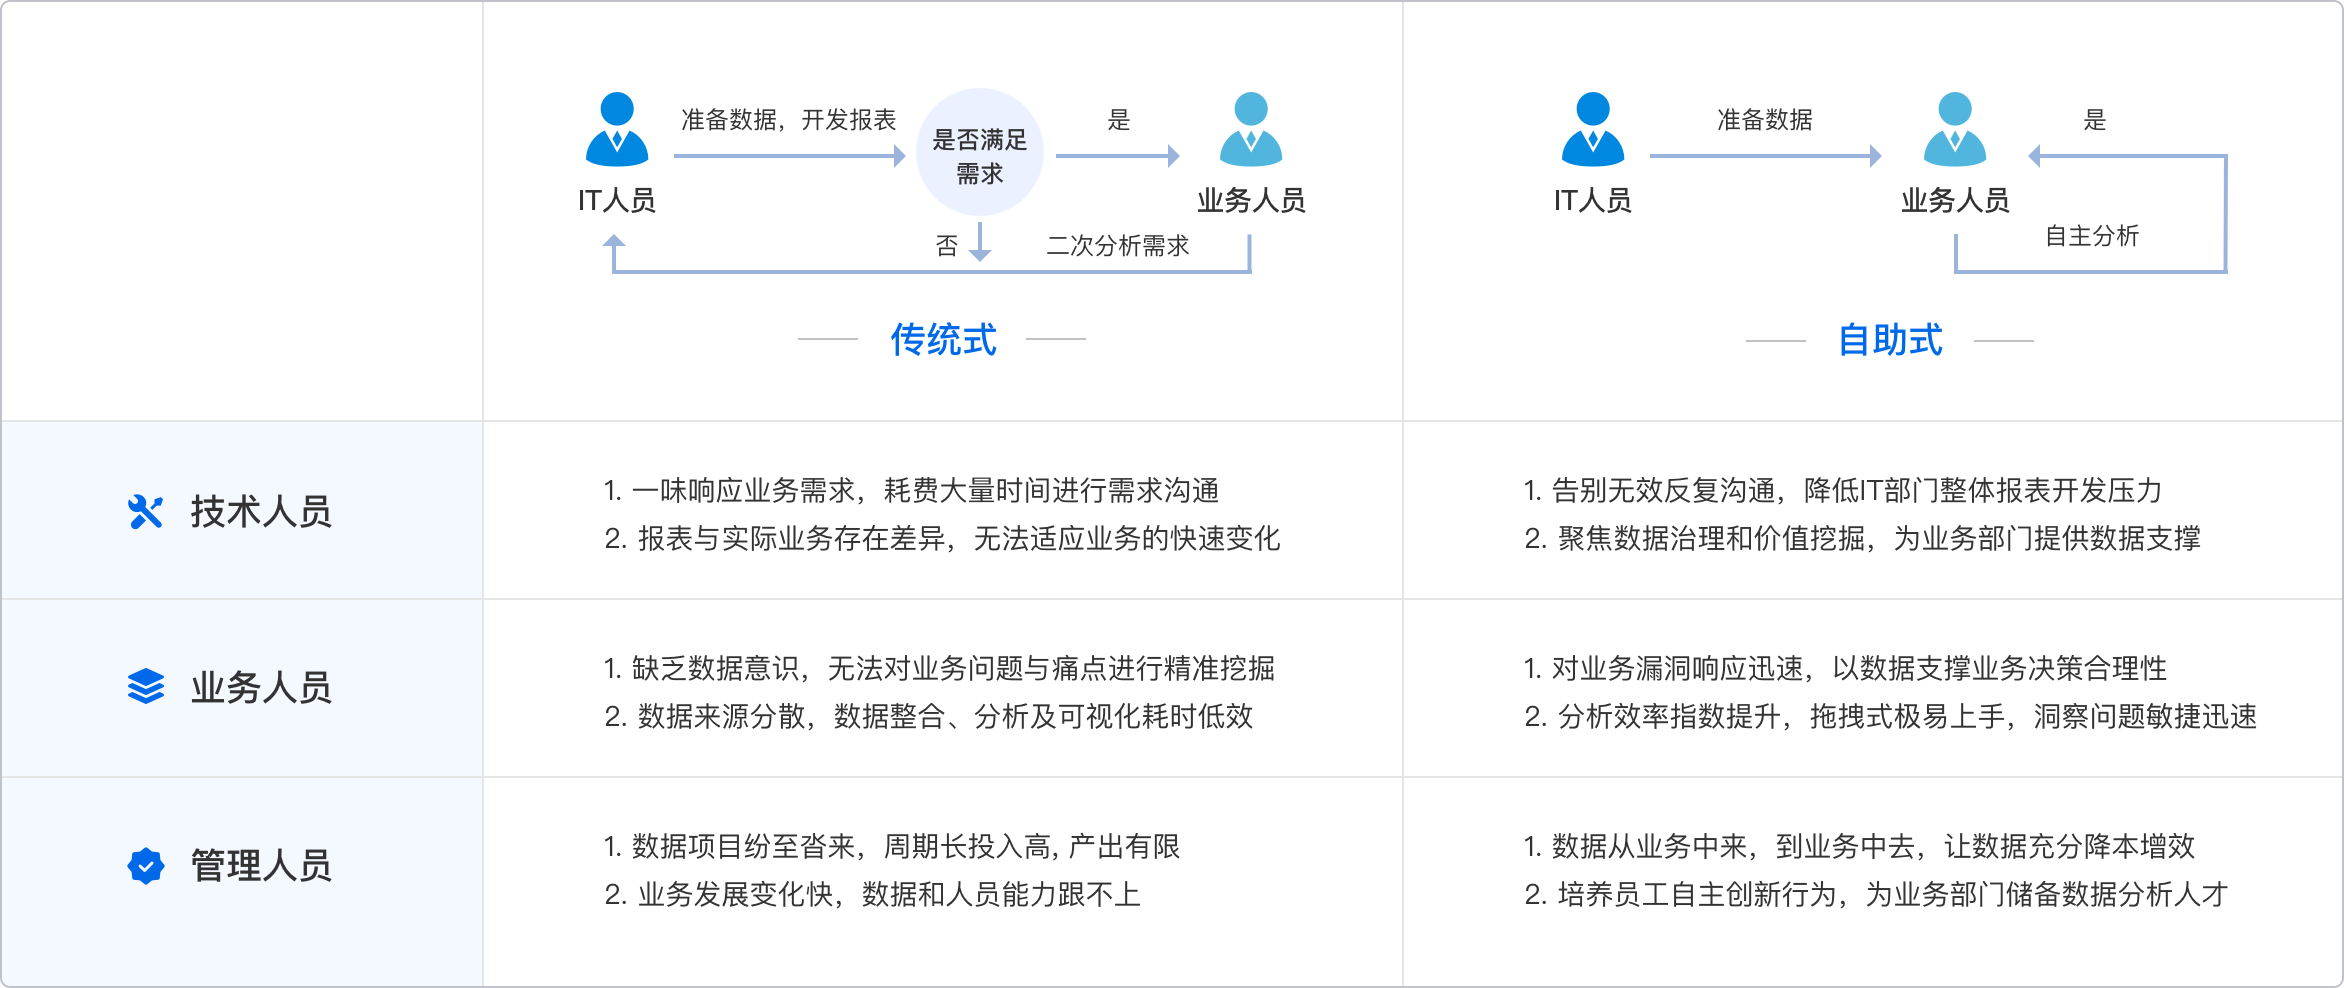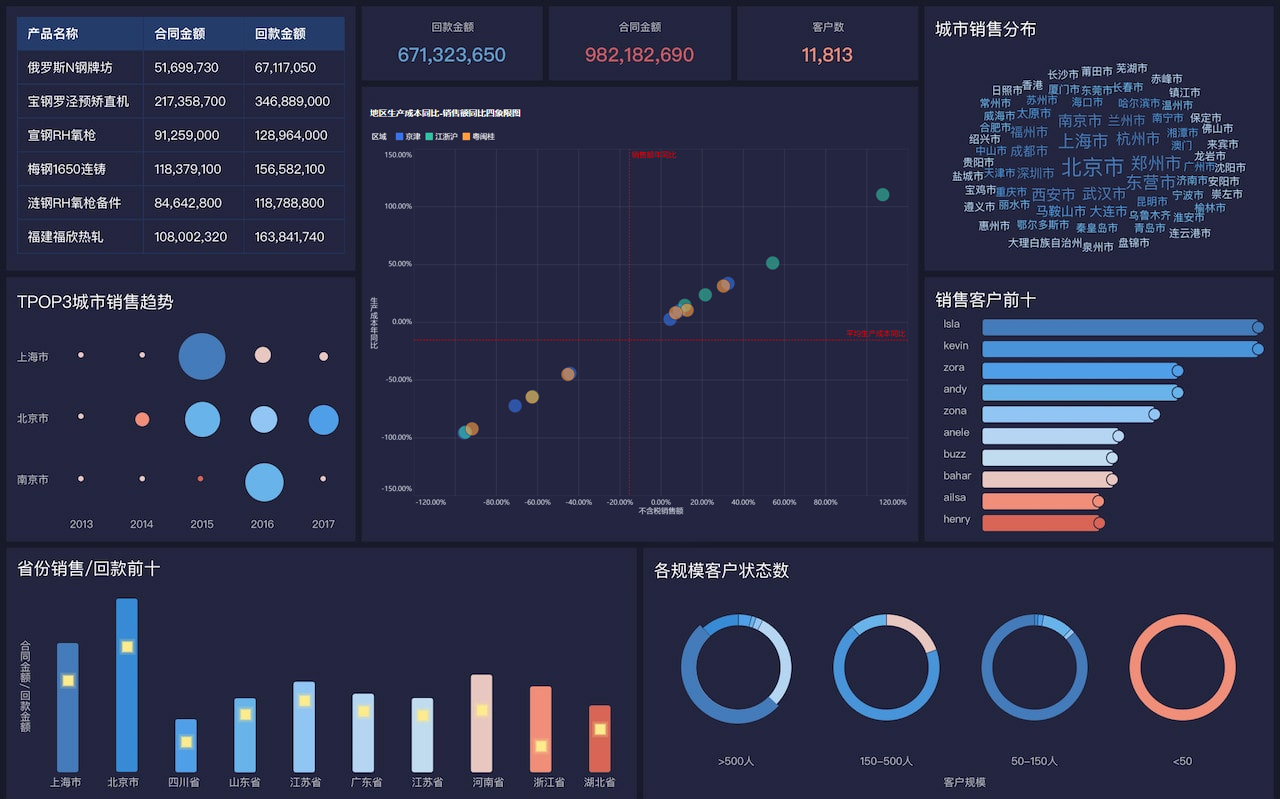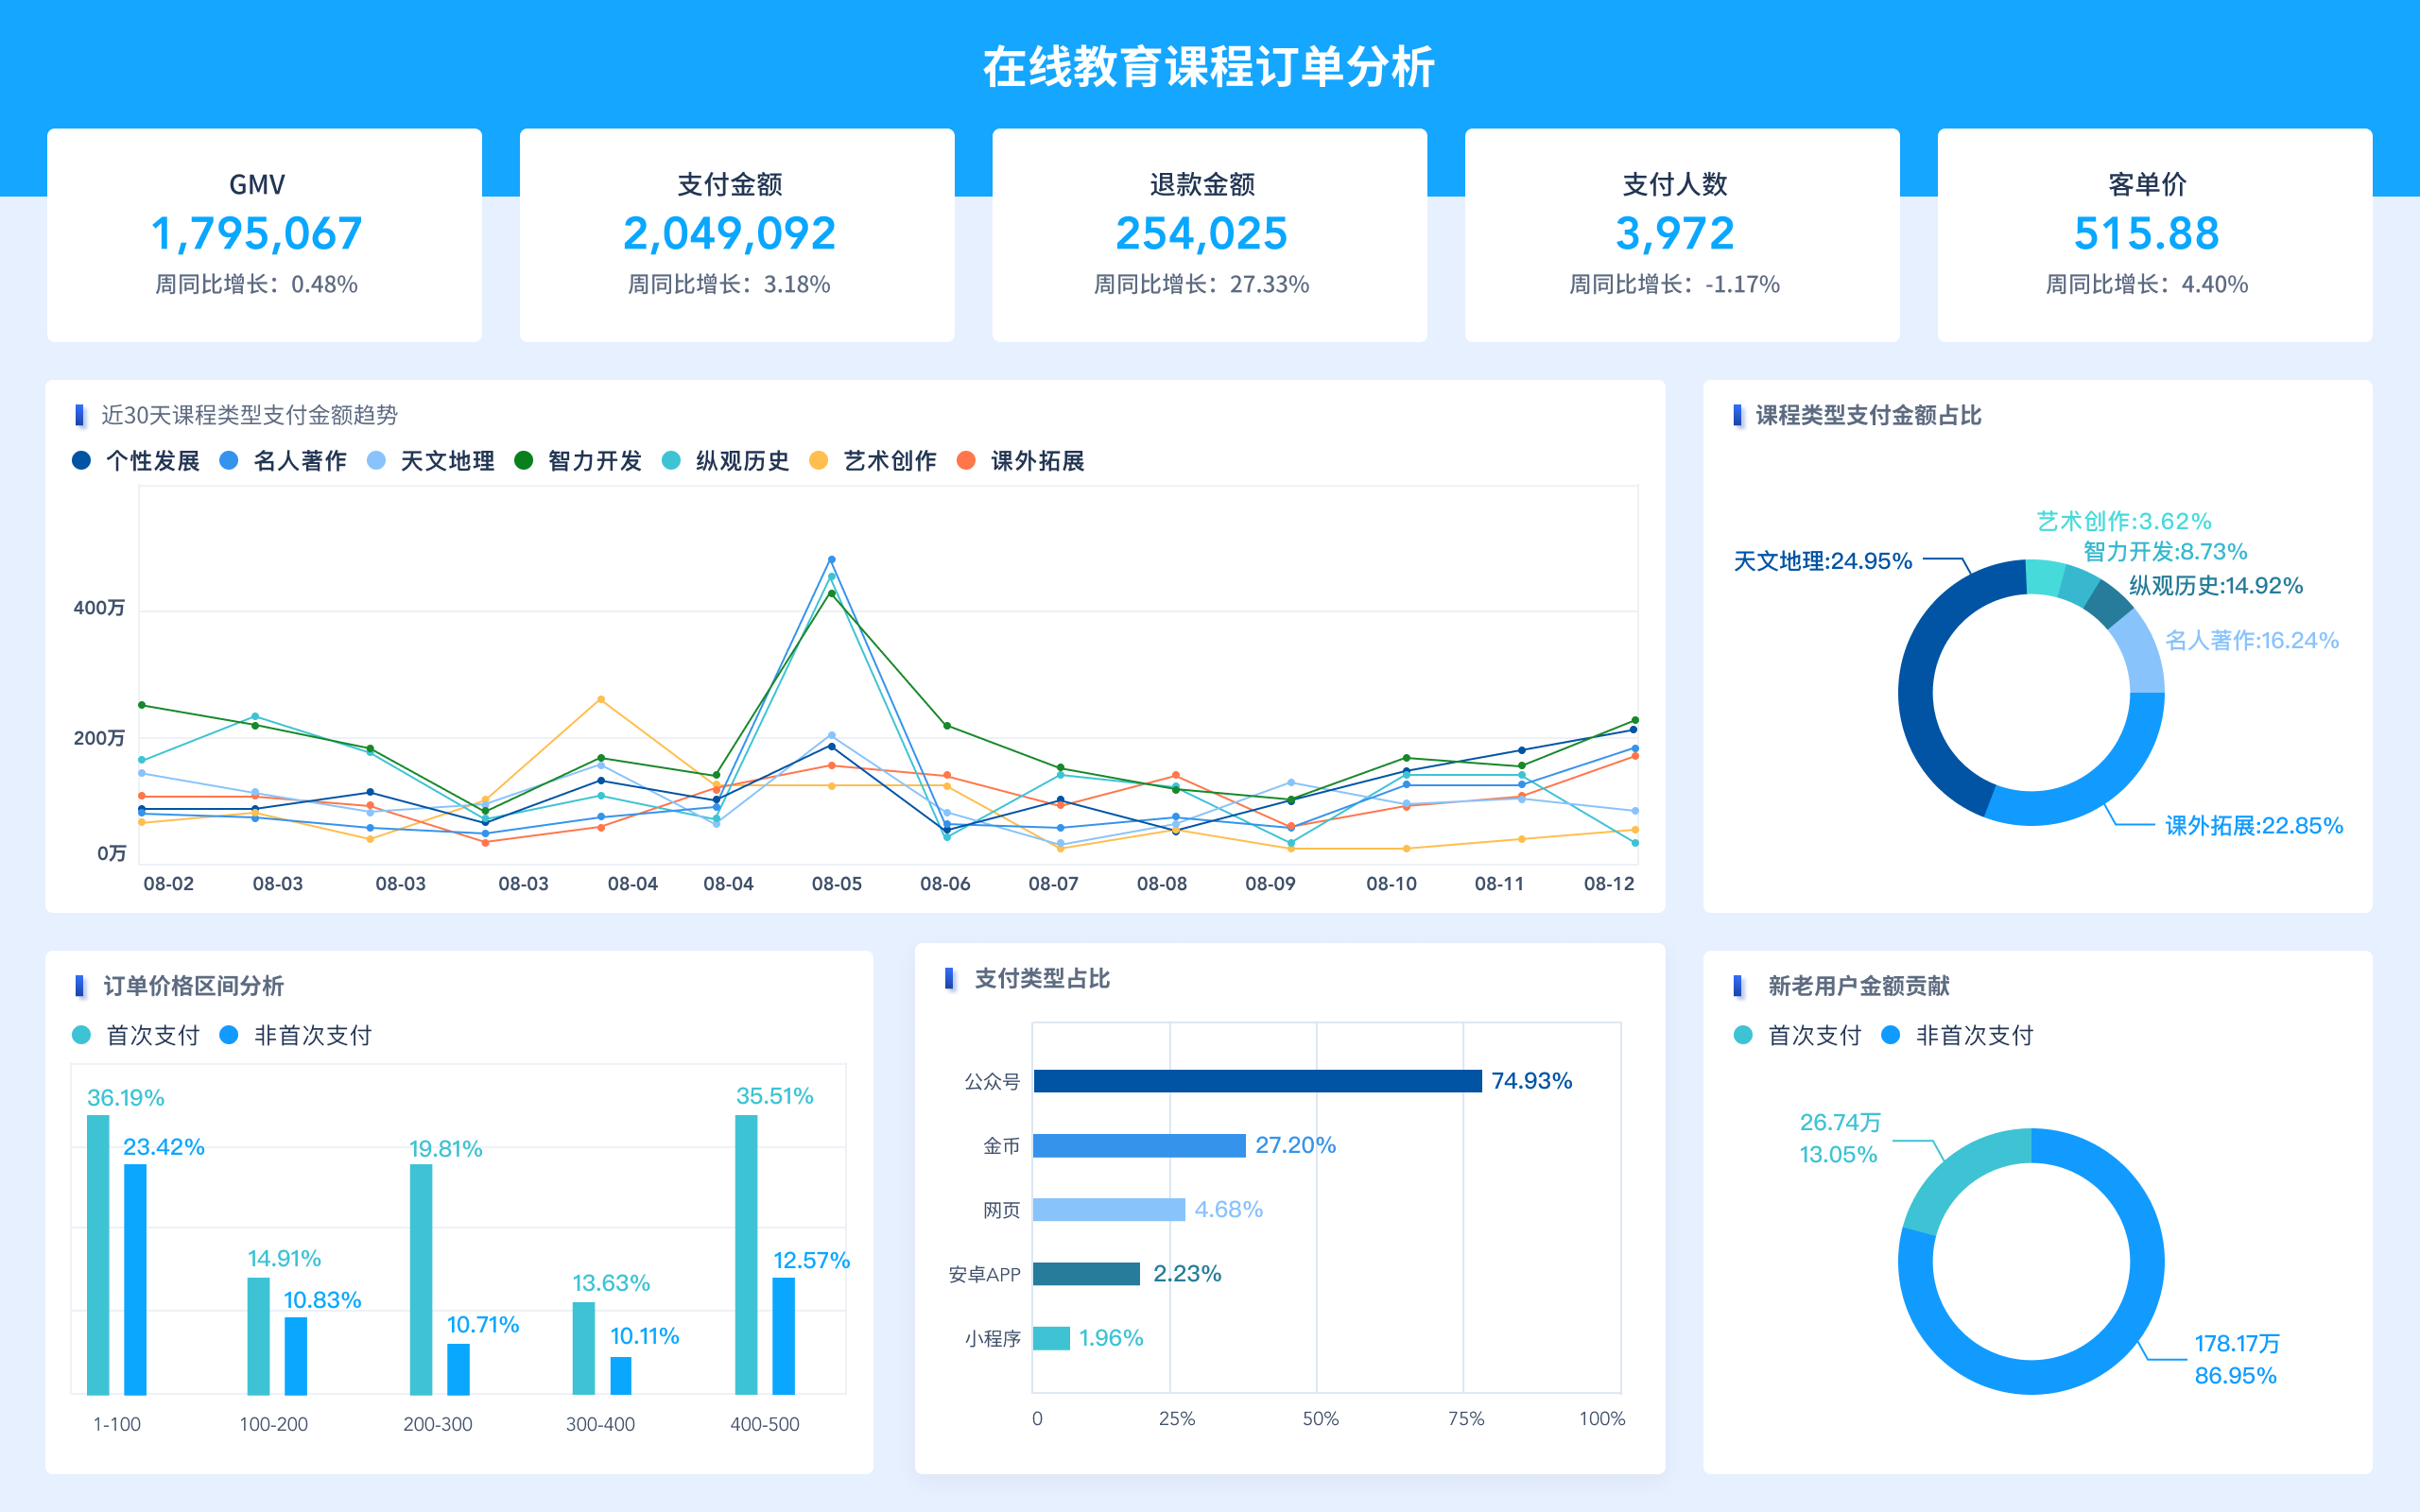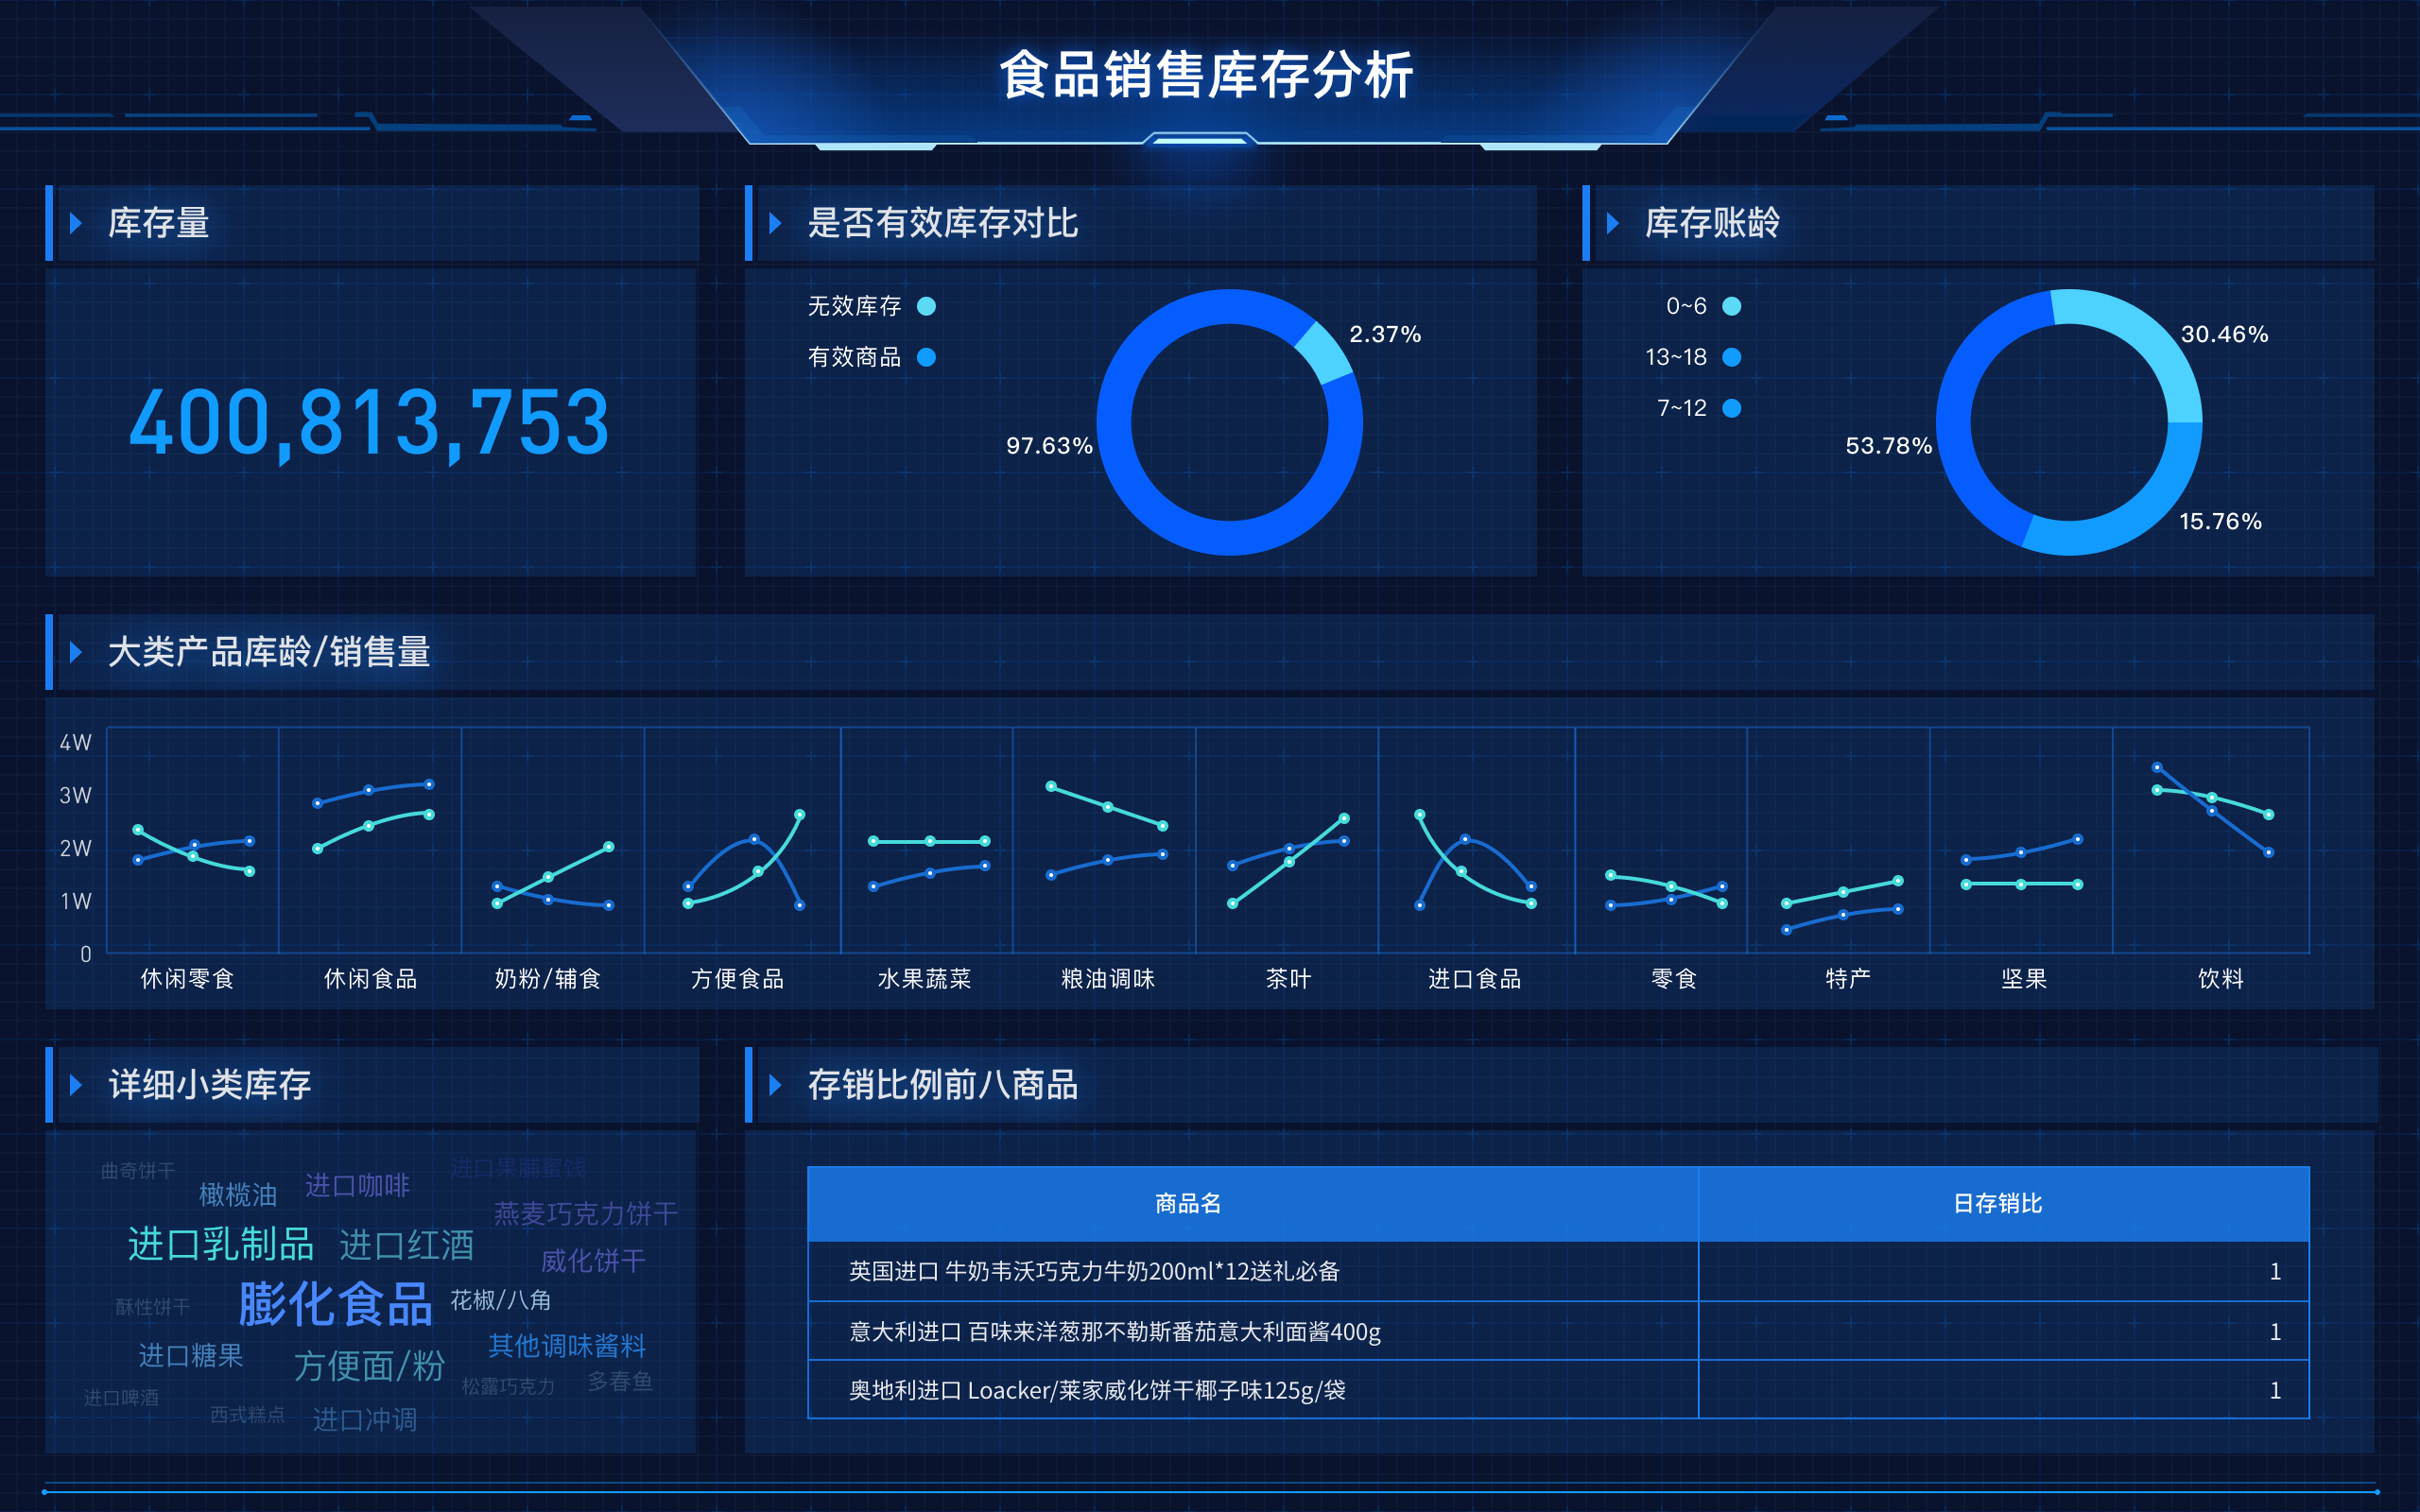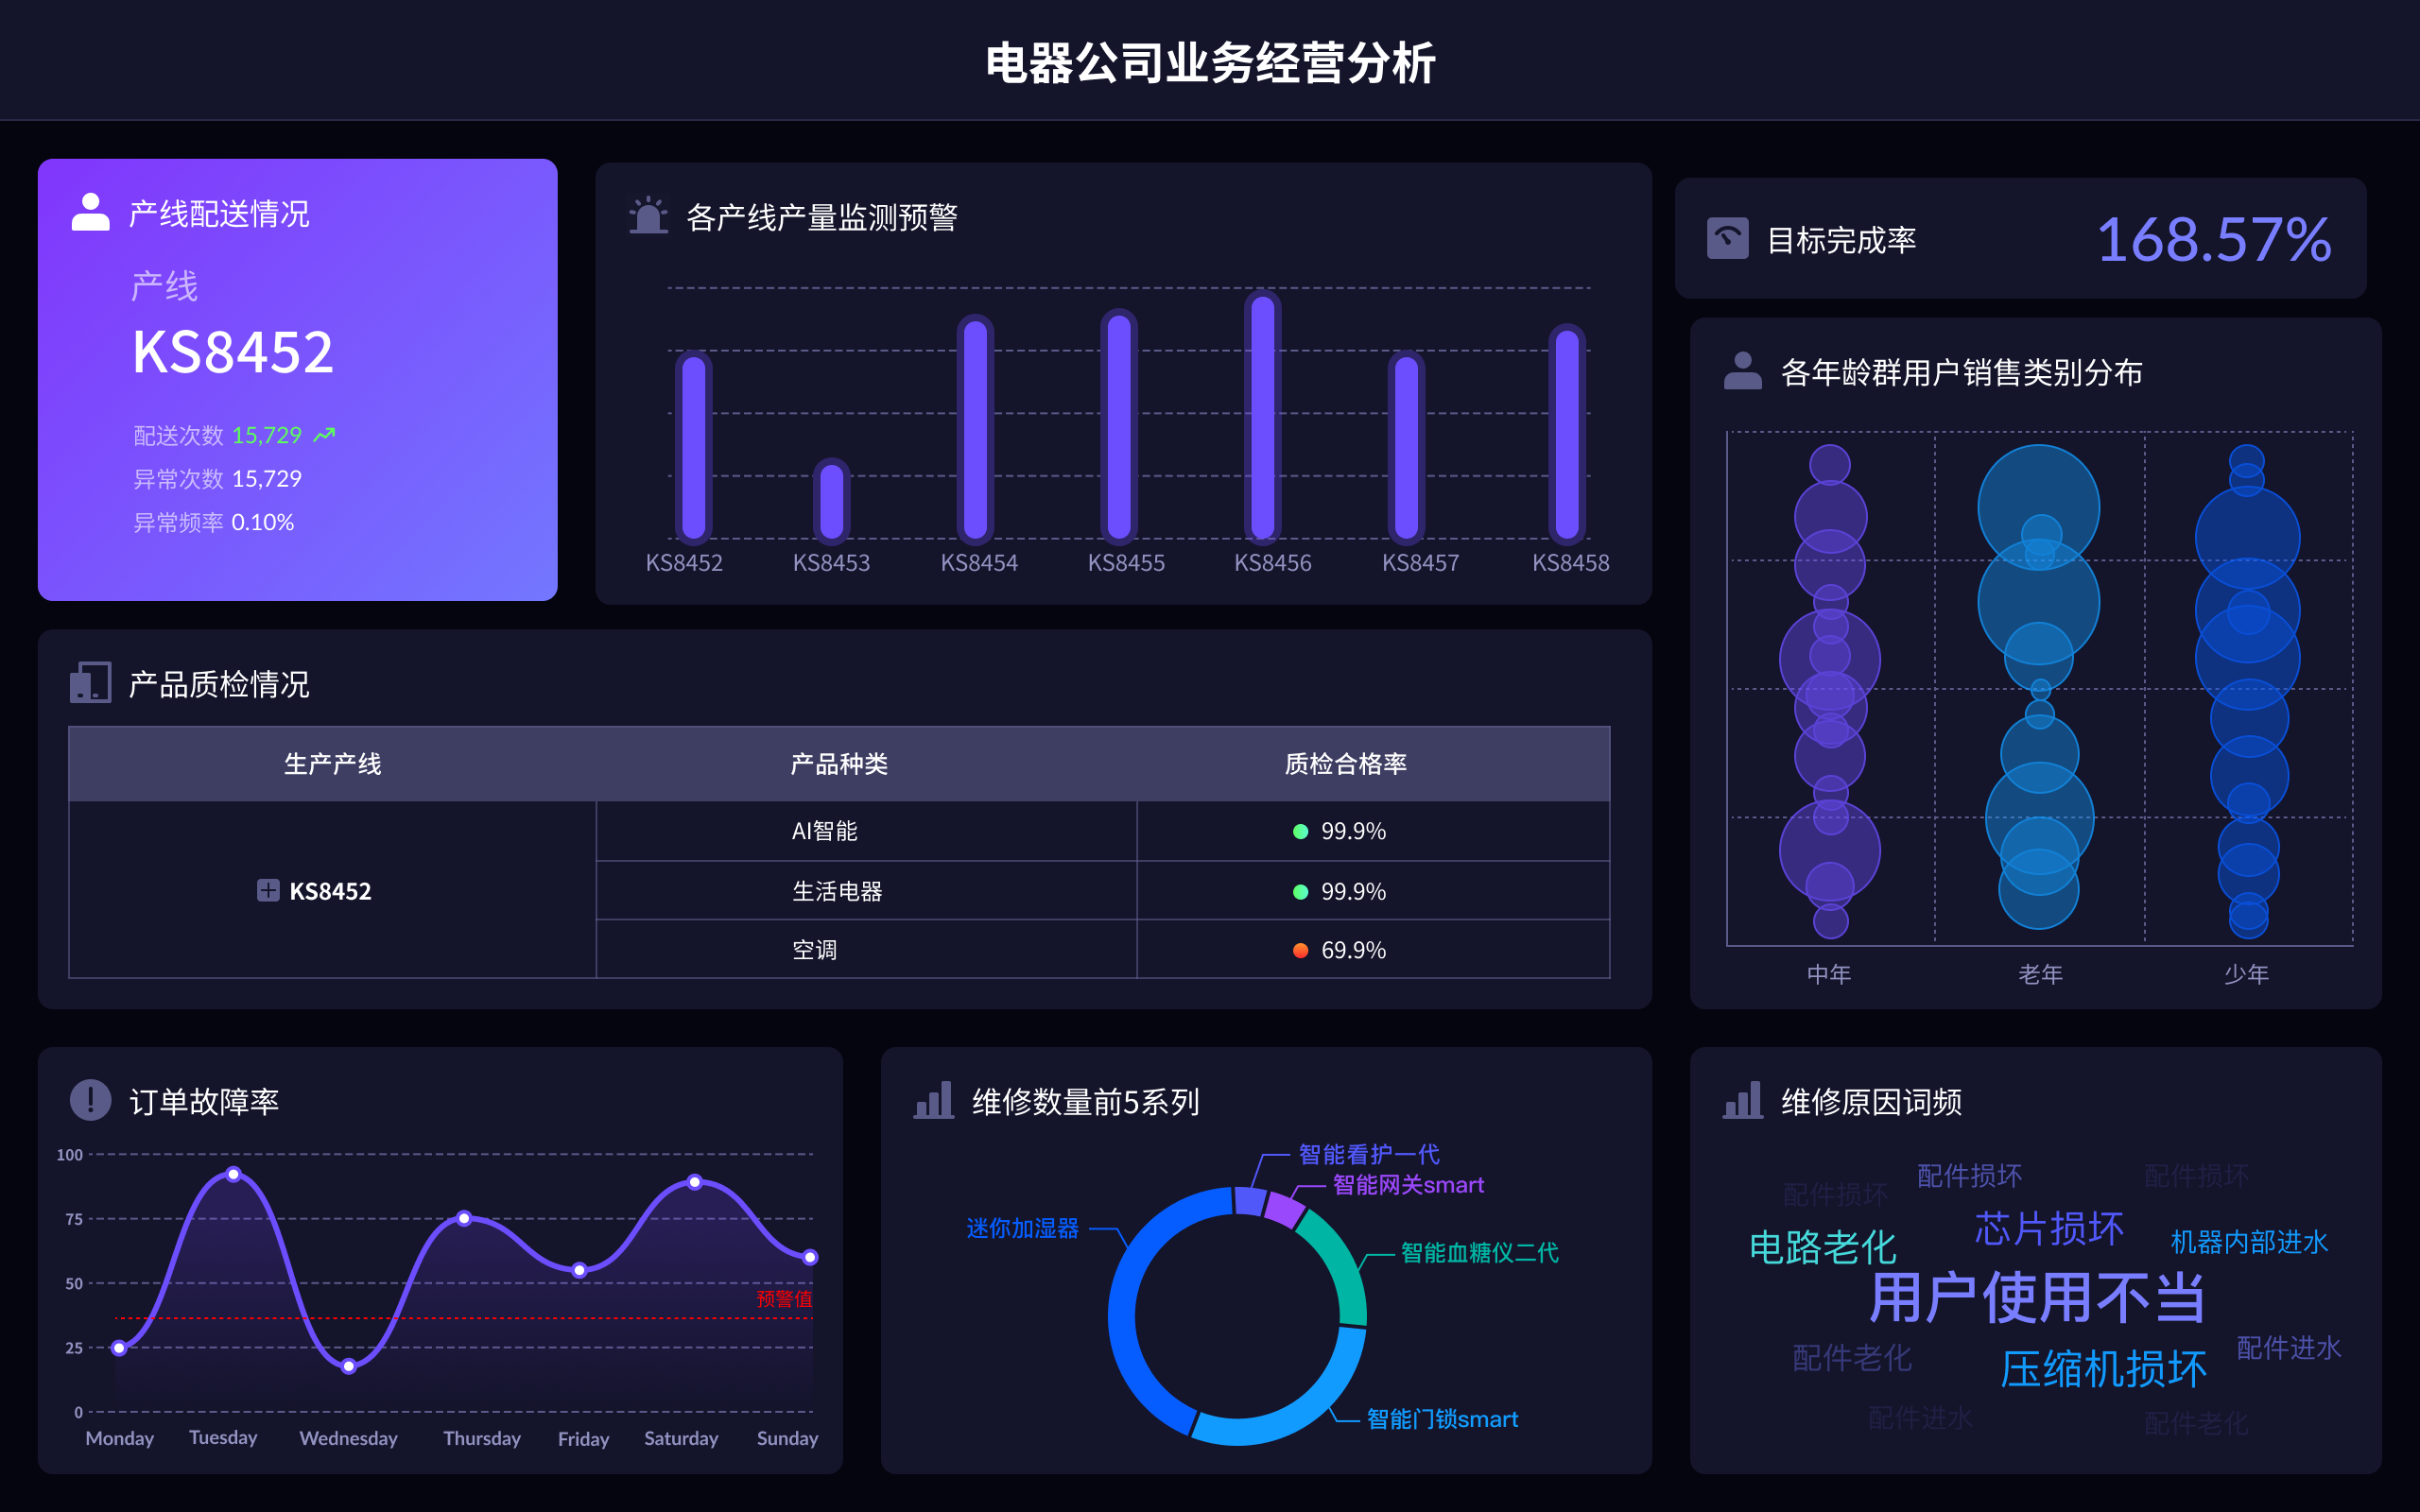
The English abbreviation for big data visualization is BDV. This abbreviation stands for Big Data Visualization, which is the process of representing large and complex datasets in a visual format, making it easier to identify patterns, trends, and insights.
I. DEFINITION AND IMPORTANCE OF BDV
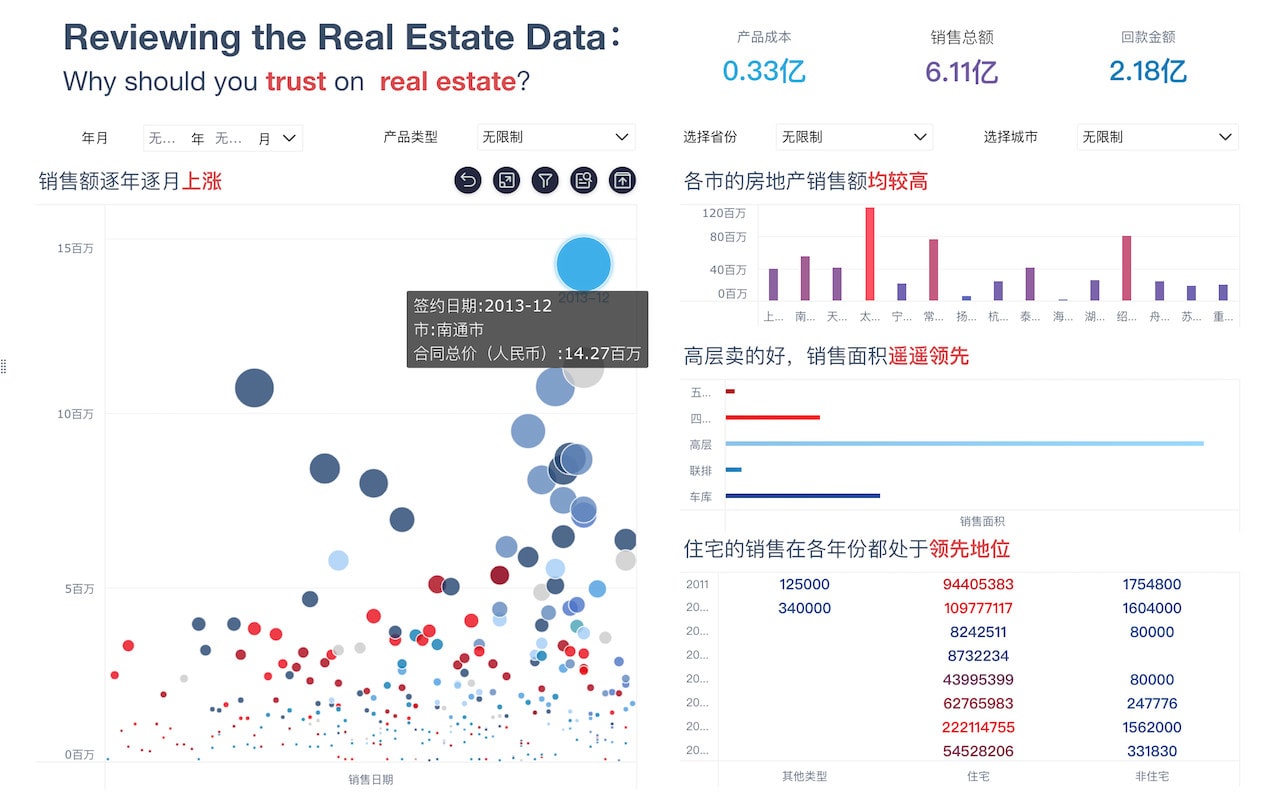
Big Data Visualization (BDV) is essential in today's data-driven world. It involves using graphical representations to explore and understand large datasets. These visual formats can include charts, graphs, maps, and other visual tools that help to make sense of the vast amount of data generated every day. The primary goal of BDV is to make data more accessible and comprehensible, allowing stakeholders to make informed decisions quickly. Effective BDV can reveal hidden patterns, correlations, and insights that might be missed with traditional data analysis methods.
II. KEY COMPONENTS OF BDV
Several critical components contribute to successful Big Data Visualization:
-
Data Sources: Data must be collected from various sources such as databases, social media, sensors, and other data-generating systems. The quality and diversity of these data sources significantly impact the effectiveness of BDV.
-
Data Processing: Before visualization, data needs to be cleaned, transformed, and aggregated. This step ensures that the data is accurate and in a format suitable for visualization.
-
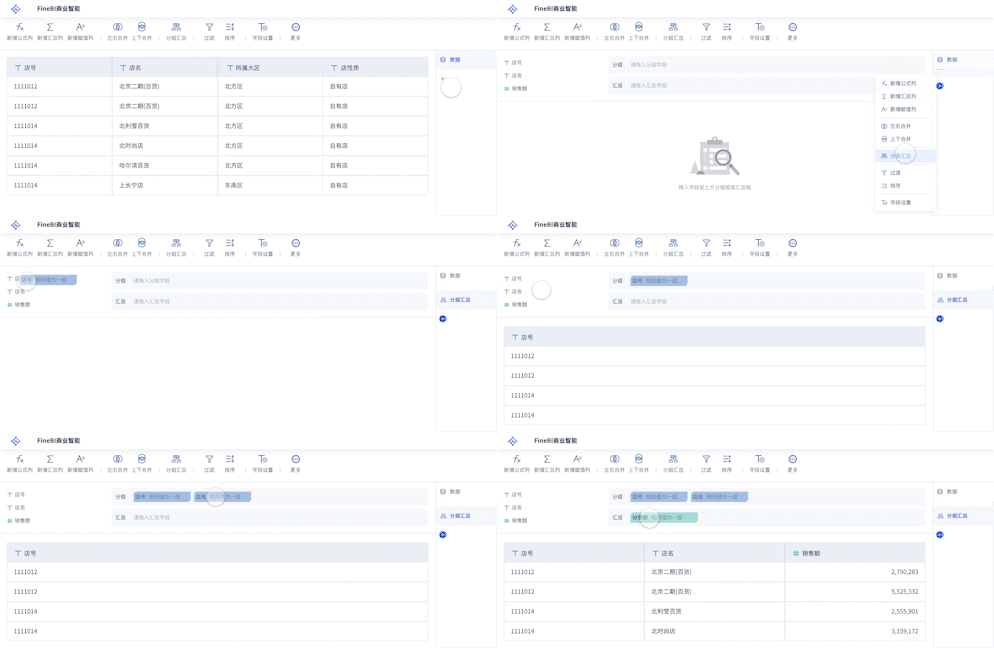
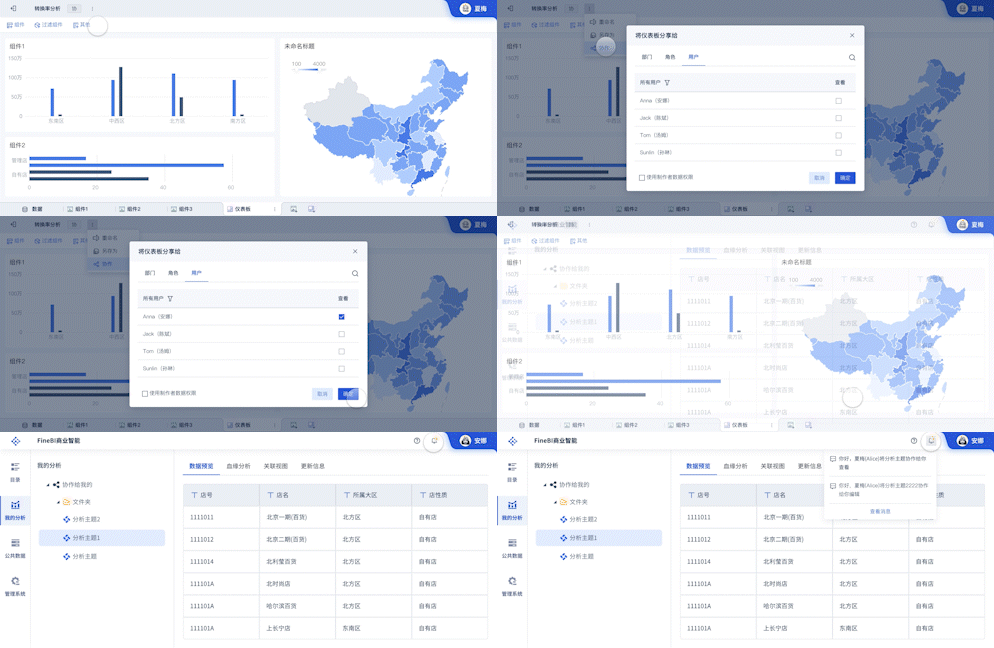
Visualization Tools: Tools like FineBI, FineReport, and FineVis are crucial for creating visualizations. These tools offer a range of features and functionalities that help users build interactive and informative visualizations.
-
User Interface: The design and usability of the visualization interface are critical. It should be intuitive and easy to navigate, allowing users to interact with and explore the data effortlessly.
-
Analytics: Incorporating analytics into BDV helps in deriving deeper insights. Advanced analytics techniques such as machine learning and statistical analysis can be integrated to enhance the visualization process.
III. TOOLS FOR BDV
-
FineBI: A self-service business intelligence tool that enables users to create interactive dashboards and reports. It supports a wide range of data sources and offers powerful data visualization capabilities. FineBI is user-friendly, making it accessible for users without a technical background. FineBI website
-
FineReport: This tool focuses on enterprise-level reporting. It allows users to design complex reports with ease and supports dynamic data sources. FineReport is ideal for organizations that require detailed and customizable reporting solutions. FineReport website
-
FineVis: A specialized tool for data visualization that emphasizes simplicity and effectiveness. It helps users create stunning visual representations of their data. FineVis is perfect for users who need to visualize large datasets quickly and efficiently. FineVis website
IV. APPLICATIONS OF BDV
Big Data Visualization is applied across various industries, each with unique requirements and benefits:
-
Healthcare: BDV helps in monitoring patient data, tracking disease outbreaks, and managing healthcare resources. Visualizing patient records and medical data can lead to better diagnosis and treatment plans.
-
Finance: In finance, BDV is used for market analysis, risk management, and fraud detection. Financial institutions rely on visualizations to understand market trends and make investment decisions.
-
Retail: Retailers use BDV to analyze consumer behavior, optimize inventory, and enhance customer experiences. Visualizing sales data can help identify purchasing patterns and improve marketing strategies.
-
Manufacturing: BDV aids in monitoring production processes, ensuring quality control, and managing supply chains. Visual dashboards can provide real-time insights into manufacturing operations.
V. CHALLENGES IN BDV
Despite its benefits, BDV faces several challenges:
-
Data Quality: Inaccurate or incomplete data can lead to misleading visualizations. Ensuring data quality is a significant challenge.
-
Scalability: As data volume grows, managing and visualizing large datasets becomes more complex. Scalable solutions are needed to handle big data effectively.
-
User Training: Users need to understand how to interpret and interact with visualizations. Proper training and support are essential to maximize the benefits of BDV.
-
Security and Privacy: Protecting sensitive data while visualizing it is crucial. Implementing robust security measures is vital to prevent data breaches.
VI. FUTURE TRENDS IN BDV
The field of Big Data Visualization is continuously evolving. Future trends include:
-
AI and Machine Learning Integration: AI-driven visualizations will become more prevalent, providing deeper insights and automating the data analysis process.
-
Enhanced Interactivity: Future tools will offer more interactive features, allowing users to explore data more dynamically.
-
Virtual and Augmented Reality: VR and AR technologies will revolutionize how we visualize and interact with big data.
-
Real-Time Data Visualization: The demand for real-time insights will drive the development of tools capable of visualizing live data streams.
In conclusion, Big Data Visualization (BDV) is an essential tool for extracting insights from large datasets. By leveraging tools like FineBI, FineReport, and FineVis, organizations can make data-driven decisions, enhance operational efficiency, and gain a competitive edge. However, to fully harness the power of BDV, it's crucial to address challenges related to data quality, scalability, user training, and security. The future of BDV looks promising, with advancements in AI, interactivity, and immersive technologies set to transform how we visualize and understand big data.
相关问答FAQs:
FAQ 1: What is the abbreviation for Big Data Visualization?
Big Data Visualization is commonly abbreviated as BDV. This abbreviation is used in various contexts to denote the graphical representation and analysis of large and complex data sets. BDV helps in transforming raw data into visual formats such as charts, graphs, and dashboards, making it easier for users to interpret and gain insights from vast amounts of information. In professional settings, BDV is crucial for data analysts, business intelligence experts, and anyone involved in data-driven decision-making processes.
FAQ 2: How is BDV used in data analysis and decision-making?
The abbreviation BDV, or Big Data Visualization, plays a pivotal role in data analysis and decision-making by providing a clear and interactive way to explore and understand large data sets. By converting data into visual formats, BDV tools enable users to identify trends, patterns, and anomalies that might be difficult to discern from raw data alone. This enhanced visibility supports informed decision-making, allowing businesses to make strategic choices based on comprehensive insights. BDV is instrumental in various industries, including finance, healthcare, and marketing, where data-driven decisions are critical to success.
FAQ 3: What are some popular tools used for BDV?
There are several popular tools and software solutions available for Big Data Visualization (BDV) that cater to different needs and preferences. Some widely recognized tools include:
- Tableau: Renowned for its user-friendly interface and powerful data visualization capabilities, Tableau allows users to create interactive dashboards and reports with ease.
- Power BI: Developed by Microsoft, Power BI offers robust features for visualizing and analyzing data, with seamless integration into Microsoft products and services.
- QlikView/Qlik Sense: These tools provide a range of visualization options and are known for their associative data model, which helps in exploring data from multiple perspectives.
These tools support various types of visualizations, including bar charts, line graphs, heat maps, and geographic maps, enabling users to tailor their data presentations to their specific needs and preferences.
本文内容通过AI工具匹配关键字智能整合而成,仅供参考,帆软不对内容的真实、准确或完整作任何形式的承诺。具体产品功能请以帆软官方帮助文档为准,或联系您的对接销售进行咨询。如有其他问题,您可以通过联系blog@fanruan.com进行反馈,帆软收到您的反馈后将及时答复和处理。


