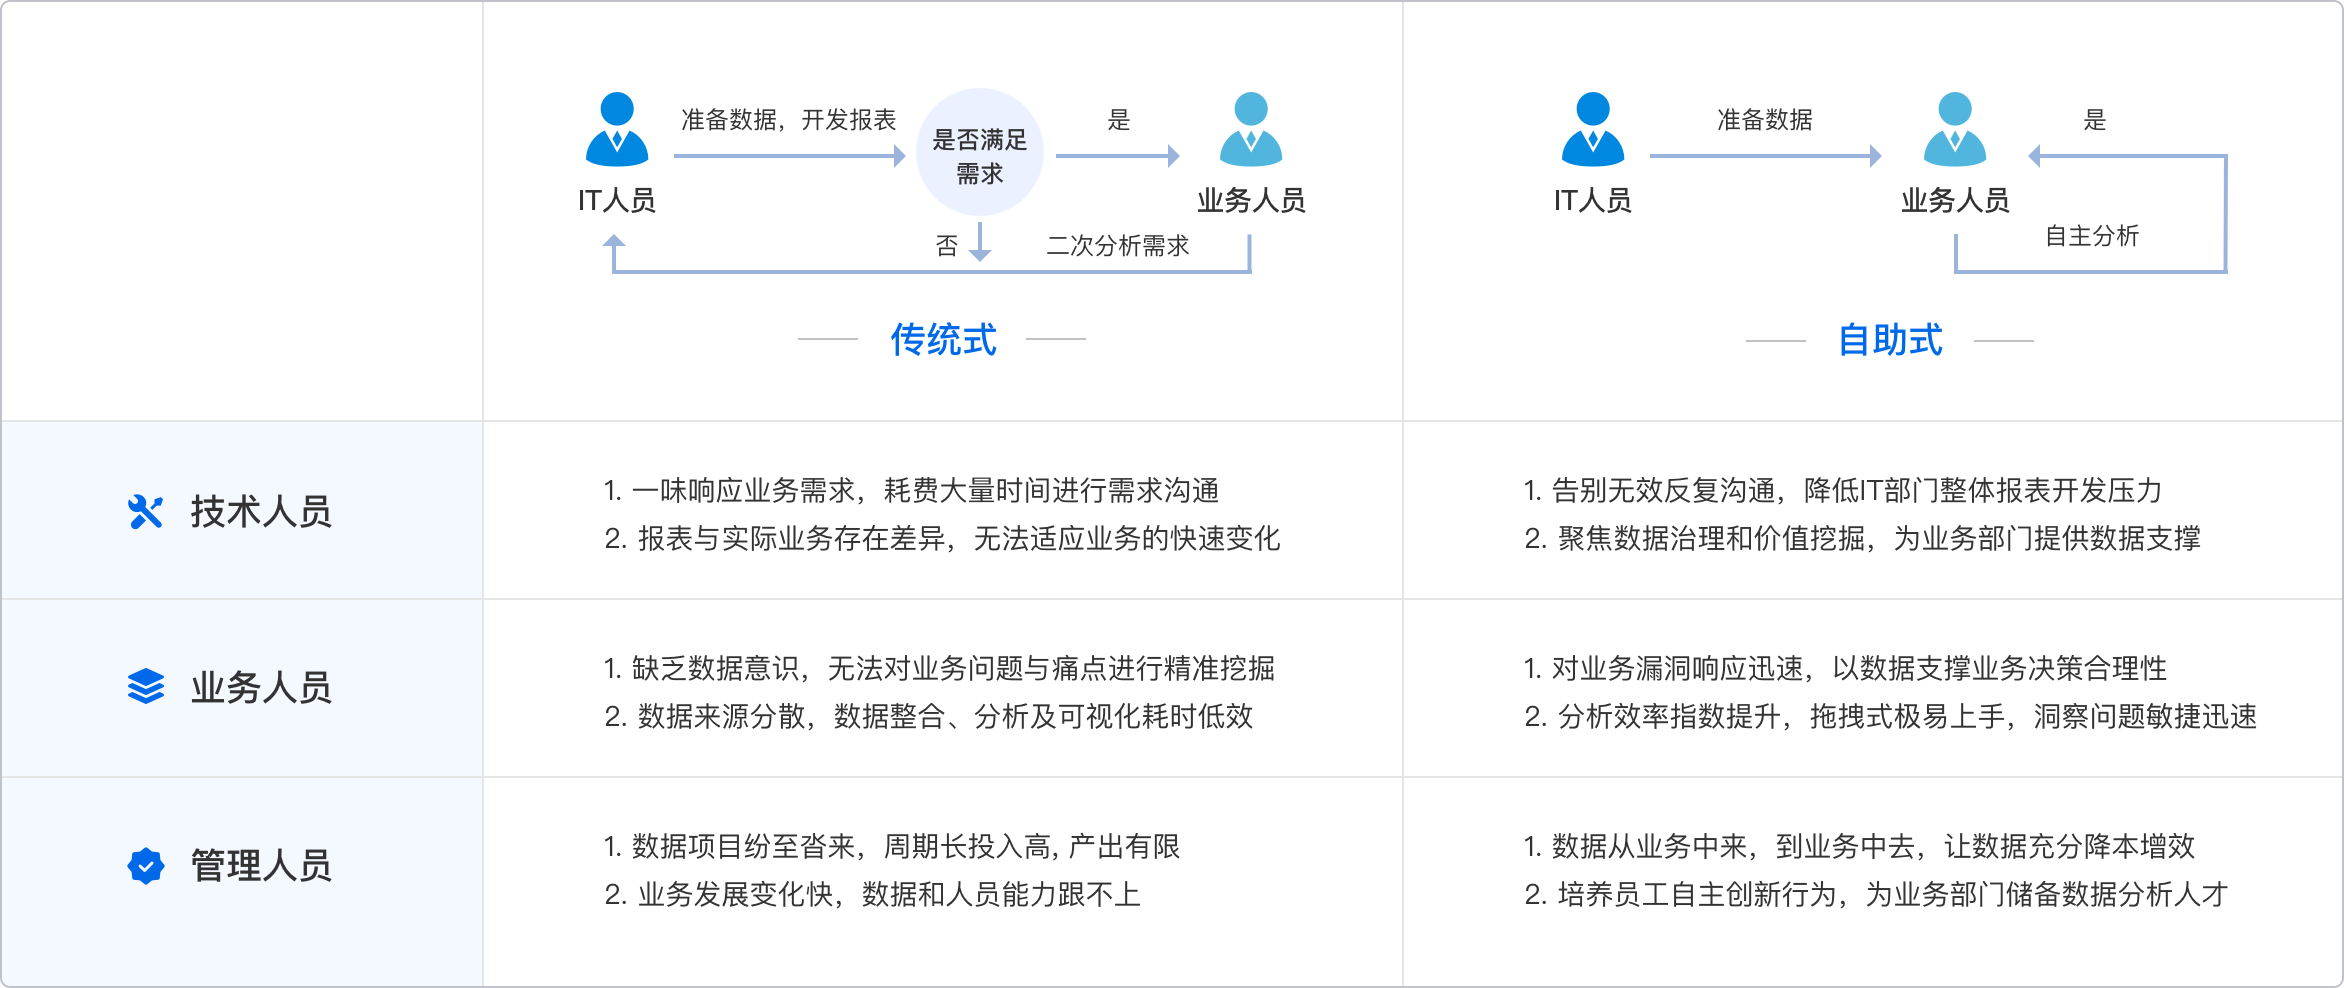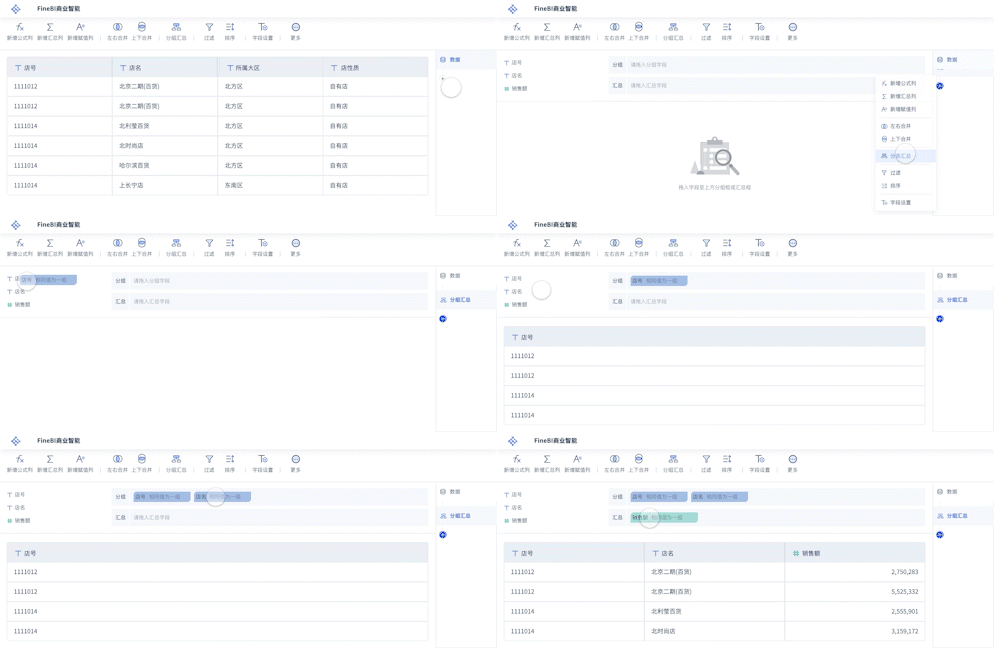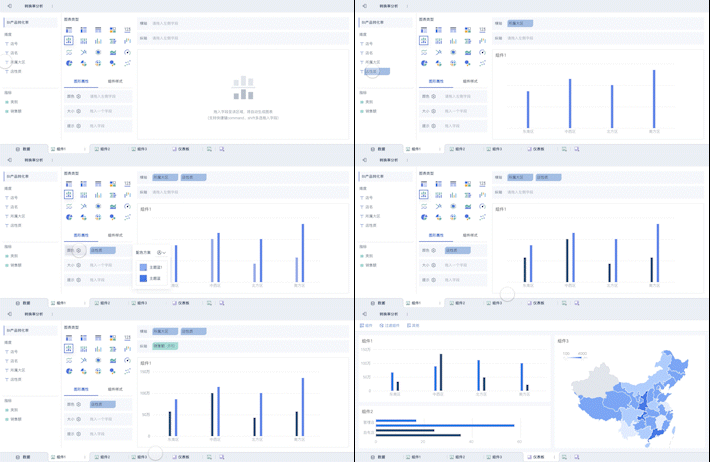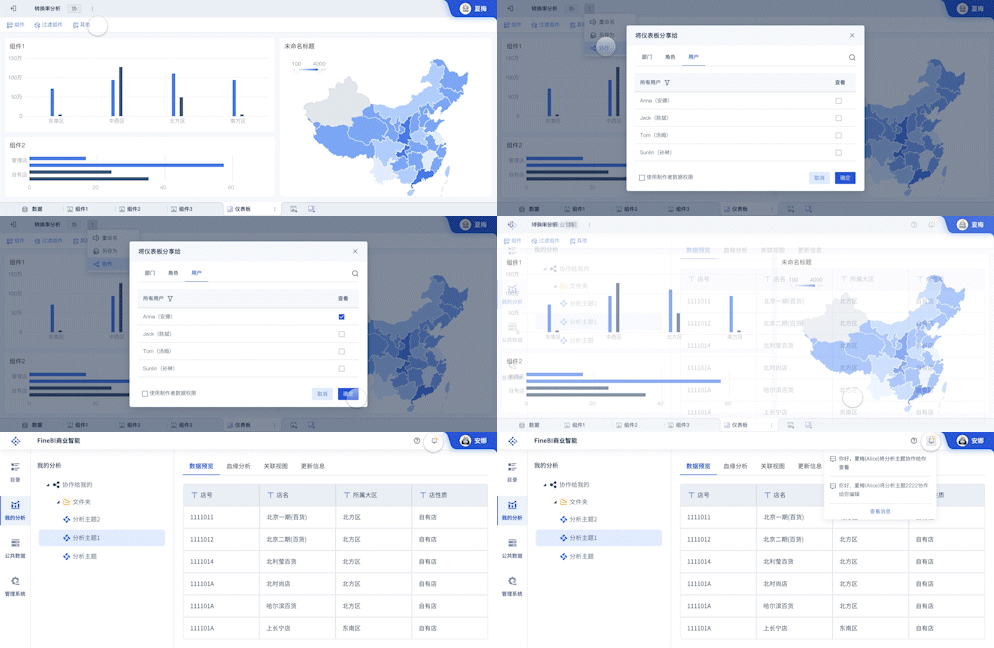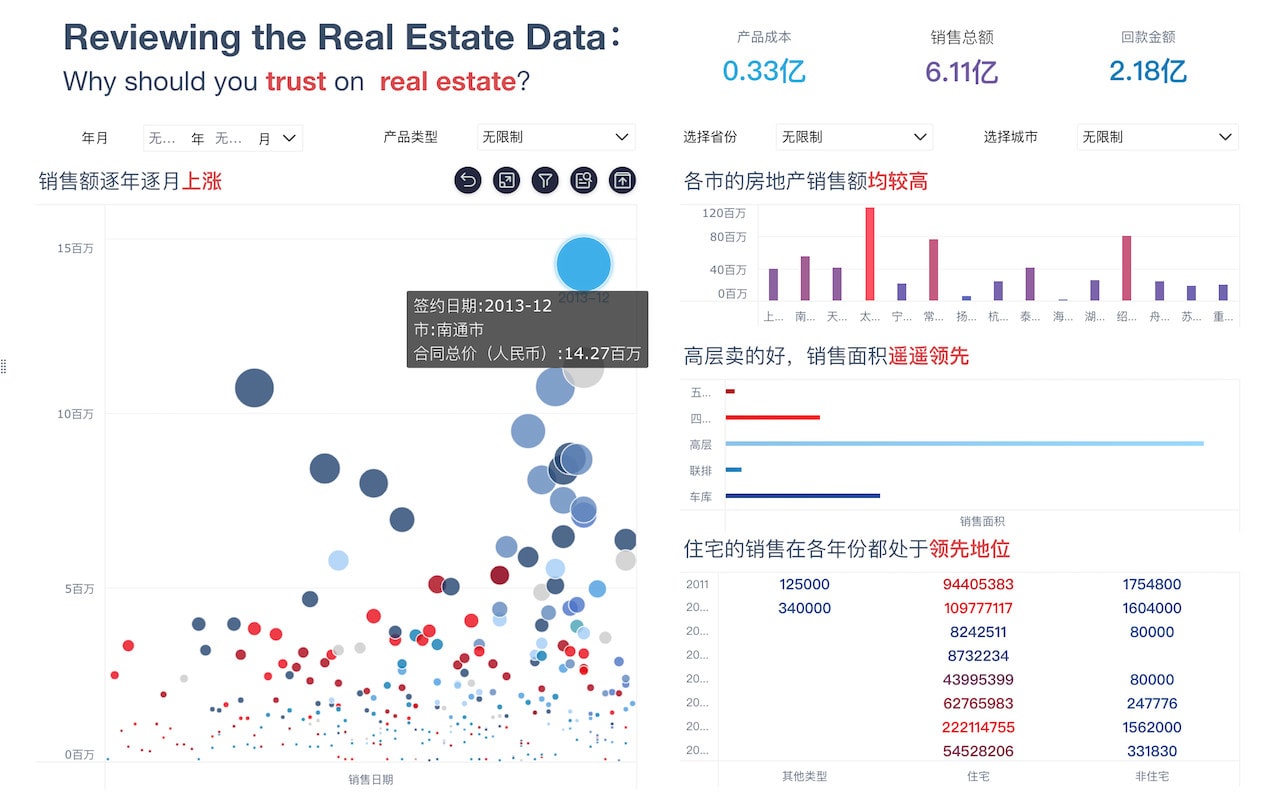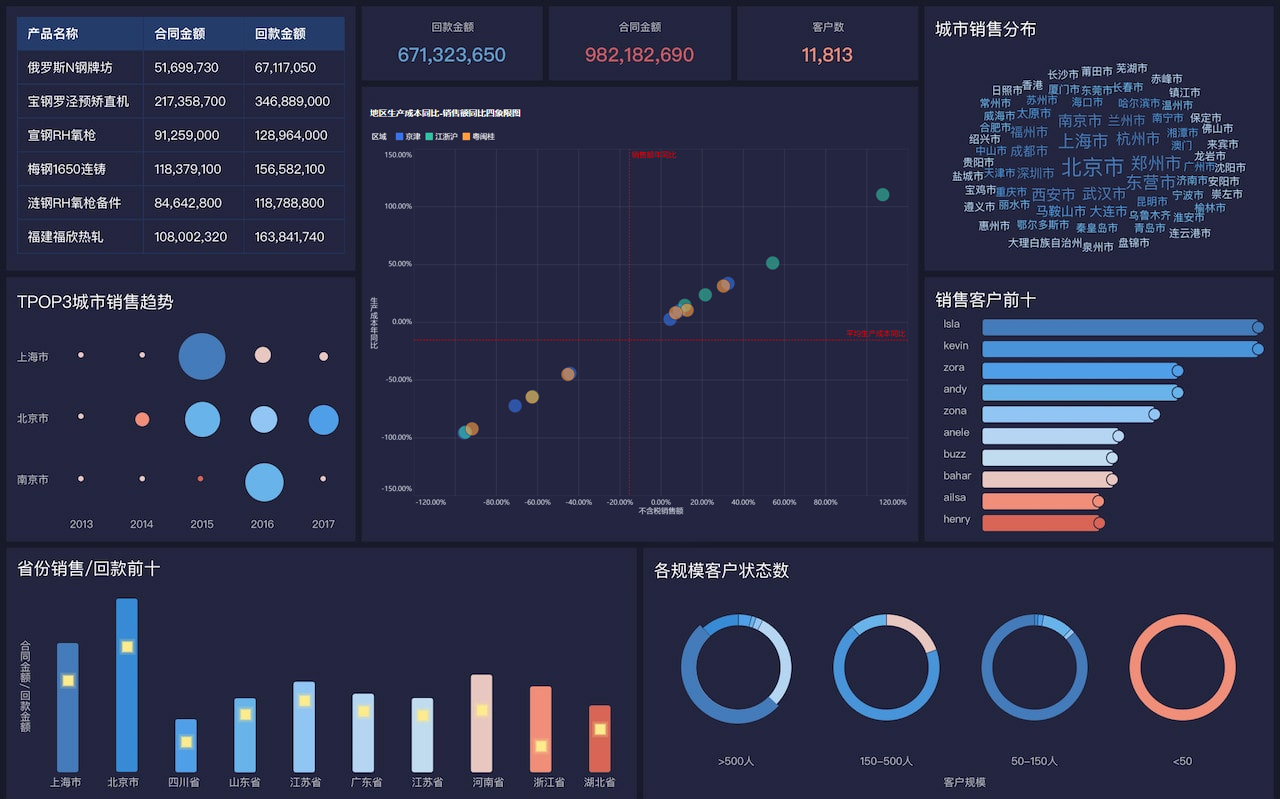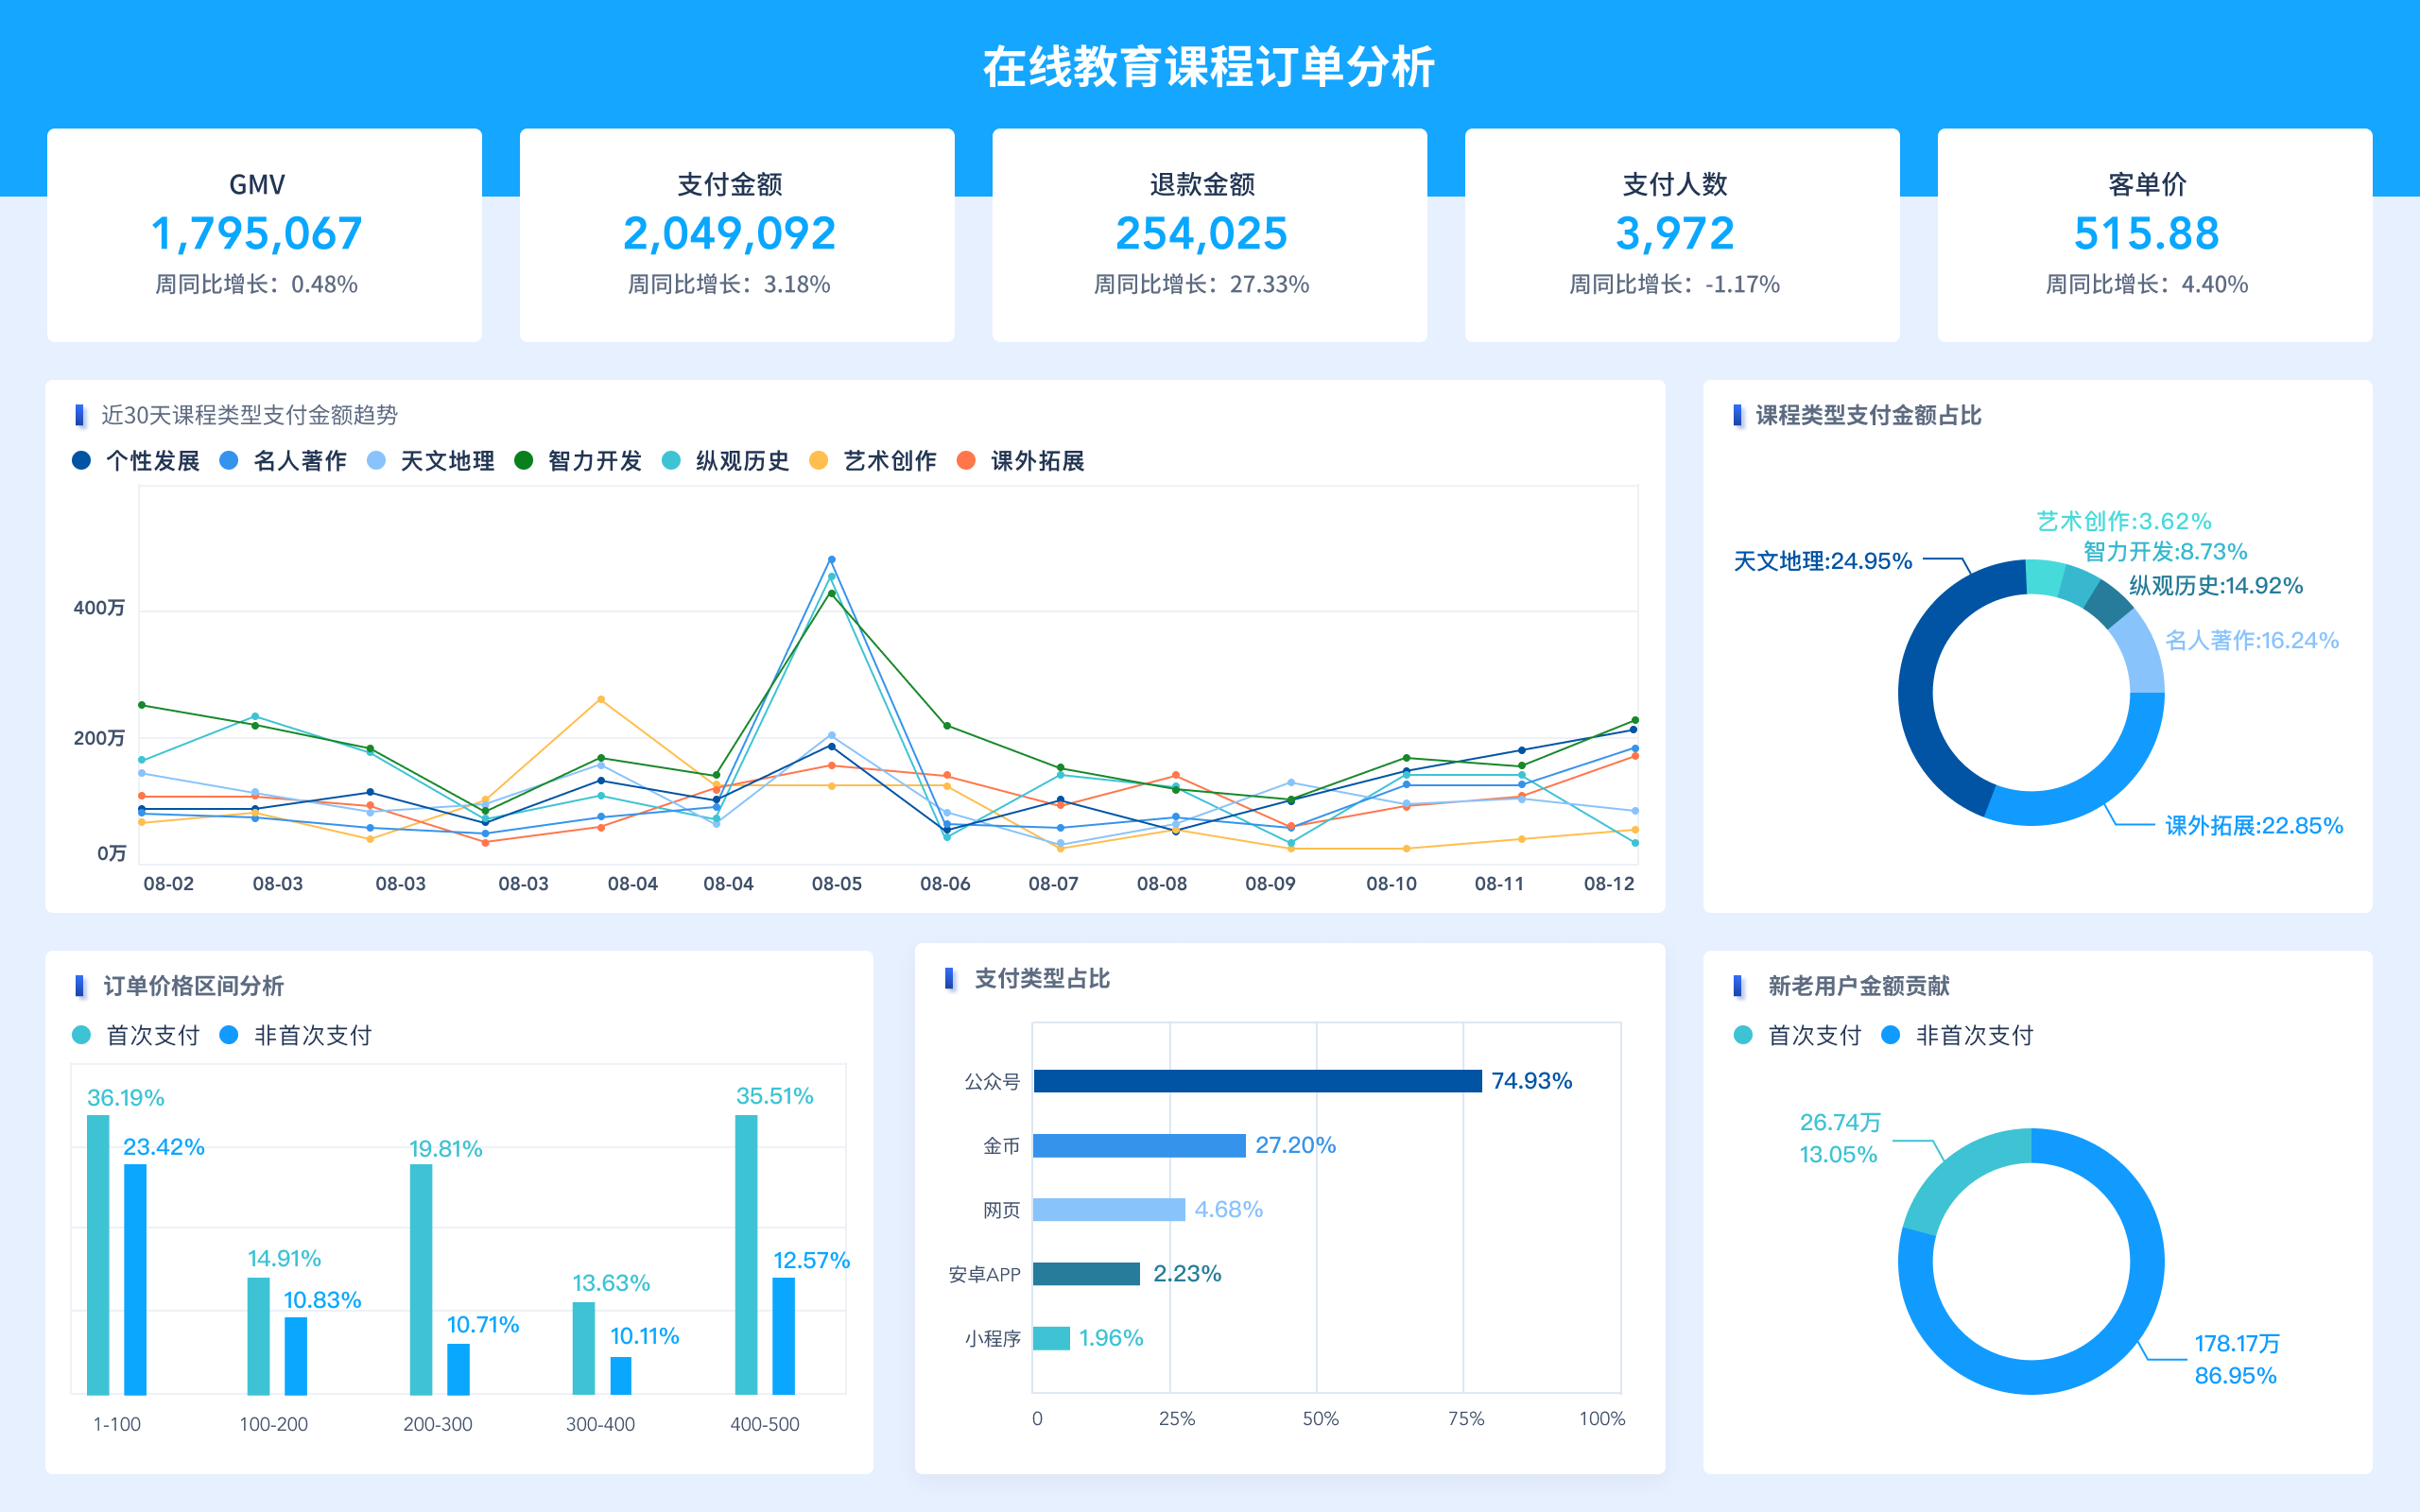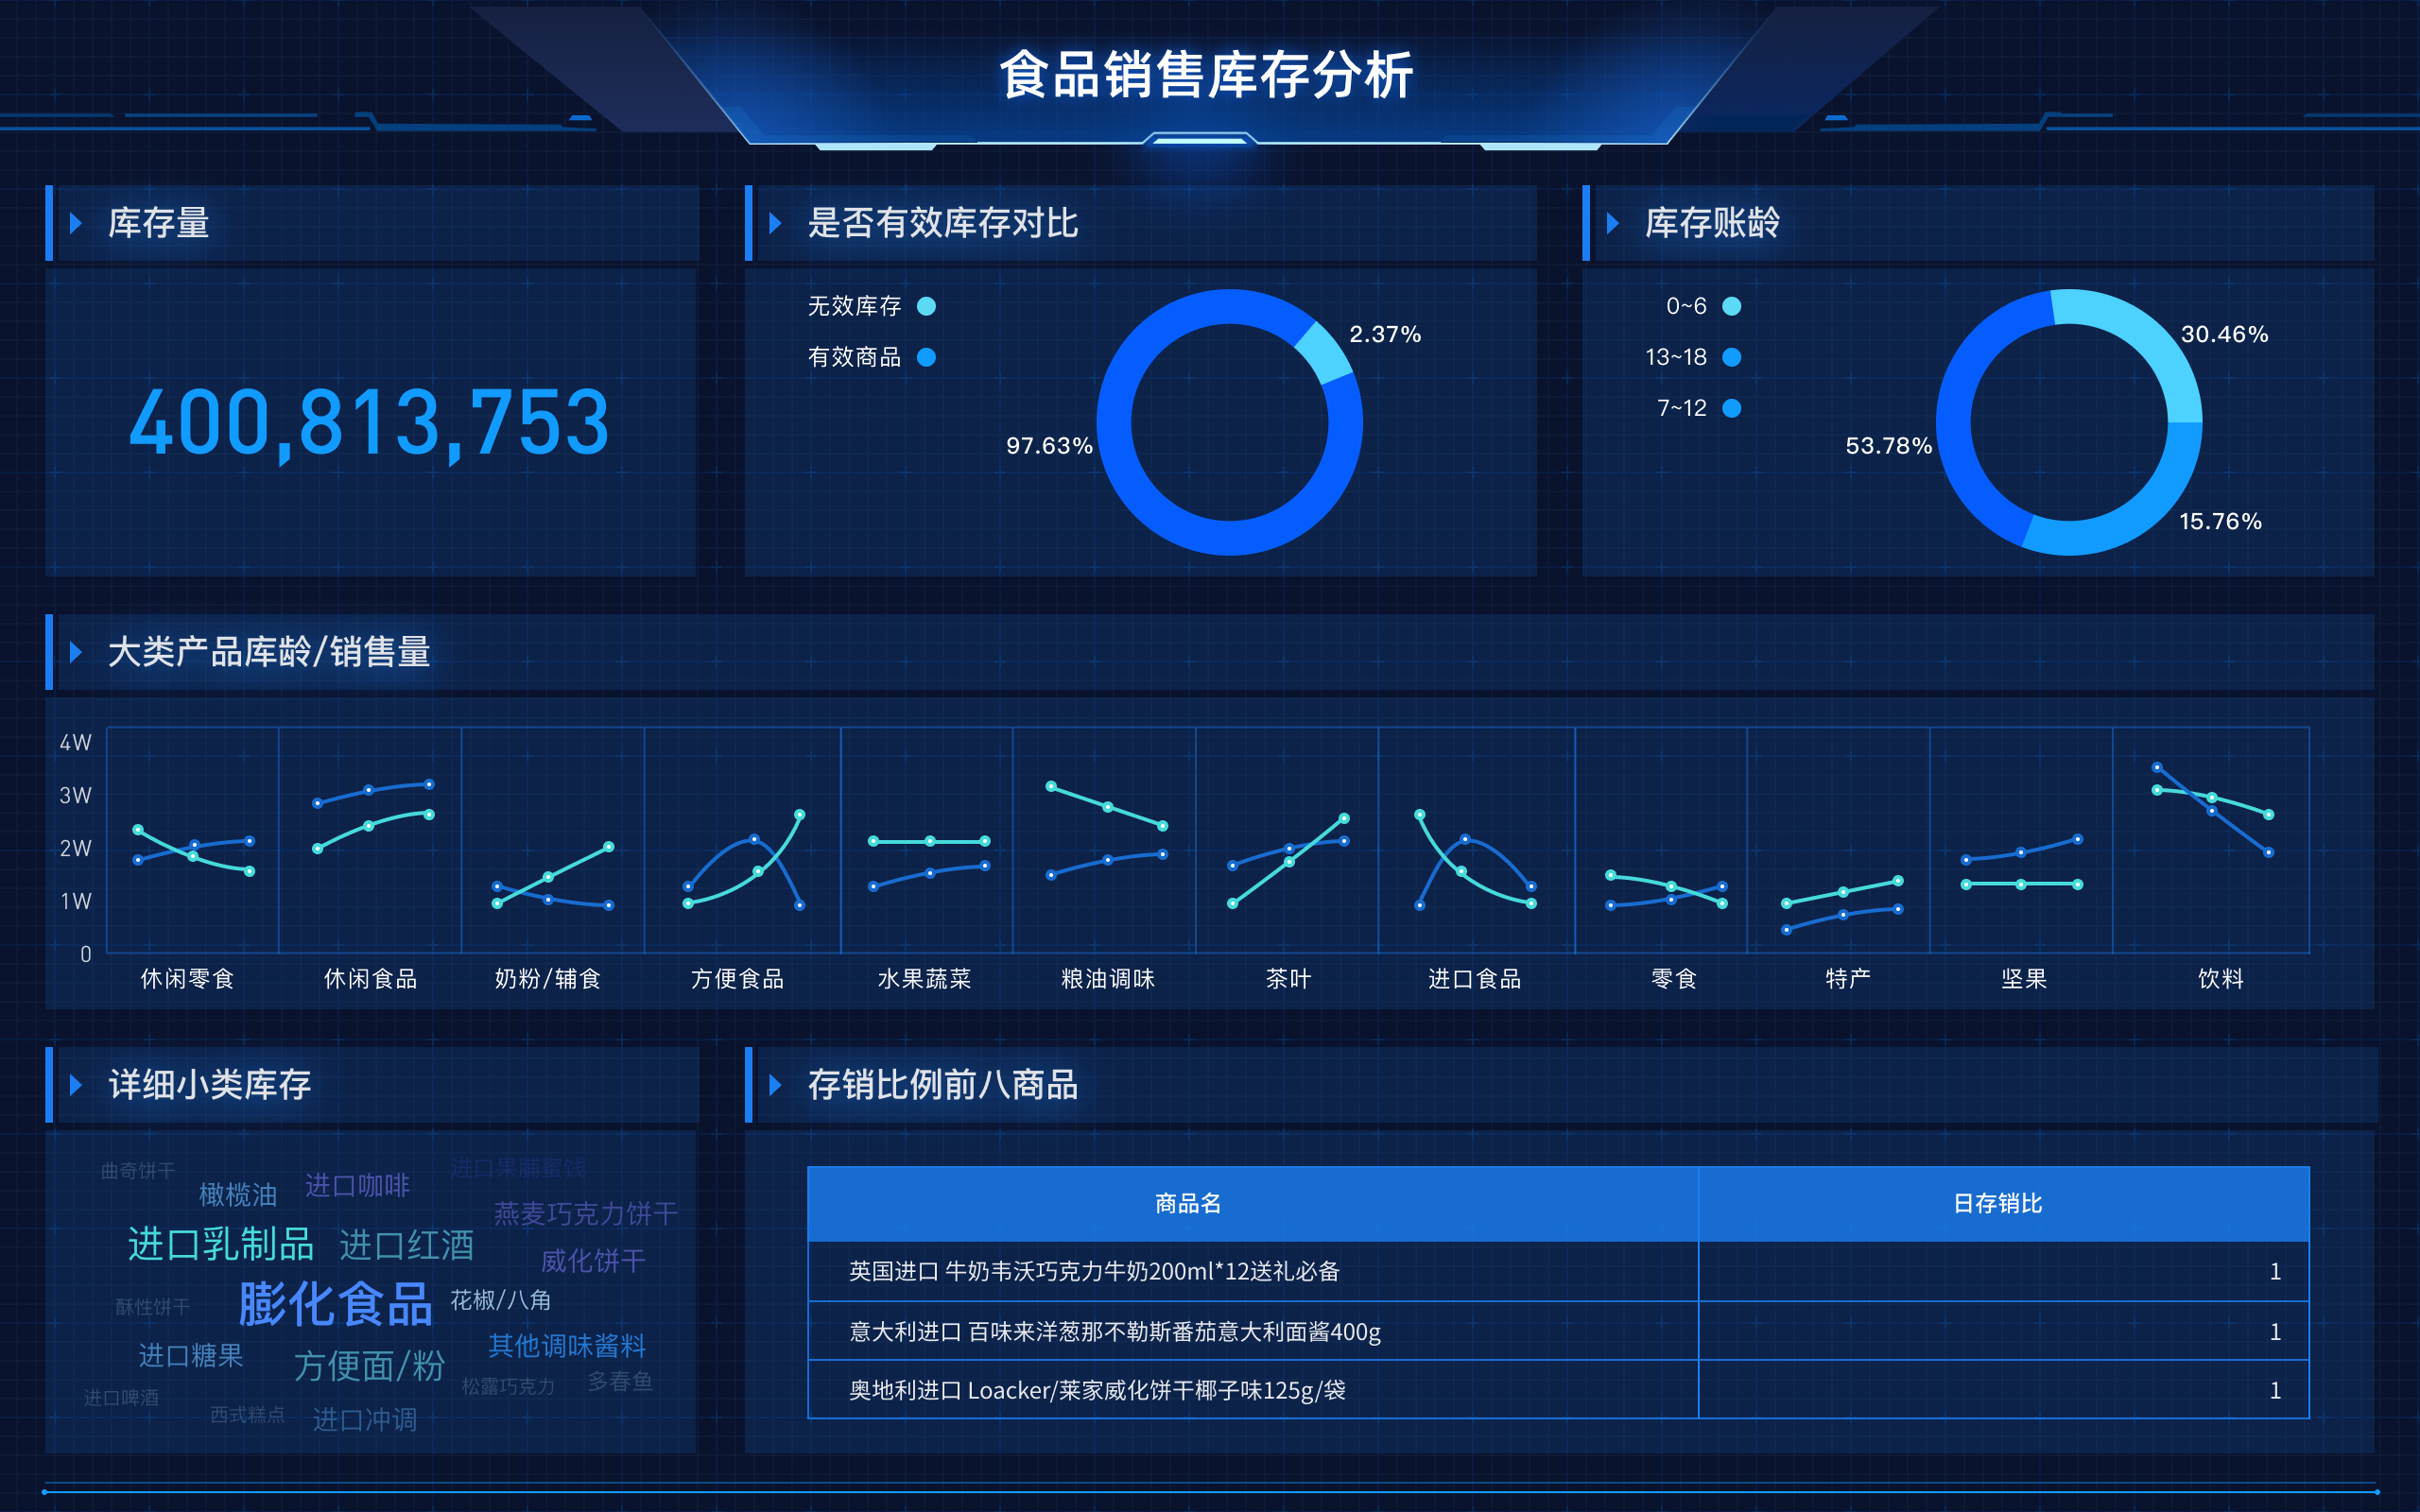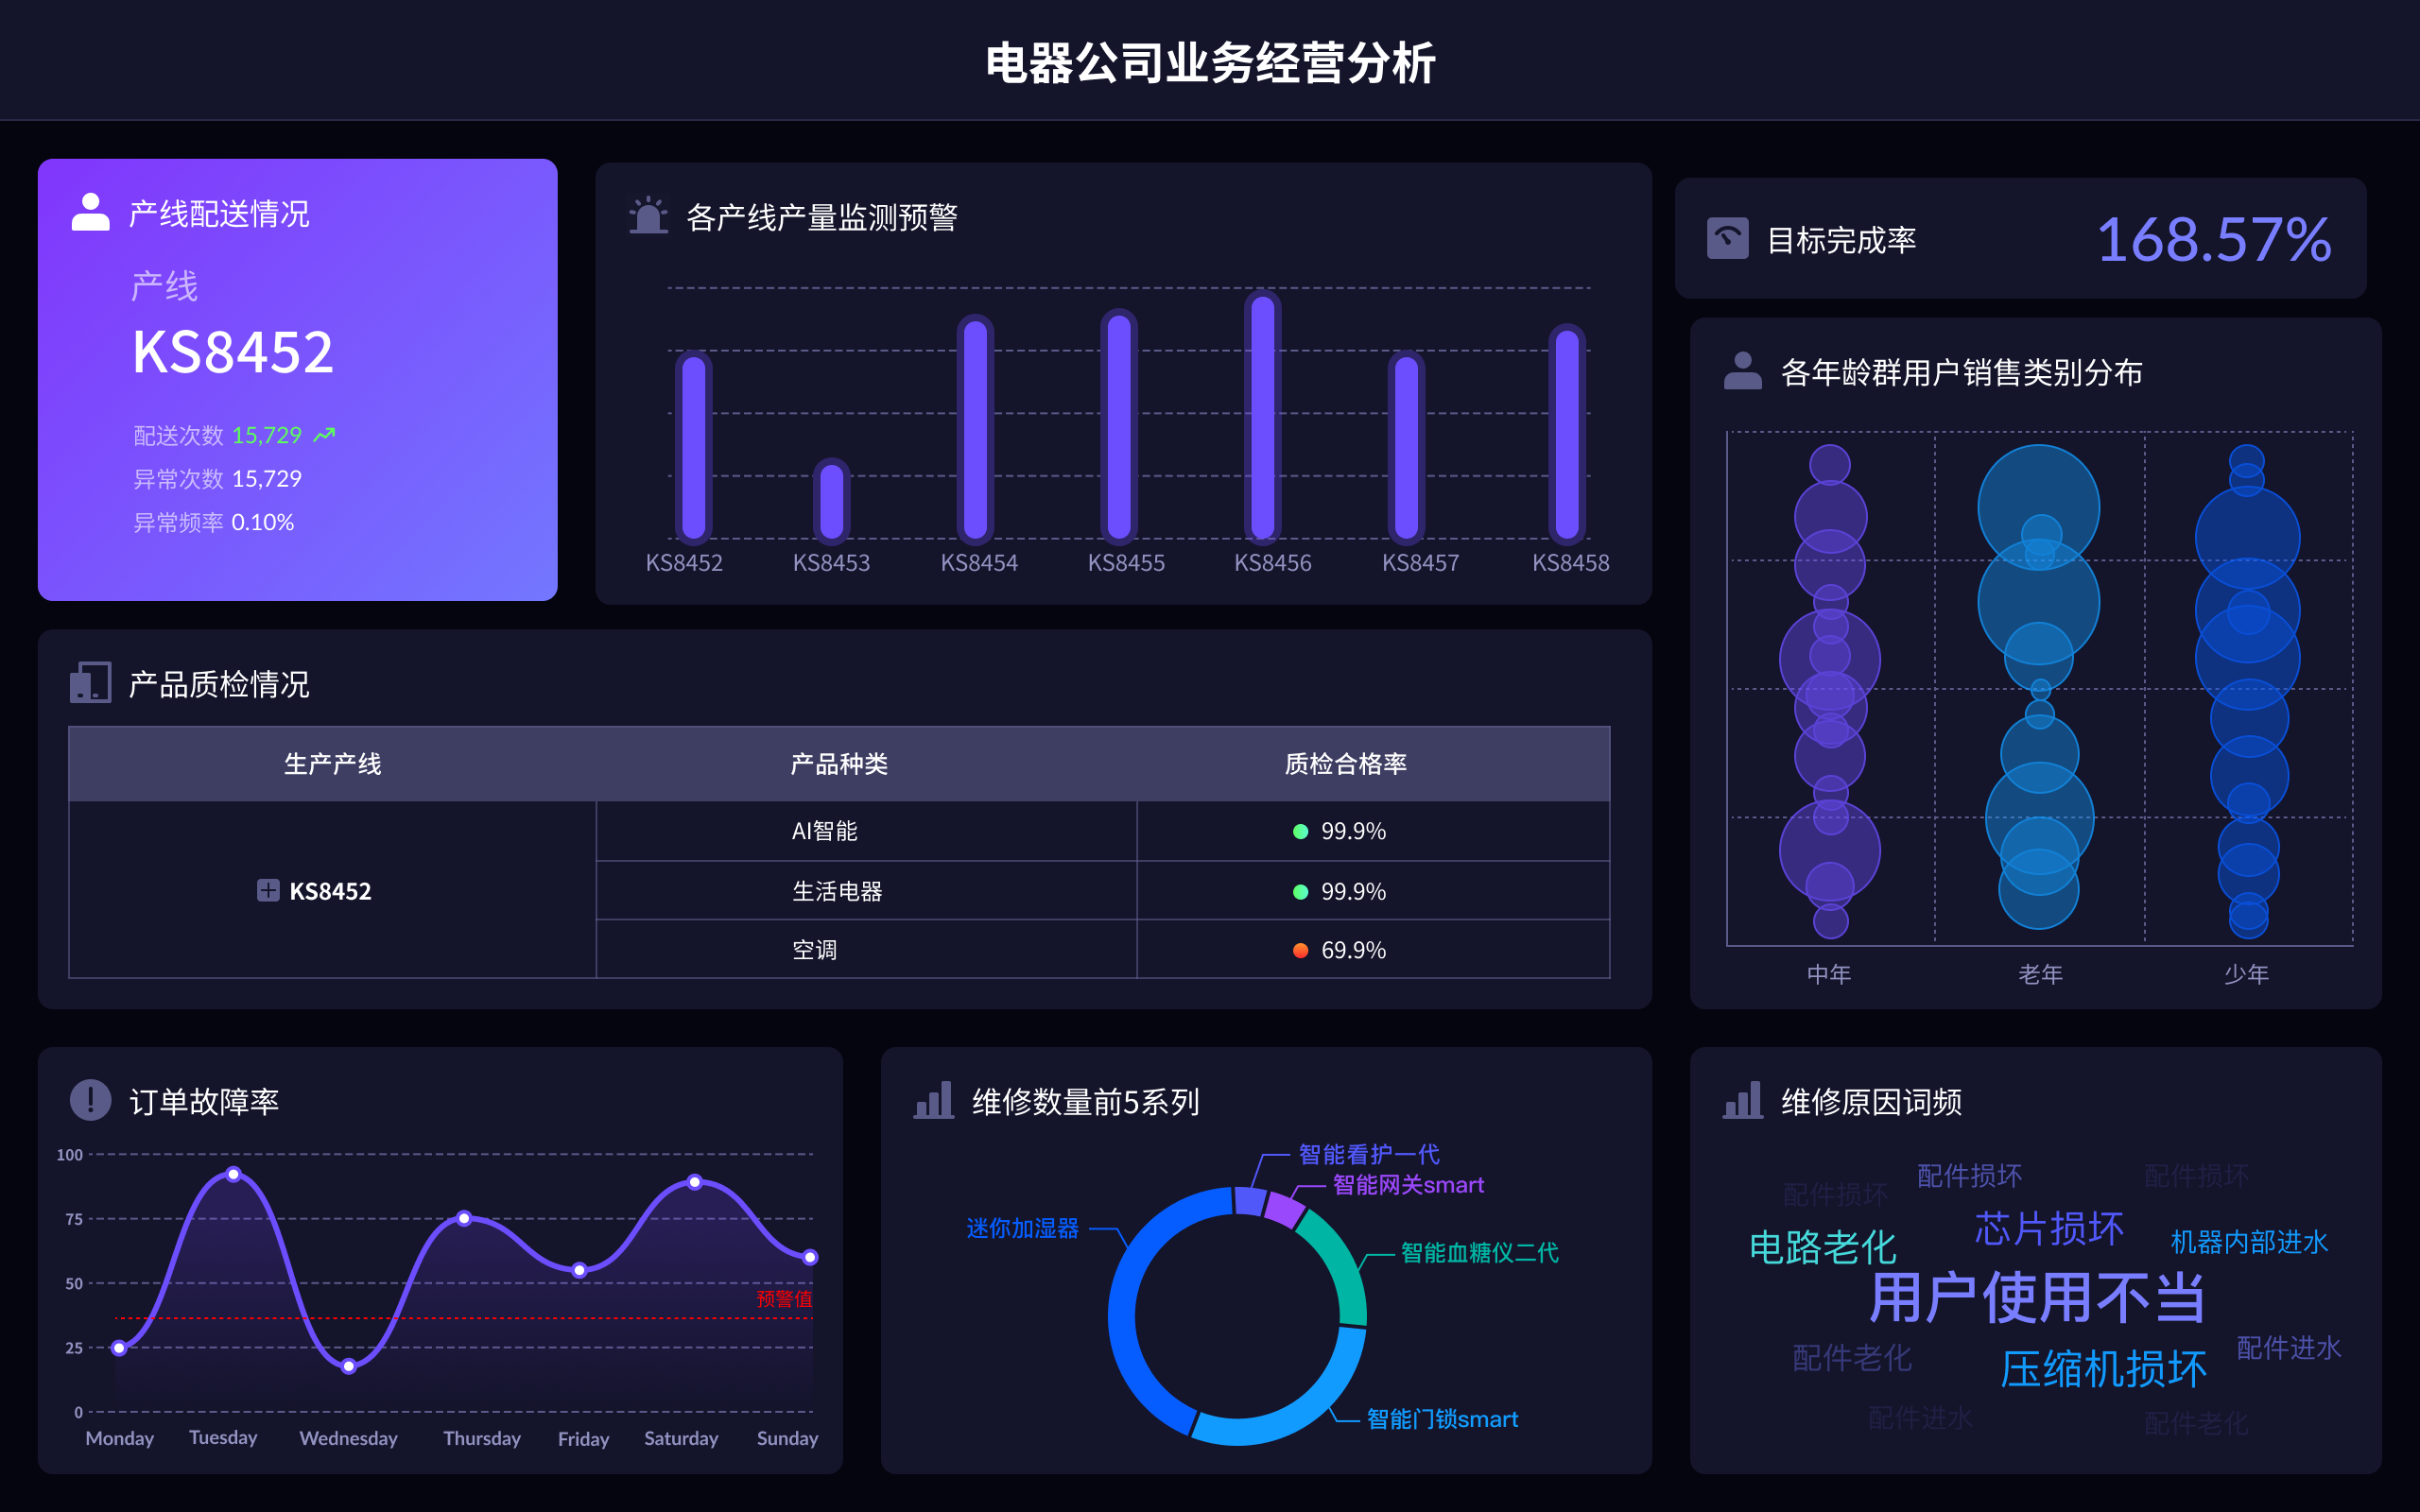
The abbreviation for "big data visualization" in English is BDV. Big Data Visualization (BDV) refers to the graphical representation of large and complex data sets to help individuals understand and interpret the information more effectively. It involves the use of various visualization techniques and tools to transform raw data into visual formats such as charts, graphs, maps, and dashboards. By doing so, BDV allows users to identify patterns, trends, and insights that may not be apparent in the raw data. For instance, BDV can be used in business intelligence to analyze customer behavior, market trends, and operational efficiency, enabling organizations to make data-driven decisions and gain a competitive edge.
I. IMPORTANCE OF BIG DATA VISUALIZATION (BDV)
Big Data Visualization (BDV) is crucial for several reasons: enhances data comprehension、identifies trends and patterns、facilitates decision-making、improves communication and reporting、boosts operational efficiency. By transforming complex data sets into visually appealing and interactive formats, BDV makes it easier for users to comprehend and interpret data. This enhanced understanding allows businesses to identify trends and patterns that may not be evident in raw data, leading to better decision-making and strategic planning. Furthermore, BDV improves communication and reporting within organizations by presenting data in a clear and concise manner, enabling stakeholders to grasp key insights quickly. Additionally, BDV can boost operational efficiency by uncovering inefficiencies and opportunities for optimization.
II. TECHNIQUES AND TOOLS FOR BDV
Several techniques and tools are used in BDV to effectively visualize large data sets. These include: data aggregation、data filtering、geospatial visualization、interactive dashboards、3D visualization、real-time visualization. Data aggregation involves combining multiple data sources to provide a comprehensive view, while data filtering allows users to focus on specific subsets of data. Geospatial visualization maps data geographically, helping to identify spatial patterns and relationships. Interactive dashboards provide a dynamic interface for exploring and analyzing data, while 3D visualization adds depth and perspective to complex data sets. Real-time visualization enables the monitoring of data as it is generated, allowing for immediate insights and actions.
III. APPLICATIONS OF BDV IN VARIOUS INDUSTRIES
Big Data Visualization (BDV) has a wide range of applications across various industries: healthcare、finance、retail、manufacturing、telecommunications、government. In healthcare, BDV is used to track patient outcomes, monitor disease outbreaks, and optimize hospital operations. In finance, it helps in analyzing market trends, detecting fraud, and managing risk. Retailers use BDV to understand customer behavior, manage inventory, and optimize sales strategies. Manufacturing industries leverage BDV to monitor production processes, ensure quality control, and predict maintenance needs. Telecommunications companies use it to analyze network performance, optimize service delivery, and enhance customer experience. Government agencies employ BDV for policy analysis, urban planning, and disaster response.
IV. CHALLENGES IN IMPLEMENTING BDV
Implementing Big Data Visualization (BDV) comes with several challenges: data quality and integrity、scalability、data security and privacy、integration with existing systems、user adoption and training、cost and resource allocation. Ensuring data quality and integrity is crucial for accurate visualizations, as poor data can lead to misleading insights. Scalability is another challenge, as the tools and techniques used must handle the growing volume and complexity of data. Data security and privacy are critical concerns, especially when dealing with sensitive information. Integrating BDV with existing systems and workflows can be complex and time-consuming. User adoption and training are essential to ensure that stakeholders can effectively use BDV tools and interpret the visualizations. Additionally, cost and resource allocation must be carefully managed to ensure the successful implementation and ongoing maintenance of BDV solutions.
V. FUTURE TRENDS IN BDV
The future of Big Data Visualization (BDV) is likely to be shaped by several emerging trends: artificial intelligence and machine learning、augmented reality and virtual reality、increased use of real-time data、greater emphasis on user experience、integration with the Internet of Things (IoT)、enhanced collaboration and sharing. Artificial intelligence and machine learning will play a significant role in automating data analysis and generating more sophisticated visualizations. Augmented reality (AR) and virtual reality (VR) will provide immersive and interactive ways to explore and understand data. The use of real-time data will continue to grow, enabling more timely and actionable insights. There will be a greater emphasis on user experience, with a focus on creating intuitive and accessible visualization tools. The integration of BDV with IoT devices will provide richer and more dynamic data sources. Enhanced collaboration and sharing capabilities will enable teams to work together more effectively and share insights across organizations.
Big Data Visualization (BDV) is an essential tool for unlocking the potential of large and complex data sets. By using various techniques and tools to transform data into visual formats, BDV enhances data comprehension, facilitates decision-making, and improves communication and reporting. Despite the challenges in implementation, the benefits of BDV are significant, and its applications are widespread across industries. With emerging trends such as artificial intelligence, augmented reality, and real-time data, the future of BDV promises to bring even more innovative and impactful solutions.
相关问答FAQs:
大数据可视化英文简称是什么?
大数据可视化的英文简称通常为“DV”,即“Data Visualization”。这一术语指的是通过图形或图表的方式,将复杂的数据集转化为易于理解和分析的视觉形式。大数据可视化的核心在于将大量的、复杂的数据通过图形化的方式呈现出来,以帮助决策者和分析师更快地理解数据背后的含义,从而做出更明智的决策。
在实际应用中,大数据可视化可以采用多种形式,包括柱状图、折线图、散点图、热力图等。这些图形可以有效地展示数据的趋势、分布和关系,使得用户能够在海量数据中快速识别出重要的信息。随着信息技术的发展,越来越多的工具和平台被开发出来以支持大数据可视化,包括Tableau、Power BI、D3.js等。
大数据可视化的主要应用领域有哪些?
大数据可视化的应用领域非常广泛,涵盖了商业、医疗、金融、政府等多个行业。在商业领域,企业利用数据可视化工具分析销售数据和客户反馈,从而优化市场策略和产品设计。在医疗行业,数据可视化可以帮助医生和研究人员更好地理解病患的健康状况,分析疾病传播的趋势。
在金融领域,数据可视化被用于监控市场动态、风险评估和投资分析,通过图形化的方式帮助投资者做出实时决策。在政府部门,通过可视化技术分析社会数据,能够更好地制定政策和分配资源。例如,城市交通流量的数据可视化可以帮助交通规划者优化交通信号和路网布局。
此外,数据可视化还在教育领域发挥着重要作用,通过可视化工具,教师能够更直观地向学生传达复杂的知识概念,提升学习效果。
如何选择合适的大数据可视化工具?
选择合适的大数据可视化工具需要考虑多个因素,包括数据的类型、可视化的目的、用户的技术水平以及预算等。首先,明确数据的类型是选择工具的基础。例如,处理时序数据时,可能需要选择支持动态可视化的工具,而对于地理数据,则需要支持地图可视化的工具。
其次,确定可视化的目的也很重要。对于需要实时更新的数据,选择能够与数据源无缝连接的工具尤为关键。此外,用户的技术水平也是一个重要考量因素。一些工具需要较高的技术背景来进行高级定制,而另一些工具则提供了友好的用户界面,适合非技术用户。
预算方面,不同的可视化工具在价格上差异较大。有些工具是开源的,可以免费使用,但可能在功能上有所限制;而一些商业工具虽然功能强大,但价格较高。因此,在选择时需要权衡功能与成本之间的关系。
综合考虑这些因素后,用户可以选择最适合其需求的可视化工具,帮助其更高效地分析和展示数据。
本文内容通过AI工具匹配关键字智能整合而成,仅供参考,帆软不对内容的真实、准确或完整作任何形式的承诺。具体产品功能请以帆软官方帮助文档为准,或联系您的对接销售进行咨询。如有其他问题,您可以通过联系blog@fanruan.com进行反馈,帆软收到您的反馈后将及时答复和处理。


