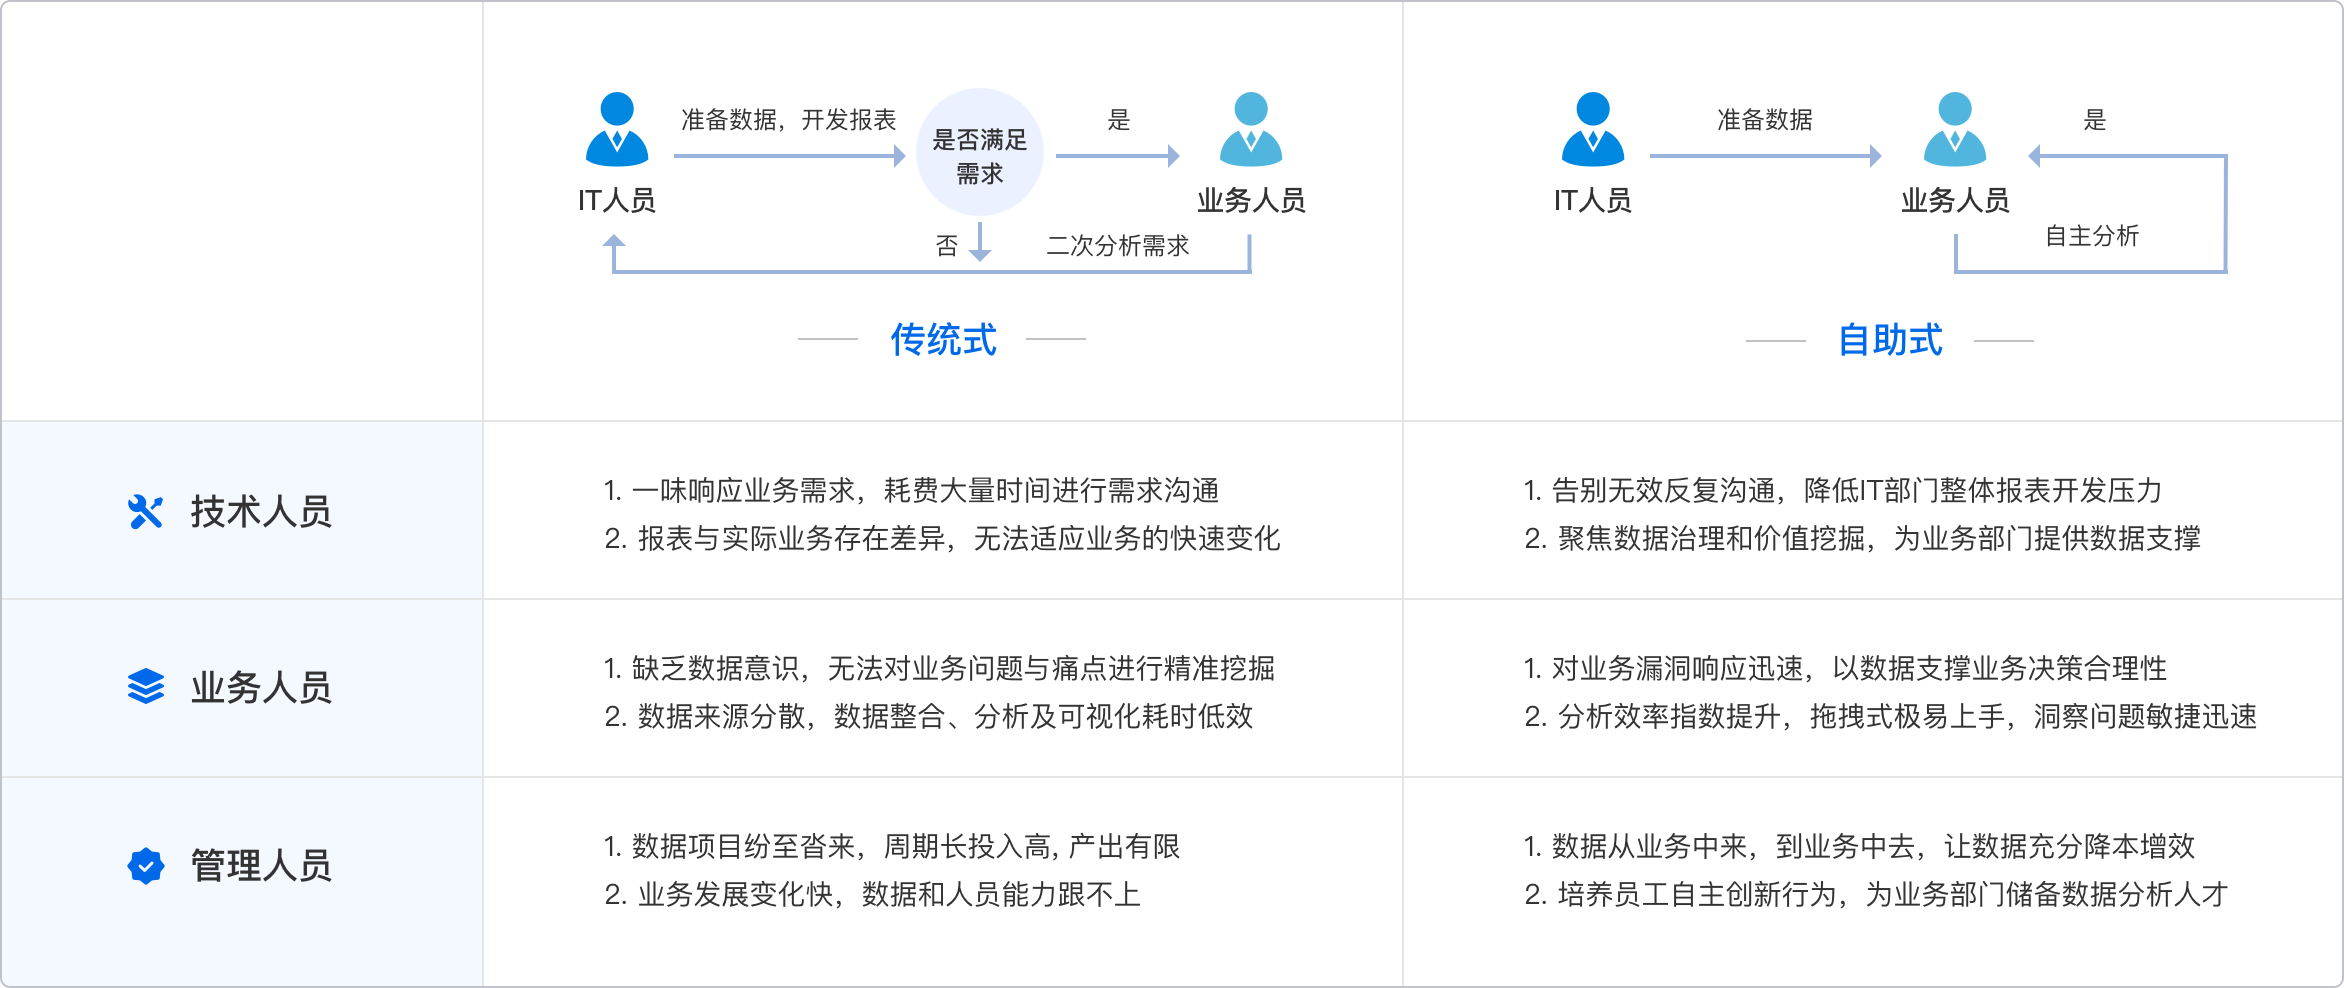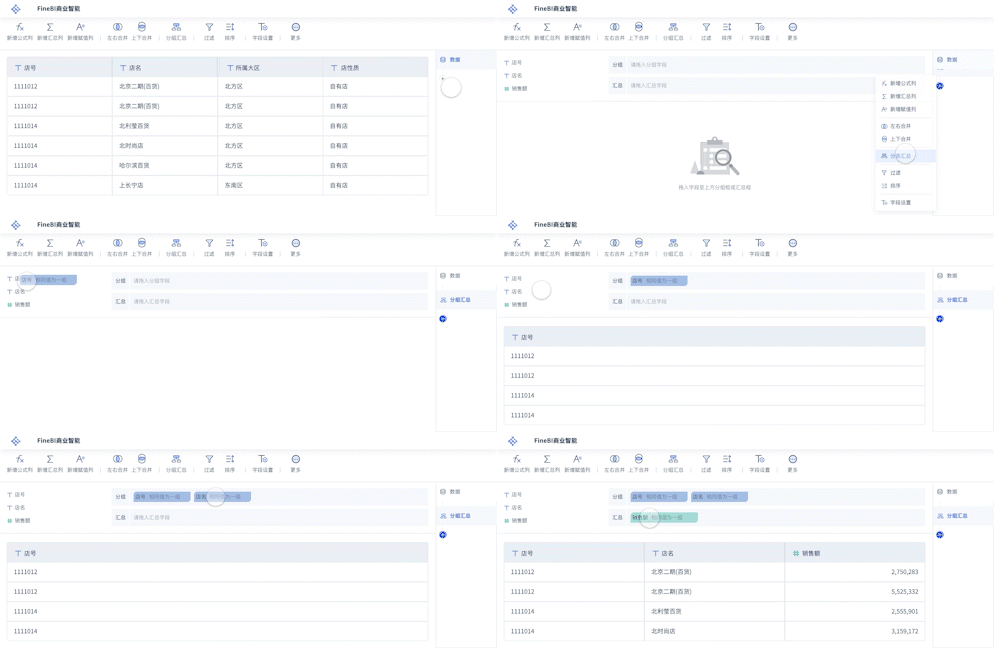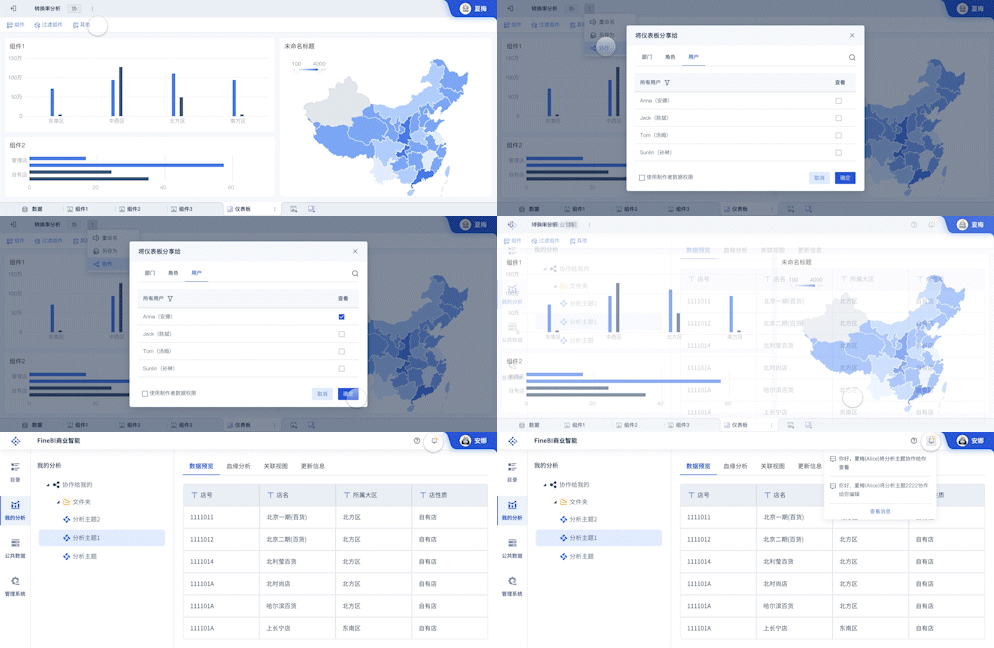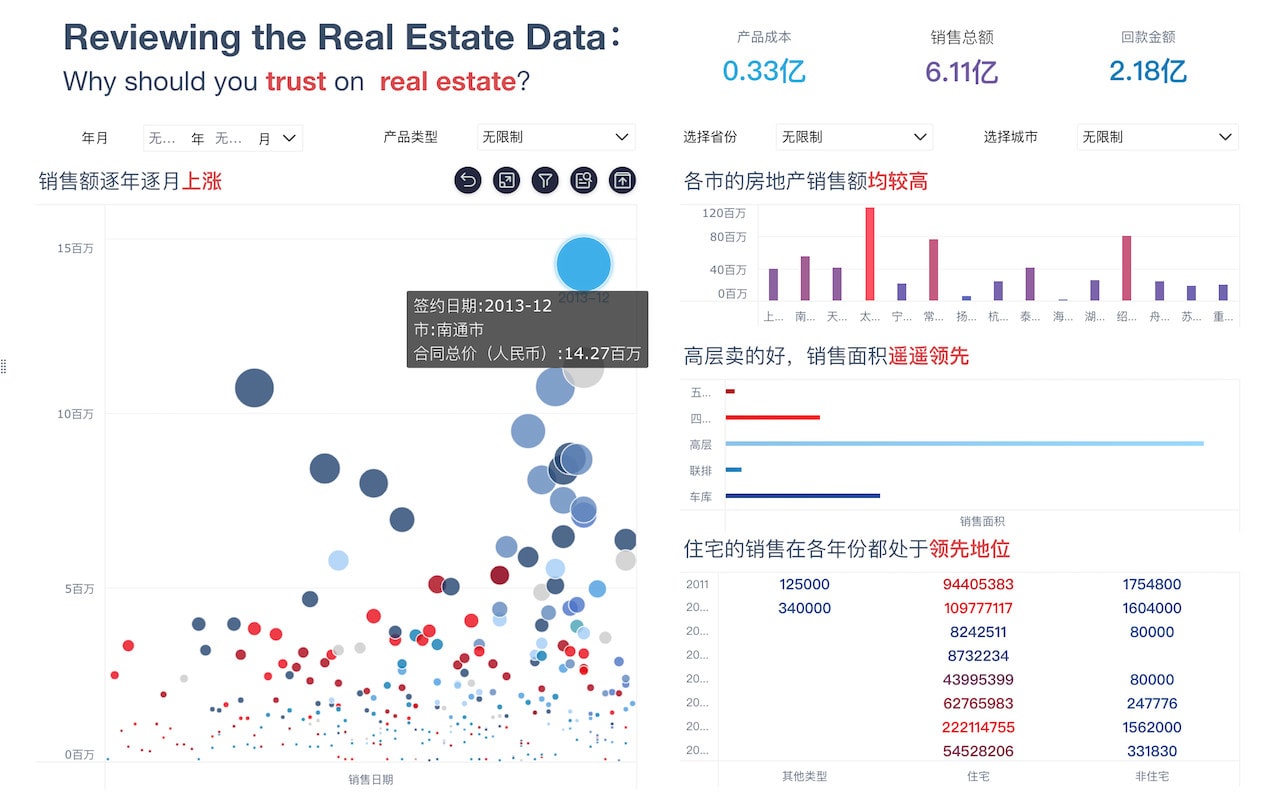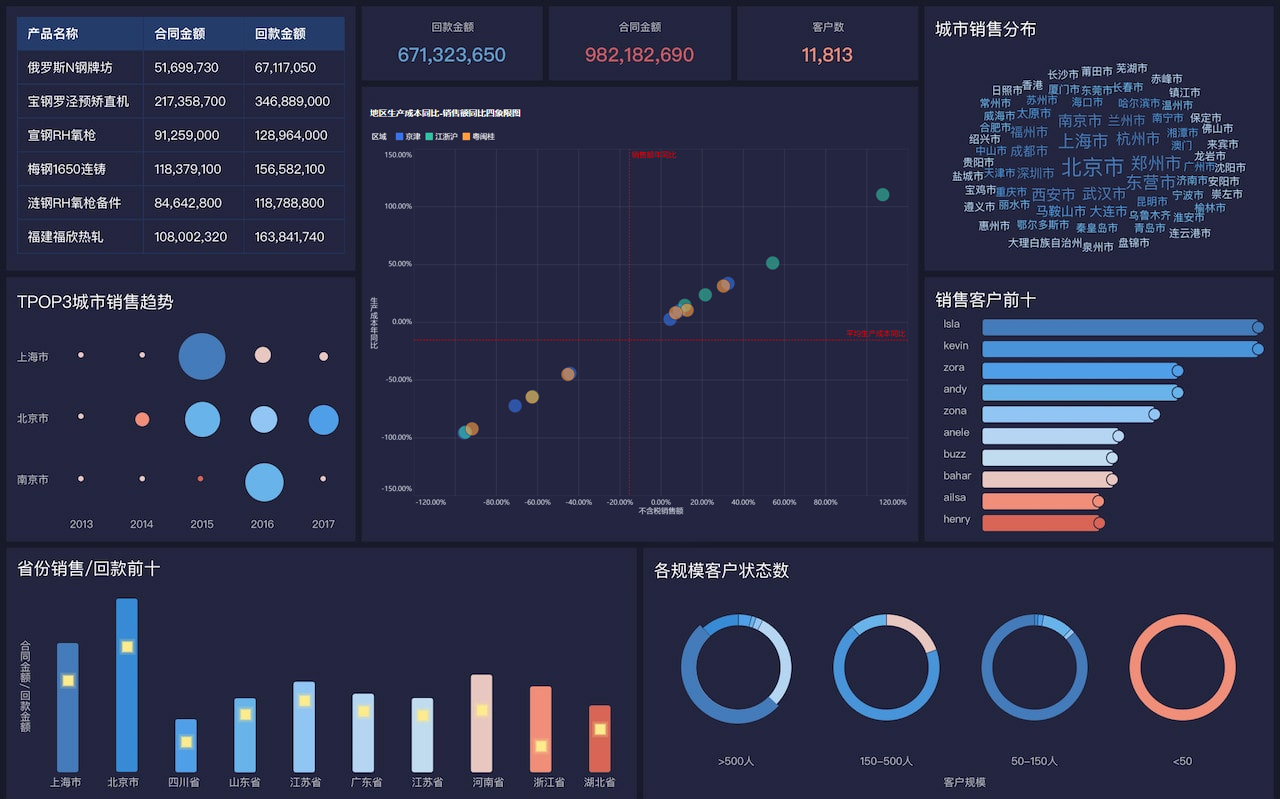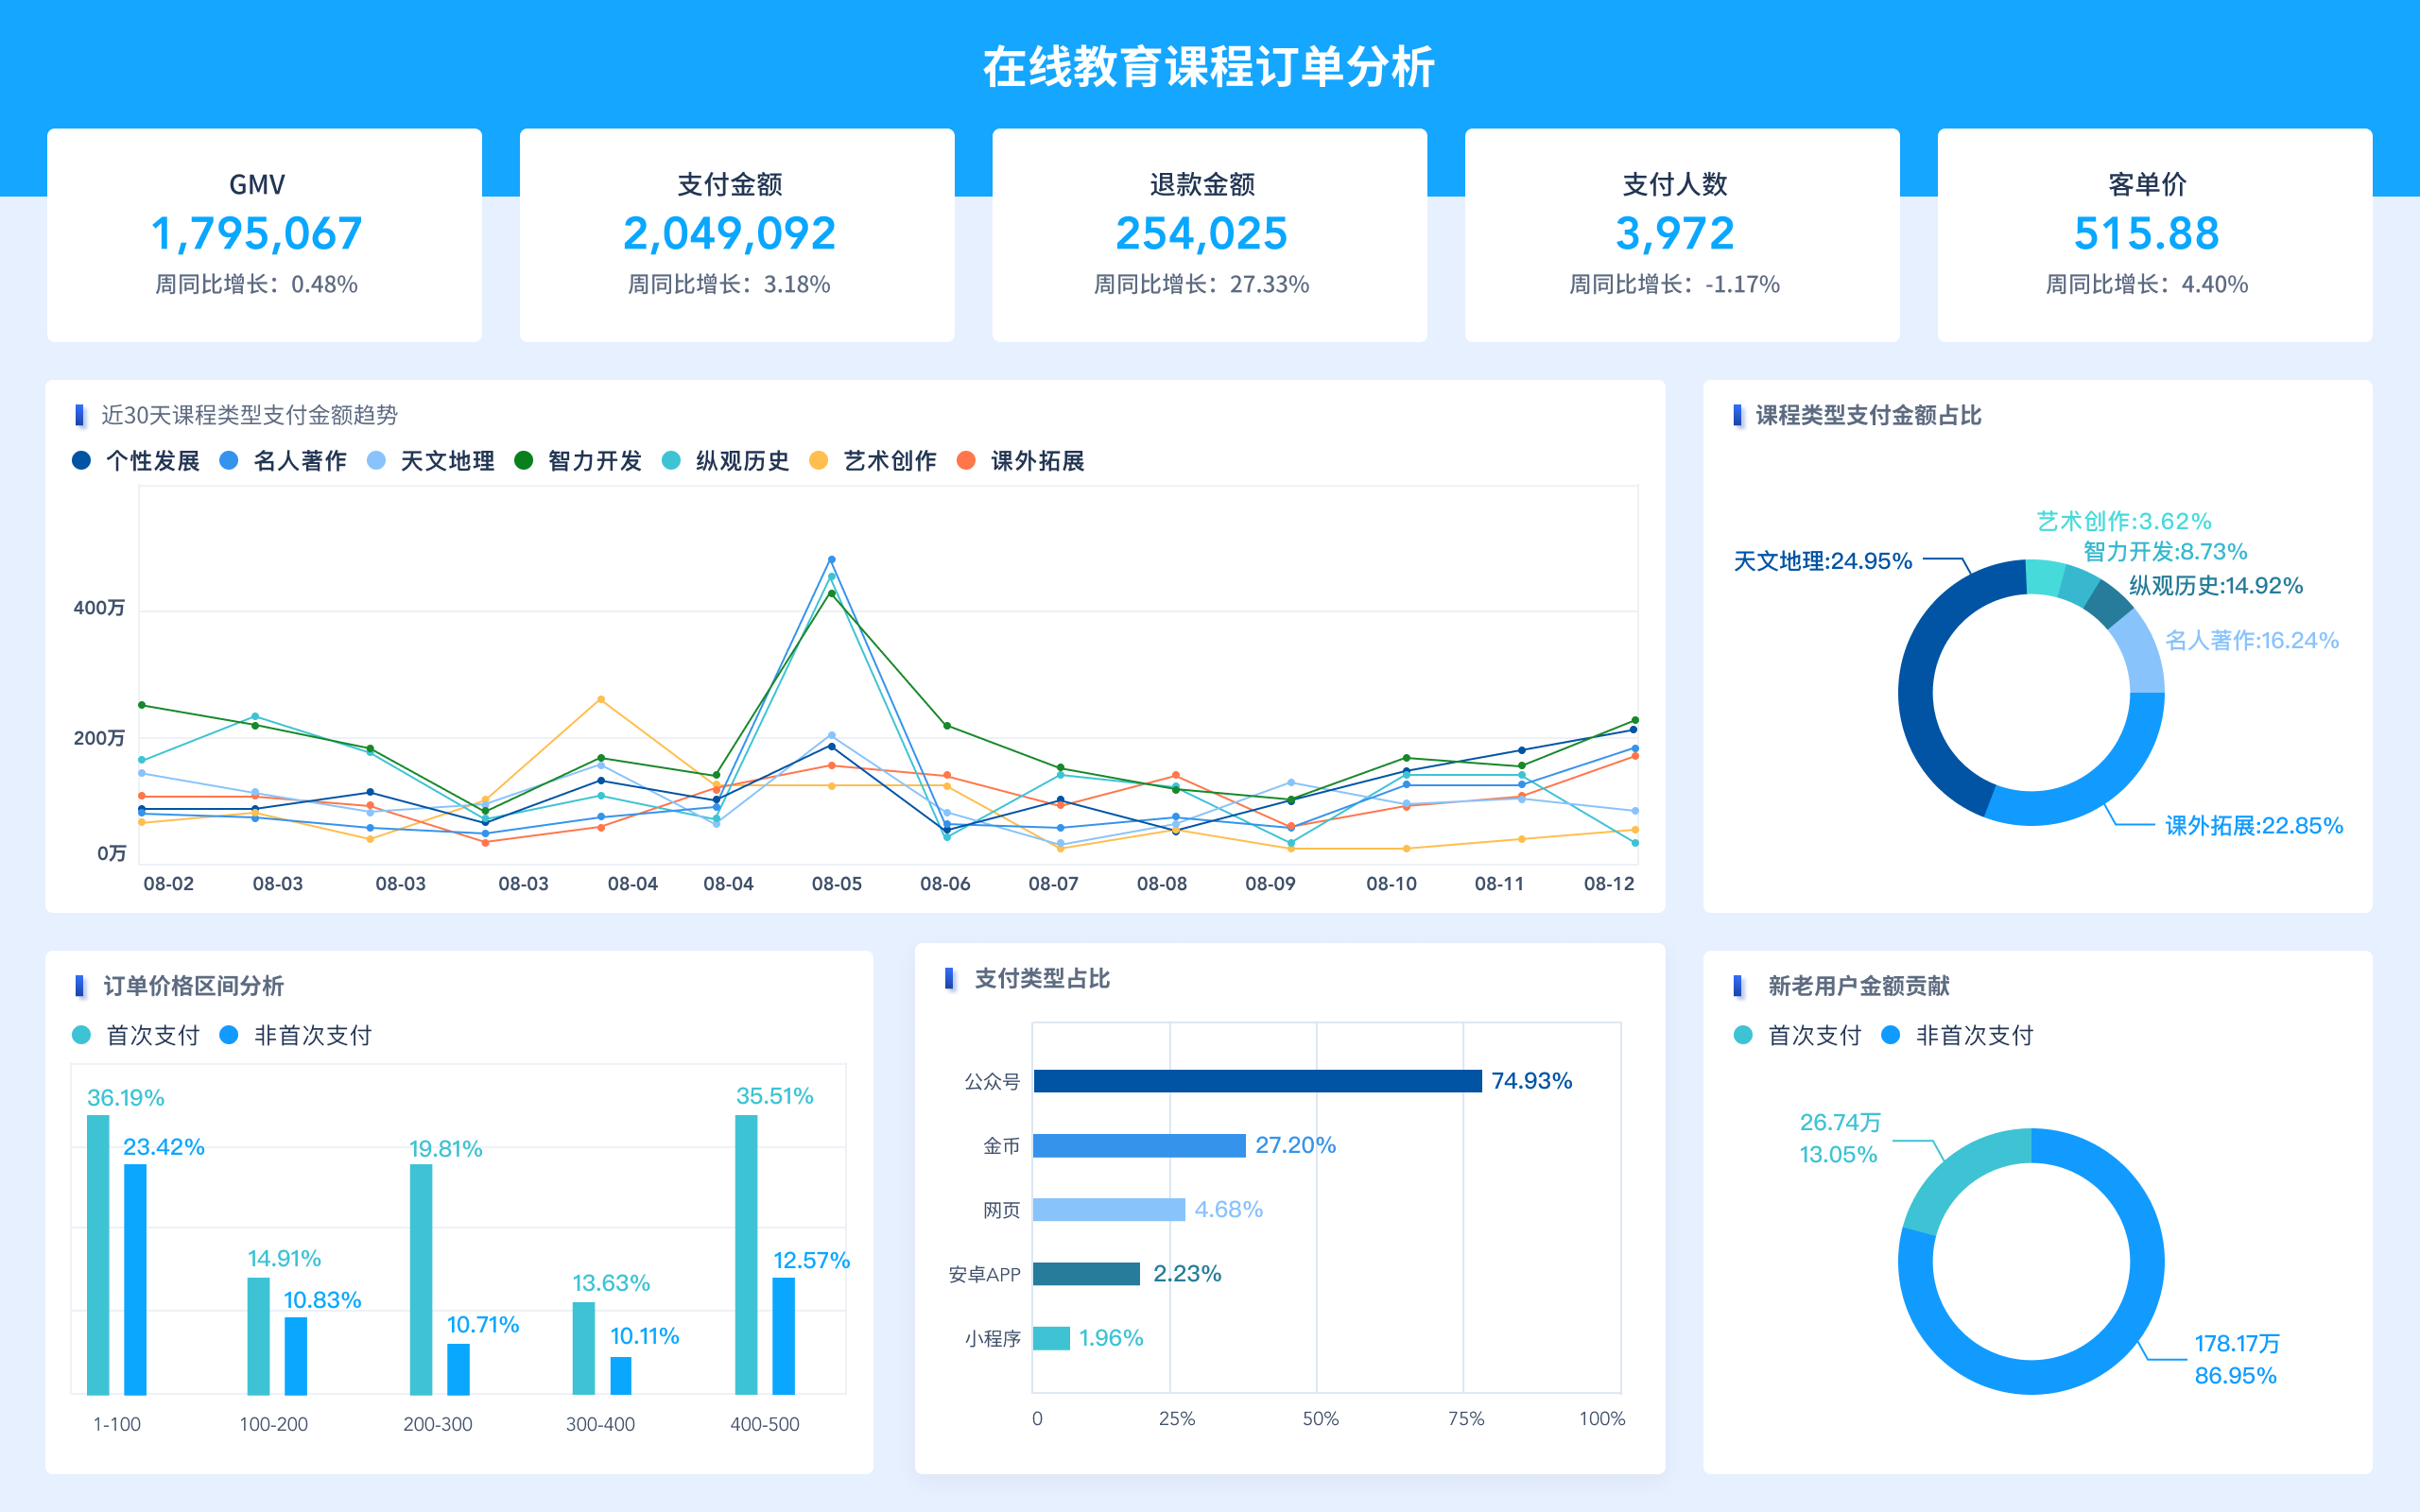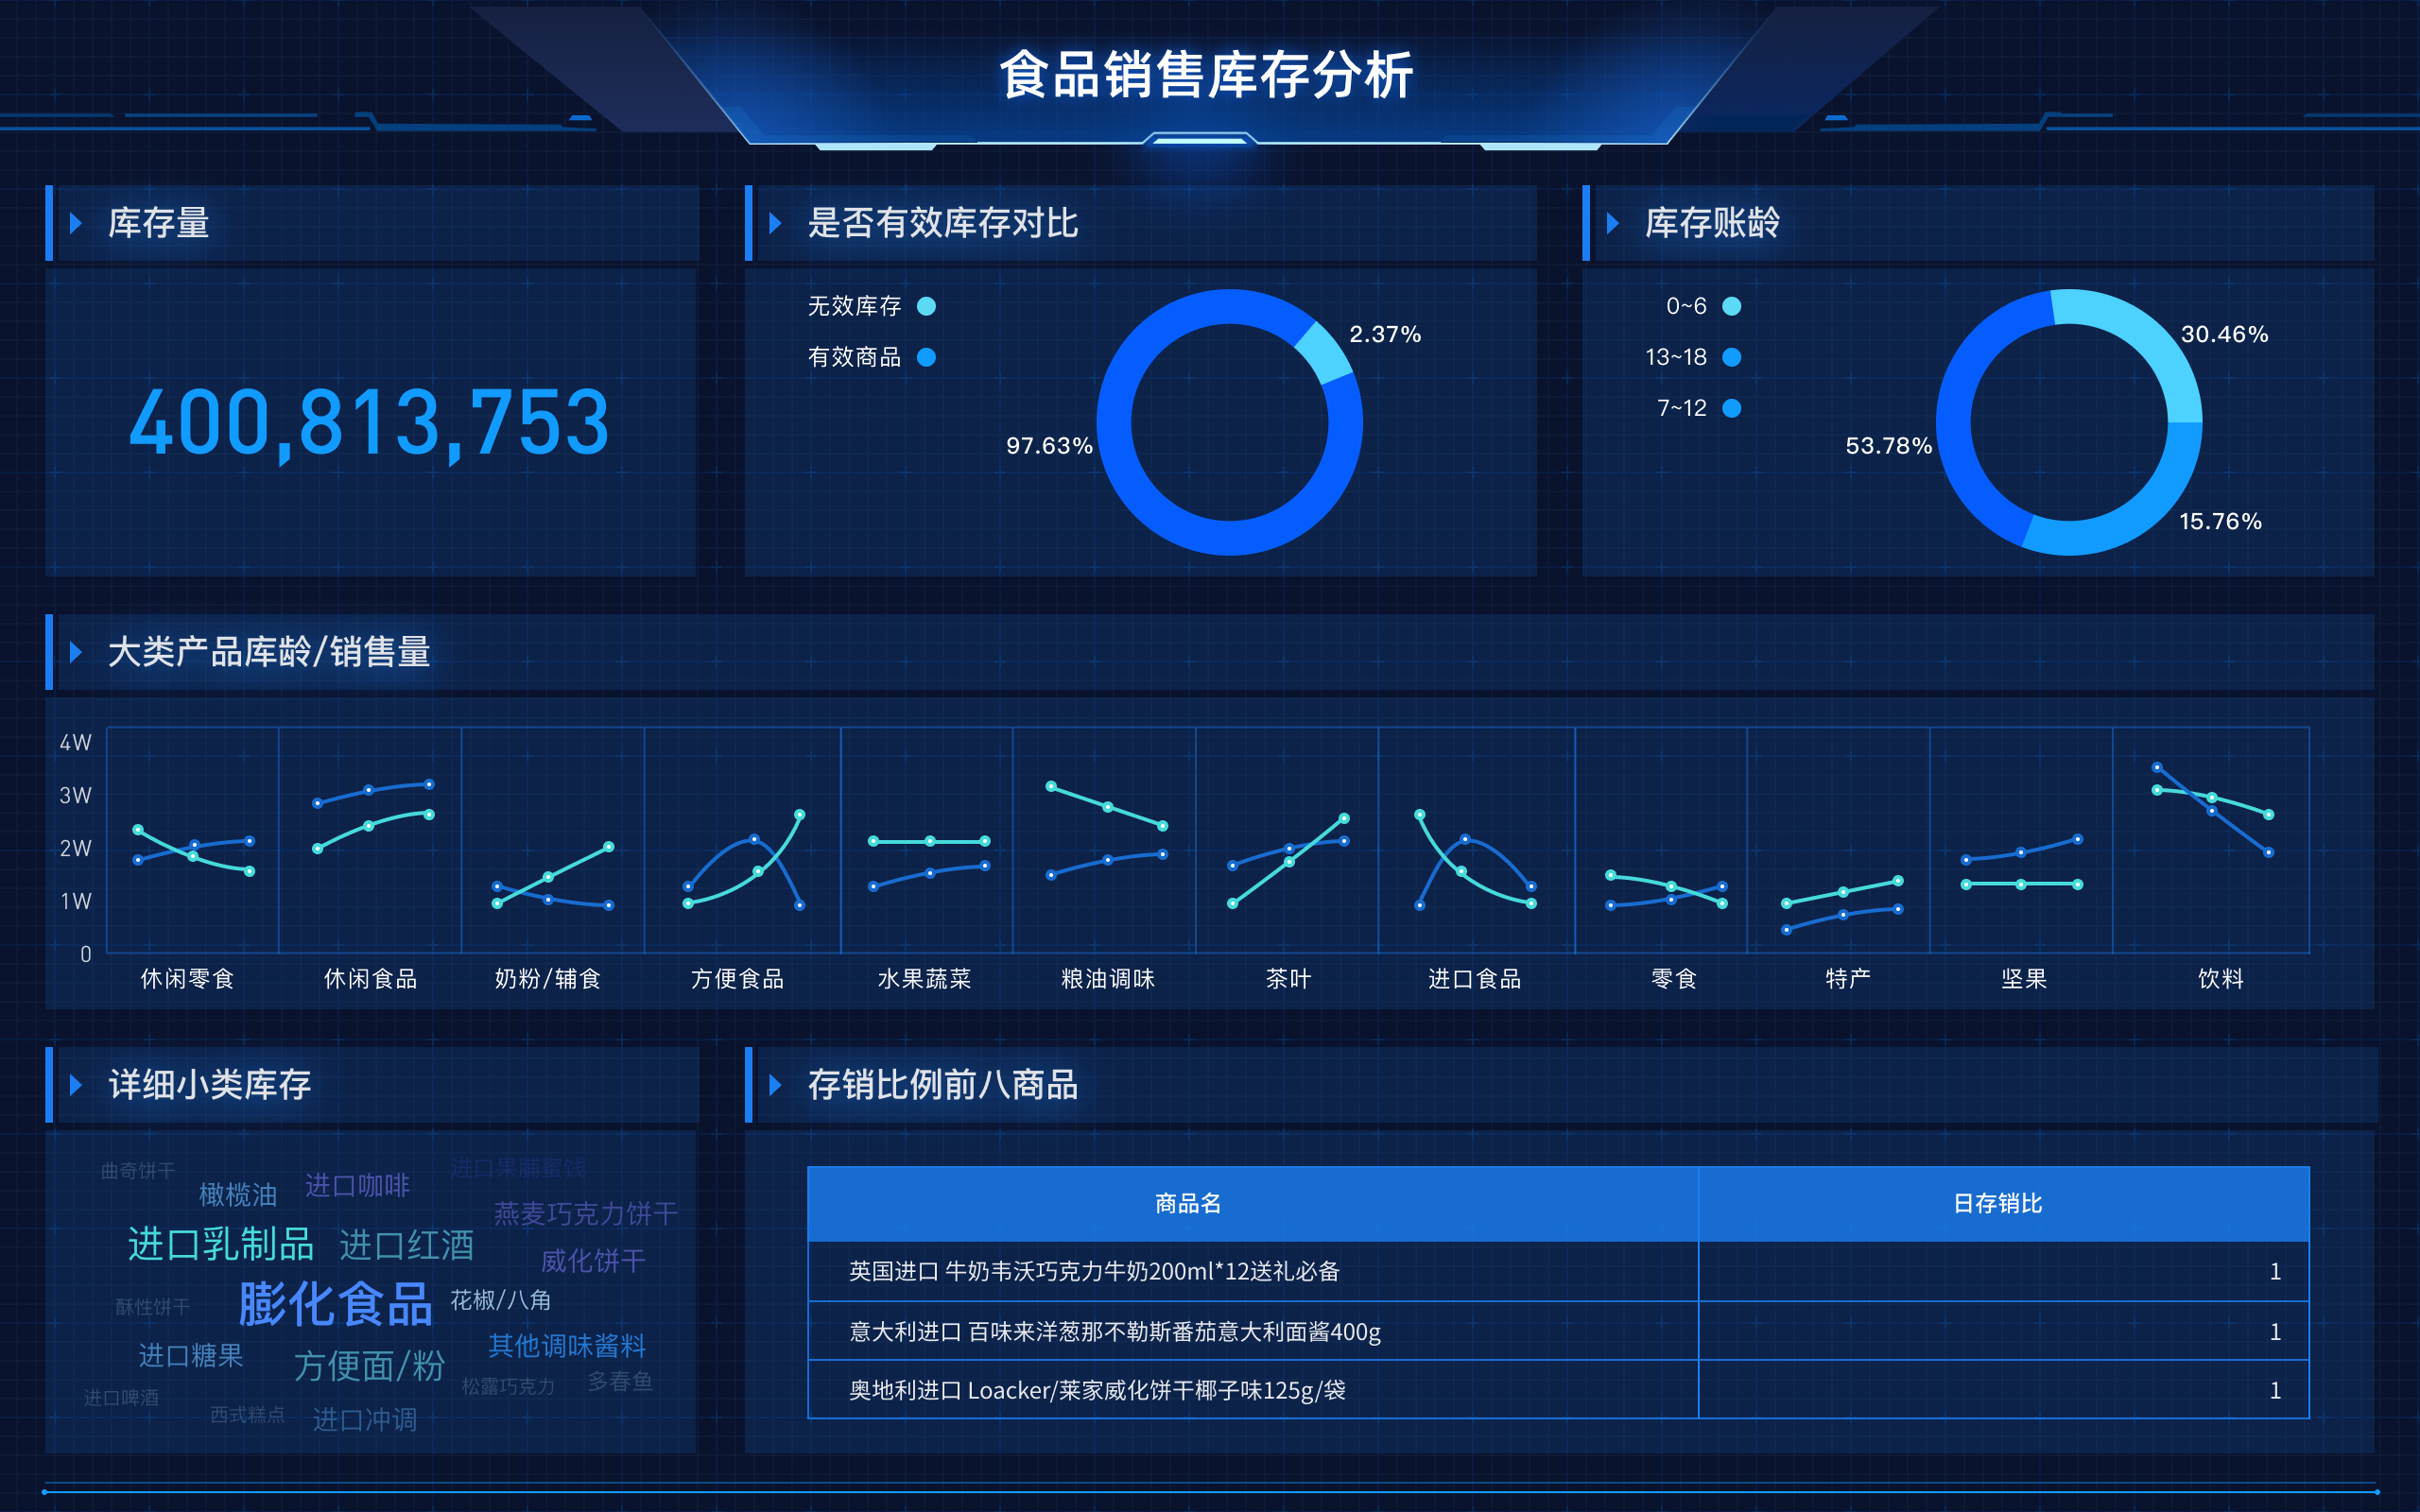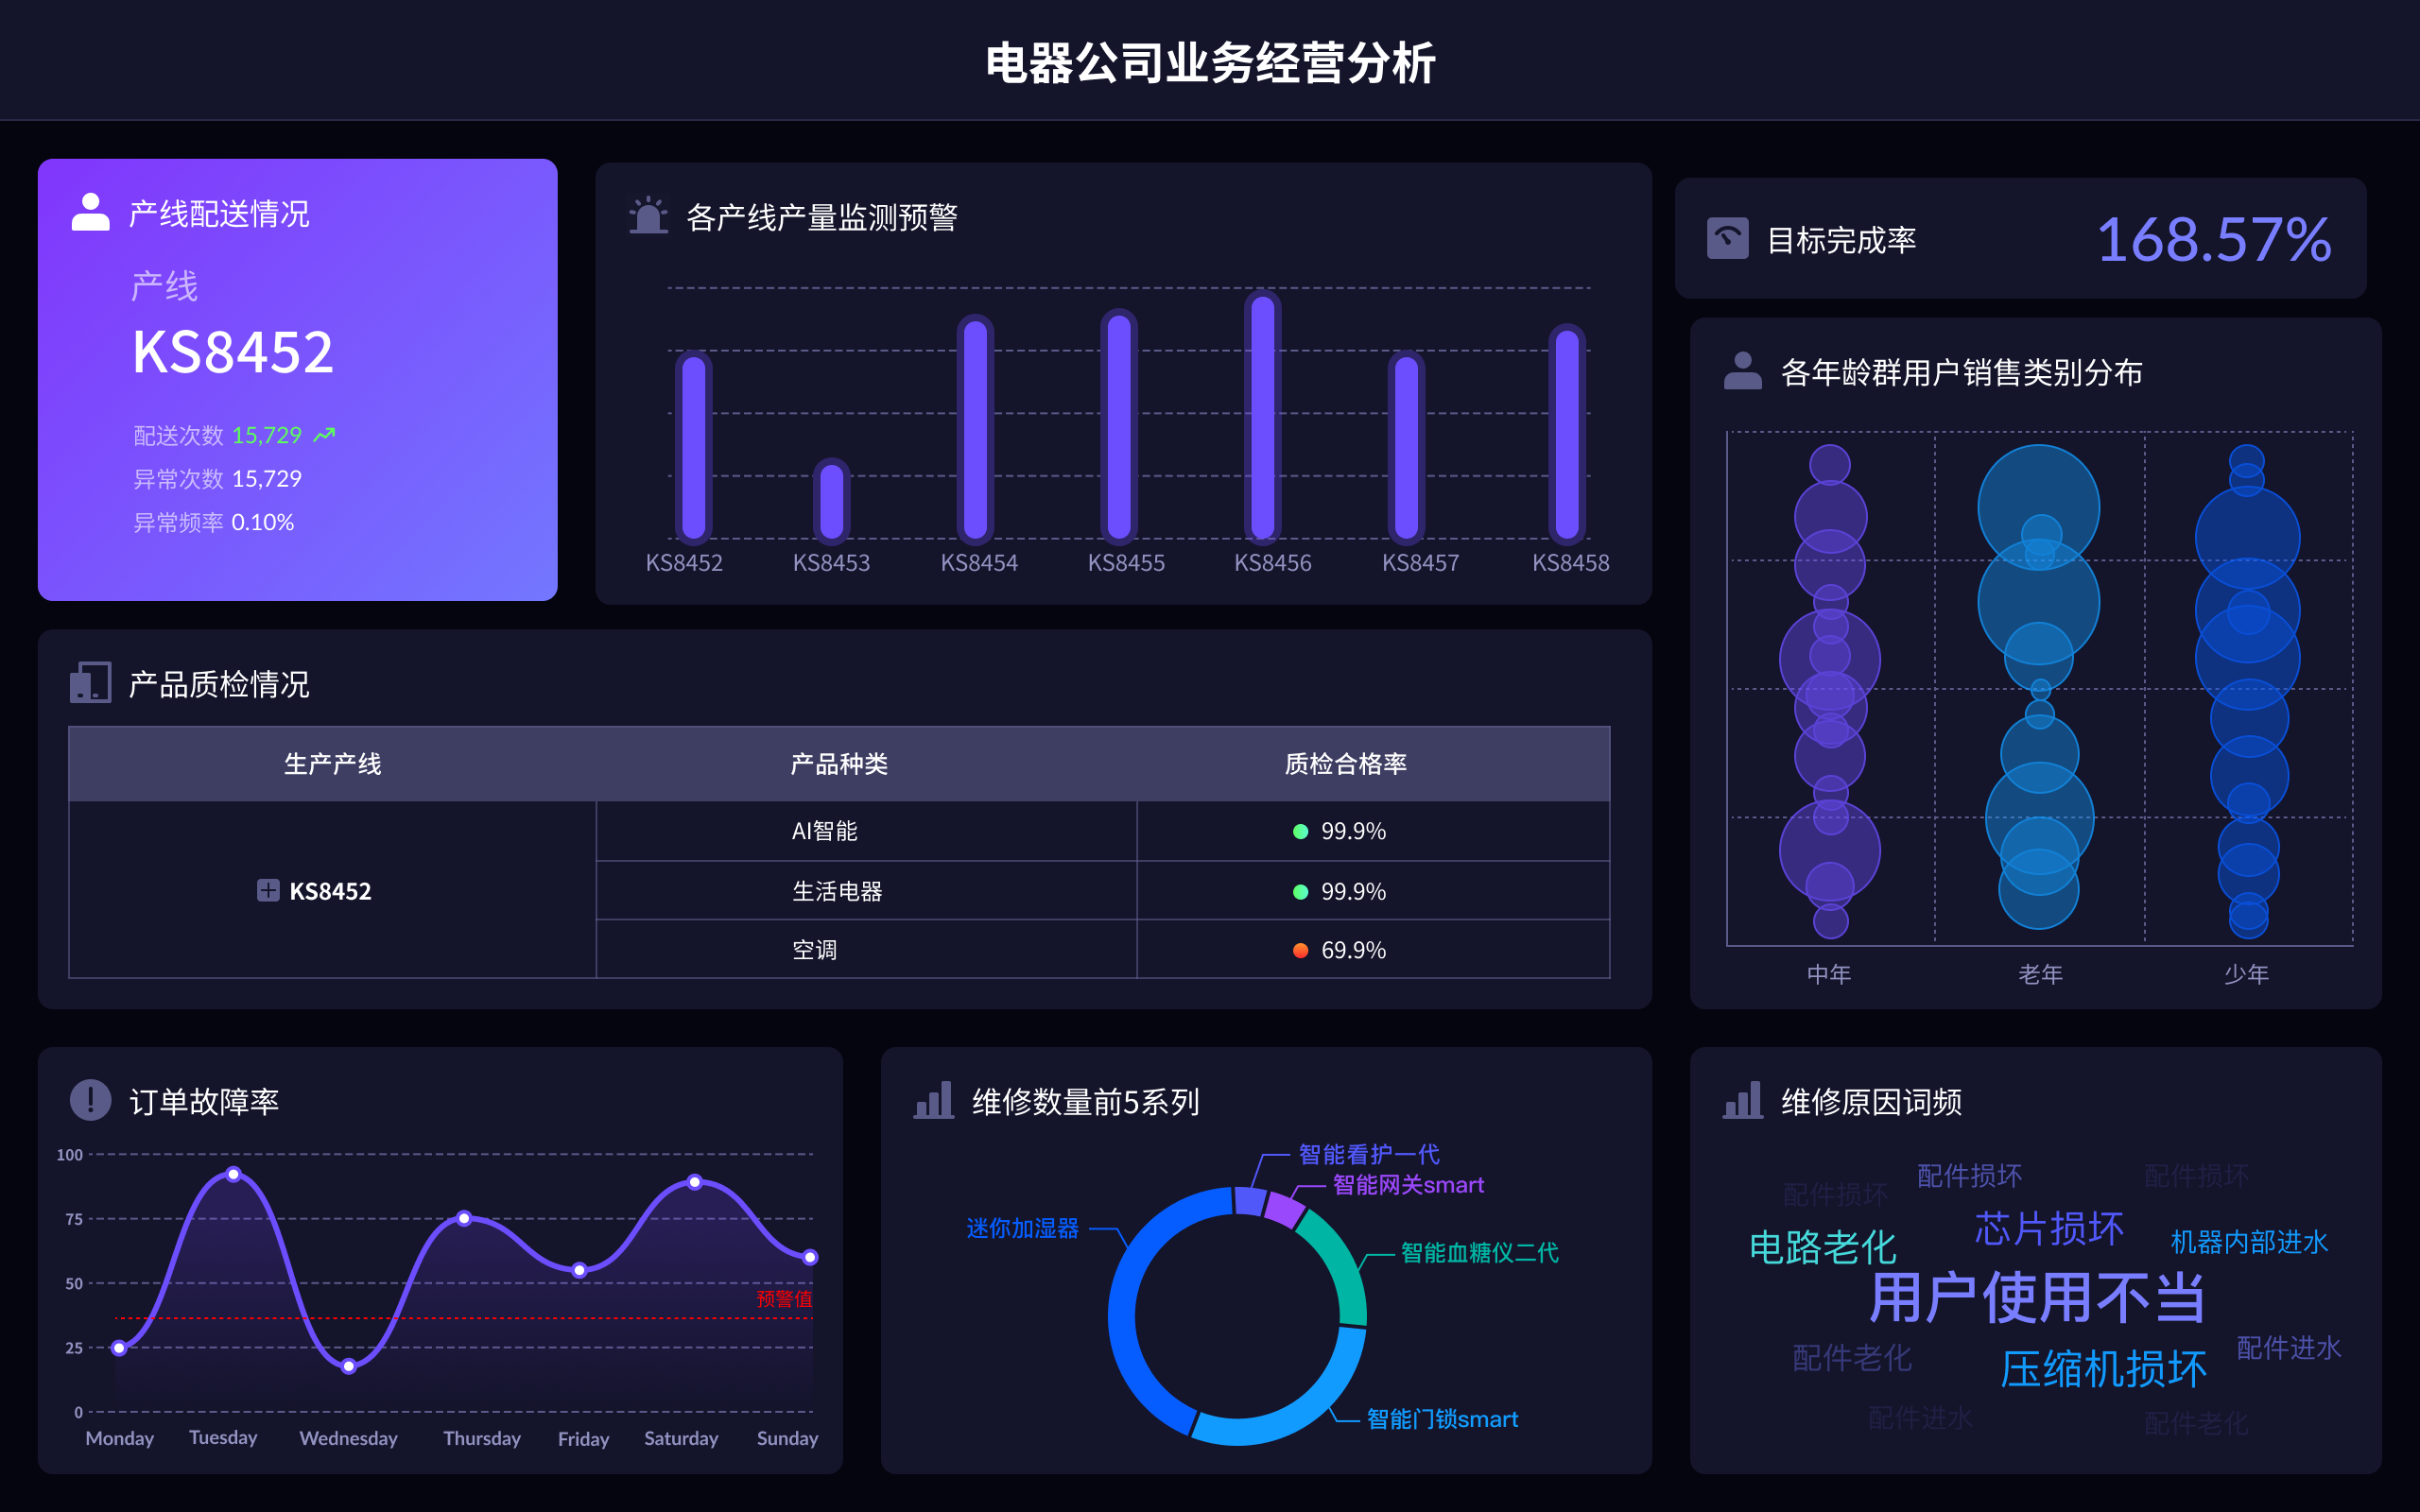
The abbreviation for Big Data Visualization is BDV. This abbreviation is widely recognized in the field of data analysis and technology. BDV combines the massive amounts of data generated every day (Big Data) with visualization techniques to create clear and actionable insights, facilitating better decision-making processes. A detailed example is how businesses utilize BDV to analyze customer behavior patterns, which can lead to improved customer service and targeted marketing strategies.
I. UNDERSTANDING BIG DATA VISUALIZATION (BDV)
Big Data Visualization, commonly abbreviated as BDV, refers to the process of representing large and complex datasets in a visual context, such as graphs, charts, maps, and other graphical formats. The main goal of BDV is to make data analysis more intuitive and accessible, enabling users to see patterns, trends, and correlations that might be missed in text-based data. The importance of BDV has grown alongside the increase in data generation, as traditional data processing methods are often insufficient to handle the volume, velocity, and variety of big data.
Big data is characterized by its massive scale, encompassing not just the sheer volume of data but also the speed at which it is generated and the diversity of data types. BDV tools help to simplify and condense this data into visual formats, making it easier to interpret and act upon. This is crucial in various sectors, including business, healthcare, finance, and science, where decision-making relies heavily on data insights.
II. COMPONENTS OF BIG DATA VISUALIZATION
-
DATA SOURCES AND COLLECTION
Big Data comes from various sources such as social media, IoT devices, transaction records, and more. Collecting this data is the first step in BDV. Effective BDV systems integrate data from these diverse sources seamlessly, ensuring the data is accurate, timely, and relevant. -
DATA PROCESSING AND STORAGE
Once collected, data needs to be processed and stored efficiently. This involves cleaning the data, transforming it into a usable format, and storing it in databases or data warehouses that support rapid querying and retrieval. Technologies such as Hadoop and Spark are often used for processing big data, while storage solutions include cloud-based services like AWS, Azure, and Google Cloud. -
VISUALIZATION TOOLS AND TECHNIQUES
There are various tools and techniques available for creating visual representations of big data. Popular tools include Tableau, Power BI, FineBI, and FineReport, which offer robust features for data visualization. These tools allow users to create interactive dashboards, detailed reports, and dynamic charts that can be easily shared and understood.-
FineBI: A professional business intelligence tool that specializes in big data analysis and visualization. It enables users to explore and analyze data efficiently, providing deep insights through its user-friendly interface and powerful analytical capabilities. More details can be found on the FineBI website.
-
FineReport: Another robust tool focused on reporting and data visualization, FineReport offers a wide range of visualization options and customization features, making it ideal for detailed data reports. Additional information is available on the FineReport website.
-
FineVis: Known for its advanced visualization capabilities, FineVis helps in creating compelling visual stories from data, enhancing the understanding and impact of the data presented. Learn more on the FineVis website.
-
III. APPLICATIONS OF BDV IN VARIOUS SECTORS
-
BUSINESS INTELLIGENCE
Businesses use BDV to gain insights into market trends, customer behavior, and operational efficiency. By visualizing sales data, for example, companies can identify which products are performing well and adjust their strategies accordingly. BDV helps in predicting future trends based on historical data, aiding in strategic planning and competitive analysis. -
HEALTHCARE
In healthcare, BDV is used to visualize patient data, treatment outcomes, and disease patterns. This enables healthcare providers to improve patient care, optimize resource allocation, and conduct epidemiological studies. For instance, visualizing the spread of diseases can help in implementing timely interventions and public health strategies. -
FINANCE
Financial institutions leverage BDV to analyze market data, detect fraud, and manage risks. Visualization of financial data helps in understanding complex market dynamics and making informed investment decisions. BDV tools can also highlight unusual patterns in transaction data, aiding in fraud detection and prevention. -
SCIENCE AND RESEARCH
Researchers utilize BDV to interpret experimental data, visualize scientific phenomena, and communicate findings. BDV is particularly valuable in fields like genomics, climate science, and physics, where data complexity and volume are immense. Visual tools help researchers to identify significant patterns and derive meaningful conclusions from their data.
IV. BENEFITS OF USING BDV
-
ENHANCED DATA UNDERSTANDING
Visual representations make complex data more understandable and accessible. By converting data into visual formats, BDV helps in identifying trends, outliers, and patterns that are not immediately obvious in raw data. -
IMPROVED DECISION-MAKING
BDV supports data-driven decision-making by presenting data in a clear and actionable format. Decision-makers can quickly grasp key insights and make informed choices based on visualized data. -
INCREASED ENGAGEMENT AND COMMUNICATION
Visual data is more engaging and easier to share with others. BDV aids in effective communication of data insights across different departments and stakeholders, fostering a collaborative environment. -
TIME AND COST SAVINGS
By simplifying data analysis, BDV reduces the time and resources needed to interpret complex datasets. This efficiency can lead to cost savings and faster implementation of data-driven strategies.
V. CHALLENGES AND FUTURE OF BDV
-
DATA QUALITY AND INTEGRITY
Ensuring the accuracy and reliability of data is a significant challenge. Poor data quality can lead to misleading visualizations and incorrect conclusions. Continuous monitoring and validation of data sources are crucial to maintaining data integrity in BDV processes. -
SCALABILITY
As data continues to grow, BDV tools must scale effectively to handle increasing volumes and complexity. Developing scalable solutions that can process and visualize big data in real-time remains an ongoing challenge. -
USER SKILL LEVELS
The effectiveness of BDV depends on the user's ability to interpret and interact with visual data. Providing adequate training and support is essential to ensure that users can leverage BDV tools effectively. -
PRIVACY AND SECURITY
Handling large datasets often involves sensitive information. Ensuring data privacy and security is paramount, requiring robust protocols and compliance with regulations to protect data from breaches and misuse.
The future of BDV looks promising with advancements in technology, including AI and machine learning, which are expected to further enhance the capabilities of data visualization tools. Integrating these technologies can lead to more sophisticated and intelligent visualizations, offering deeper insights and more accurate predictions.
In conclusion, Big Data Visualization (BDV) is a crucial aspect of modern data analysis, transforming massive and complex datasets into actionable insights. By leveraging tools like FineBI, FineReport, and FineVis, organizations can enhance their understanding of data, improve decision-making, and drive innovation across various sectors. The continued evolution of BDV will undoubtedly play a significant role in shaping the future of data analytics.
相关问答FAQs:
常见问题解答
大数据可视化英文缩写是什么?
大数据可视化的英文缩写是 “Big Data Visualization”,但通常没有专门的缩写。它描述了将大数据集通过图形、图表和其他视觉工具转化为易于理解的格式的过程。大数据可视化使得复杂的数据集更加直观,帮助用户发现数据中的趋势、模式和异常。这个过程涉及各种工具和技术,包括数据仪表盘、热图、散点图和网络图等,以便在处理和分析大数据时提供清晰的视图和洞察力。
大数据可视化的主要应用场景是什么?
大数据可视化在多个领域都能发挥重要作用。企业通常使用它来分析市场趋势和消费者行为,从而做出更加数据驱动的决策。在医疗领域,大数据可视化帮助研究人员和医生识别疾病模式和患者趋势,提高诊断精确度和治疗效果。在金融行业,数据可视化帮助分析风险和投资机会,优化财务决策。教育和政府部门也使用数据可视化来评估和展示各种公共政策的效果和社会趋势。通过这些应用场景,大数据可视化不仅提升了数据分析的效率,还增强了各领域决策的科学性。
在进行大数据可视化时常用的工具有哪些?
在大数据可视化的实践中,有许多工具可以帮助用户有效地展示数据。最常用的工具包括 Tableau、Power BI 和 QlikView,它们提供了丰富的图表类型和数据处理能力,使得用户能够创建交互式仪表盘和详细的报告。D3.js 是一种流行的 JavaScript 库,允许开发者创建高度定制的视觉效果。对于更复杂的数据处理需求,Apache Superset 和 Grafana 也被广泛使用,它们能够处理大规模数据集并进行实时分析。此外,Python 和 R 这类编程语言的可视化库,如 Matplotlib 和 ggplot2,也在数据科学和分析中占有重要地位。通过这些工具,用户能够将数据以最具洞察力和吸引力的方式呈现出来。
本文内容通过AI工具匹配关键字智能整合而成,仅供参考,帆软不对内容的真实、准确或完整作任何形式的承诺。具体产品功能请以帆软官方帮助文档为准,或联系您的对接销售进行咨询。如有其他问题,您可以通过联系blog@fanruan.com进行反馈,帆软收到您的反馈后将及时答复和处理。


