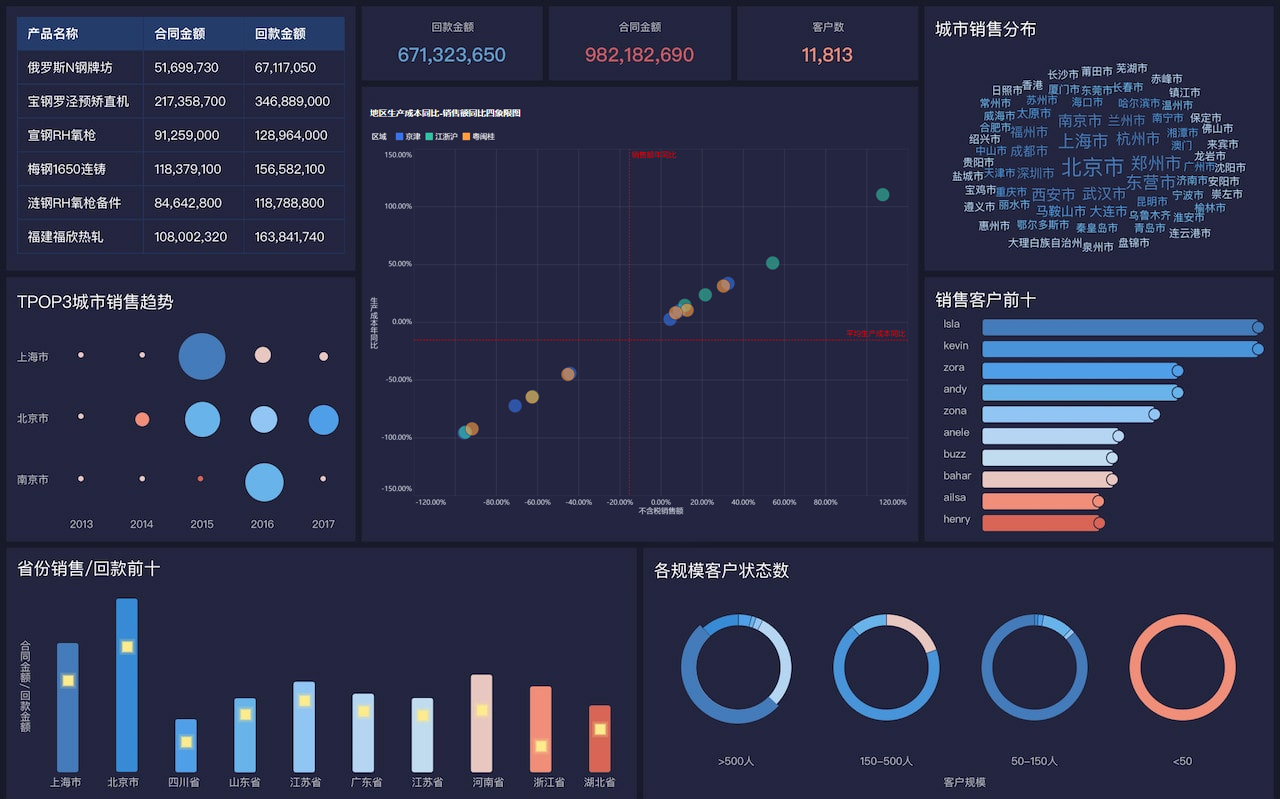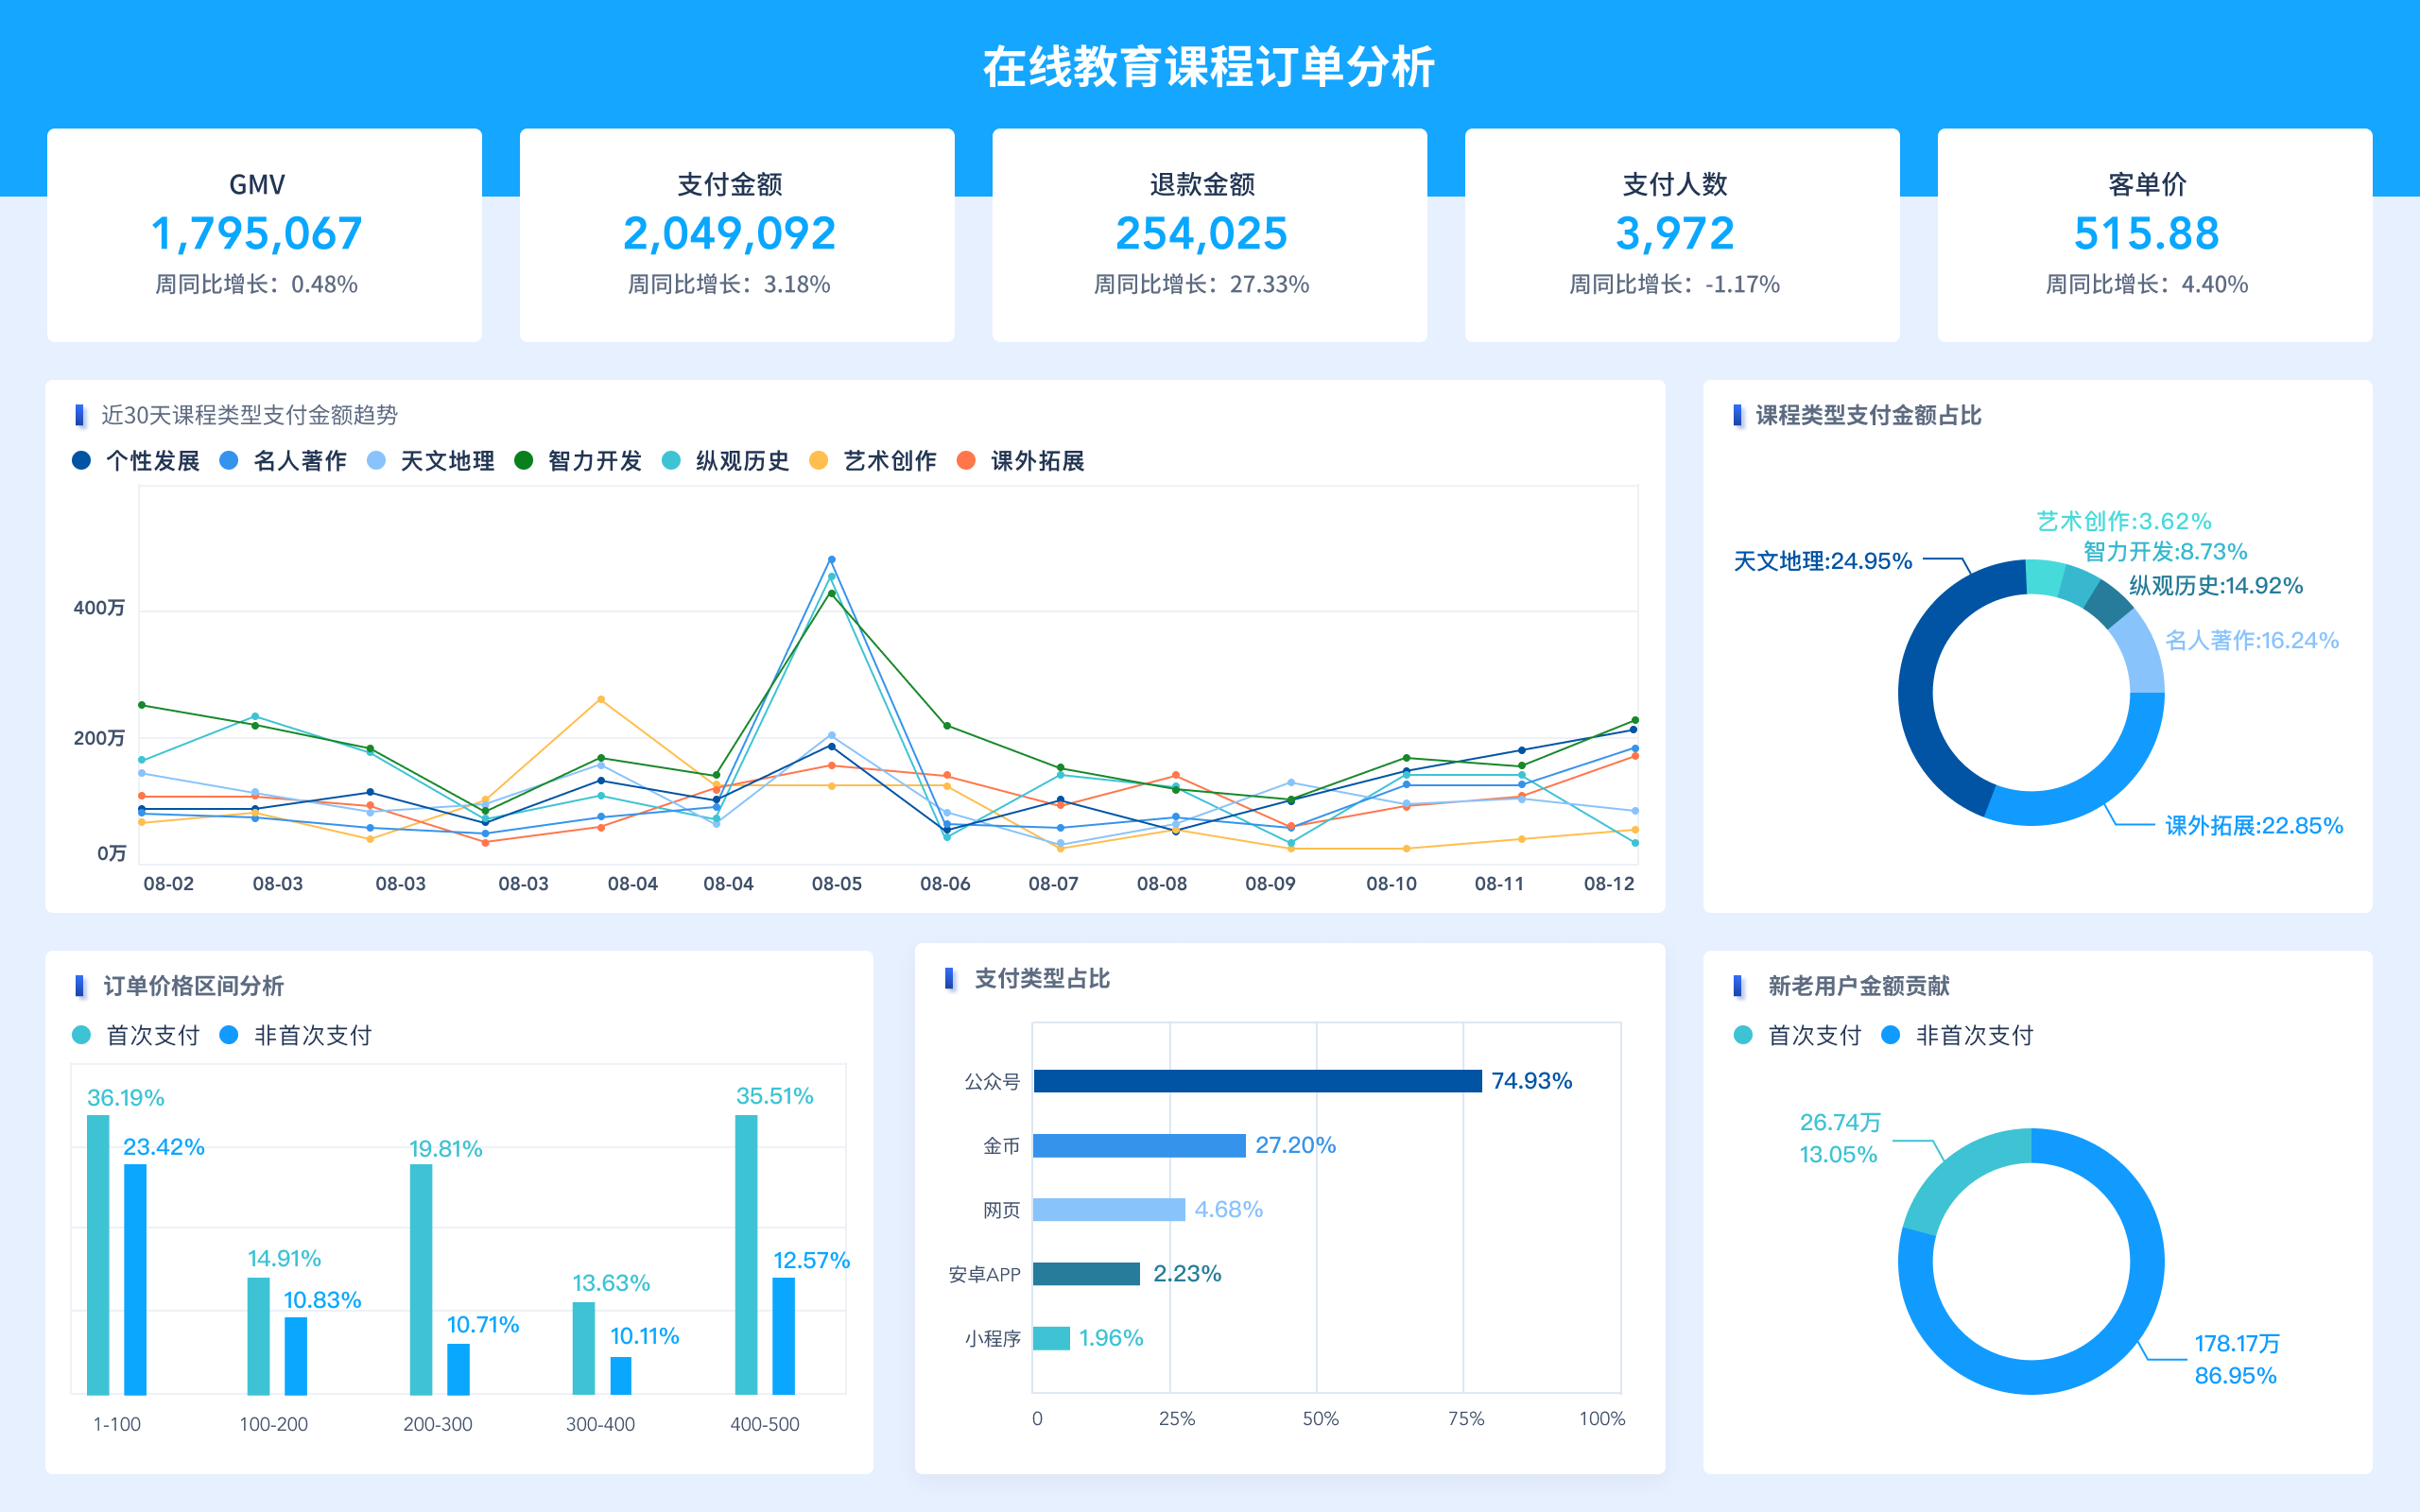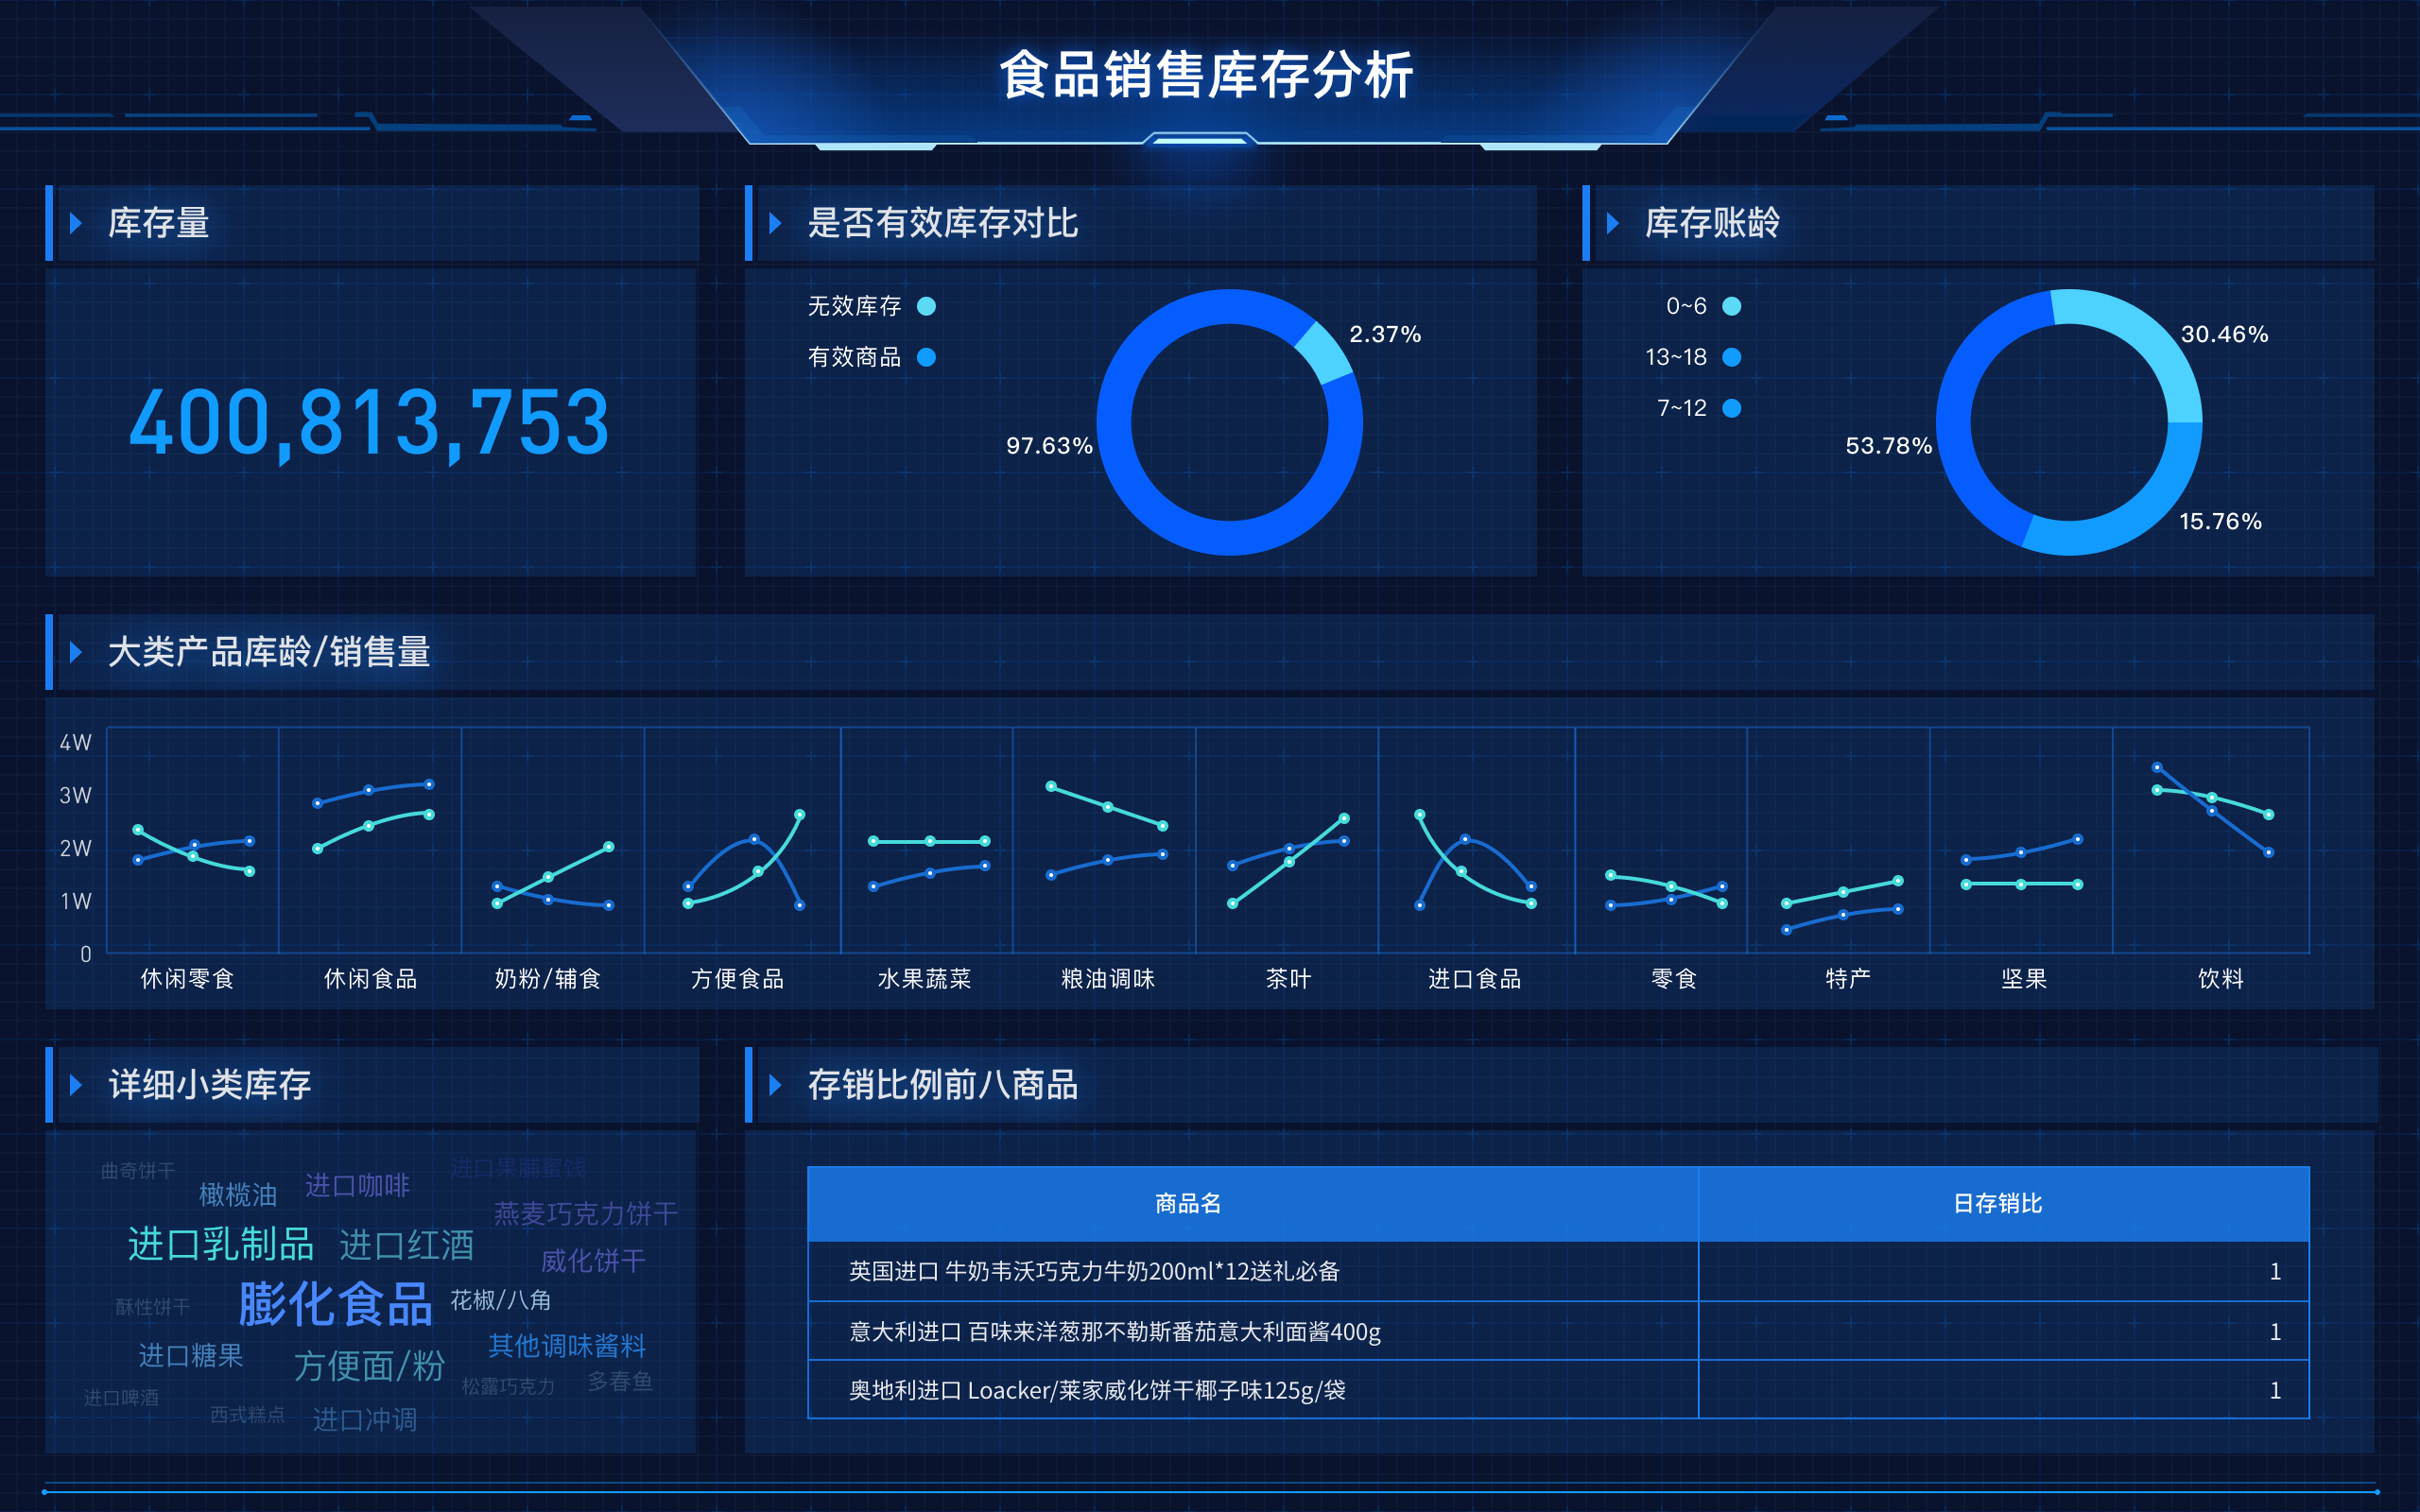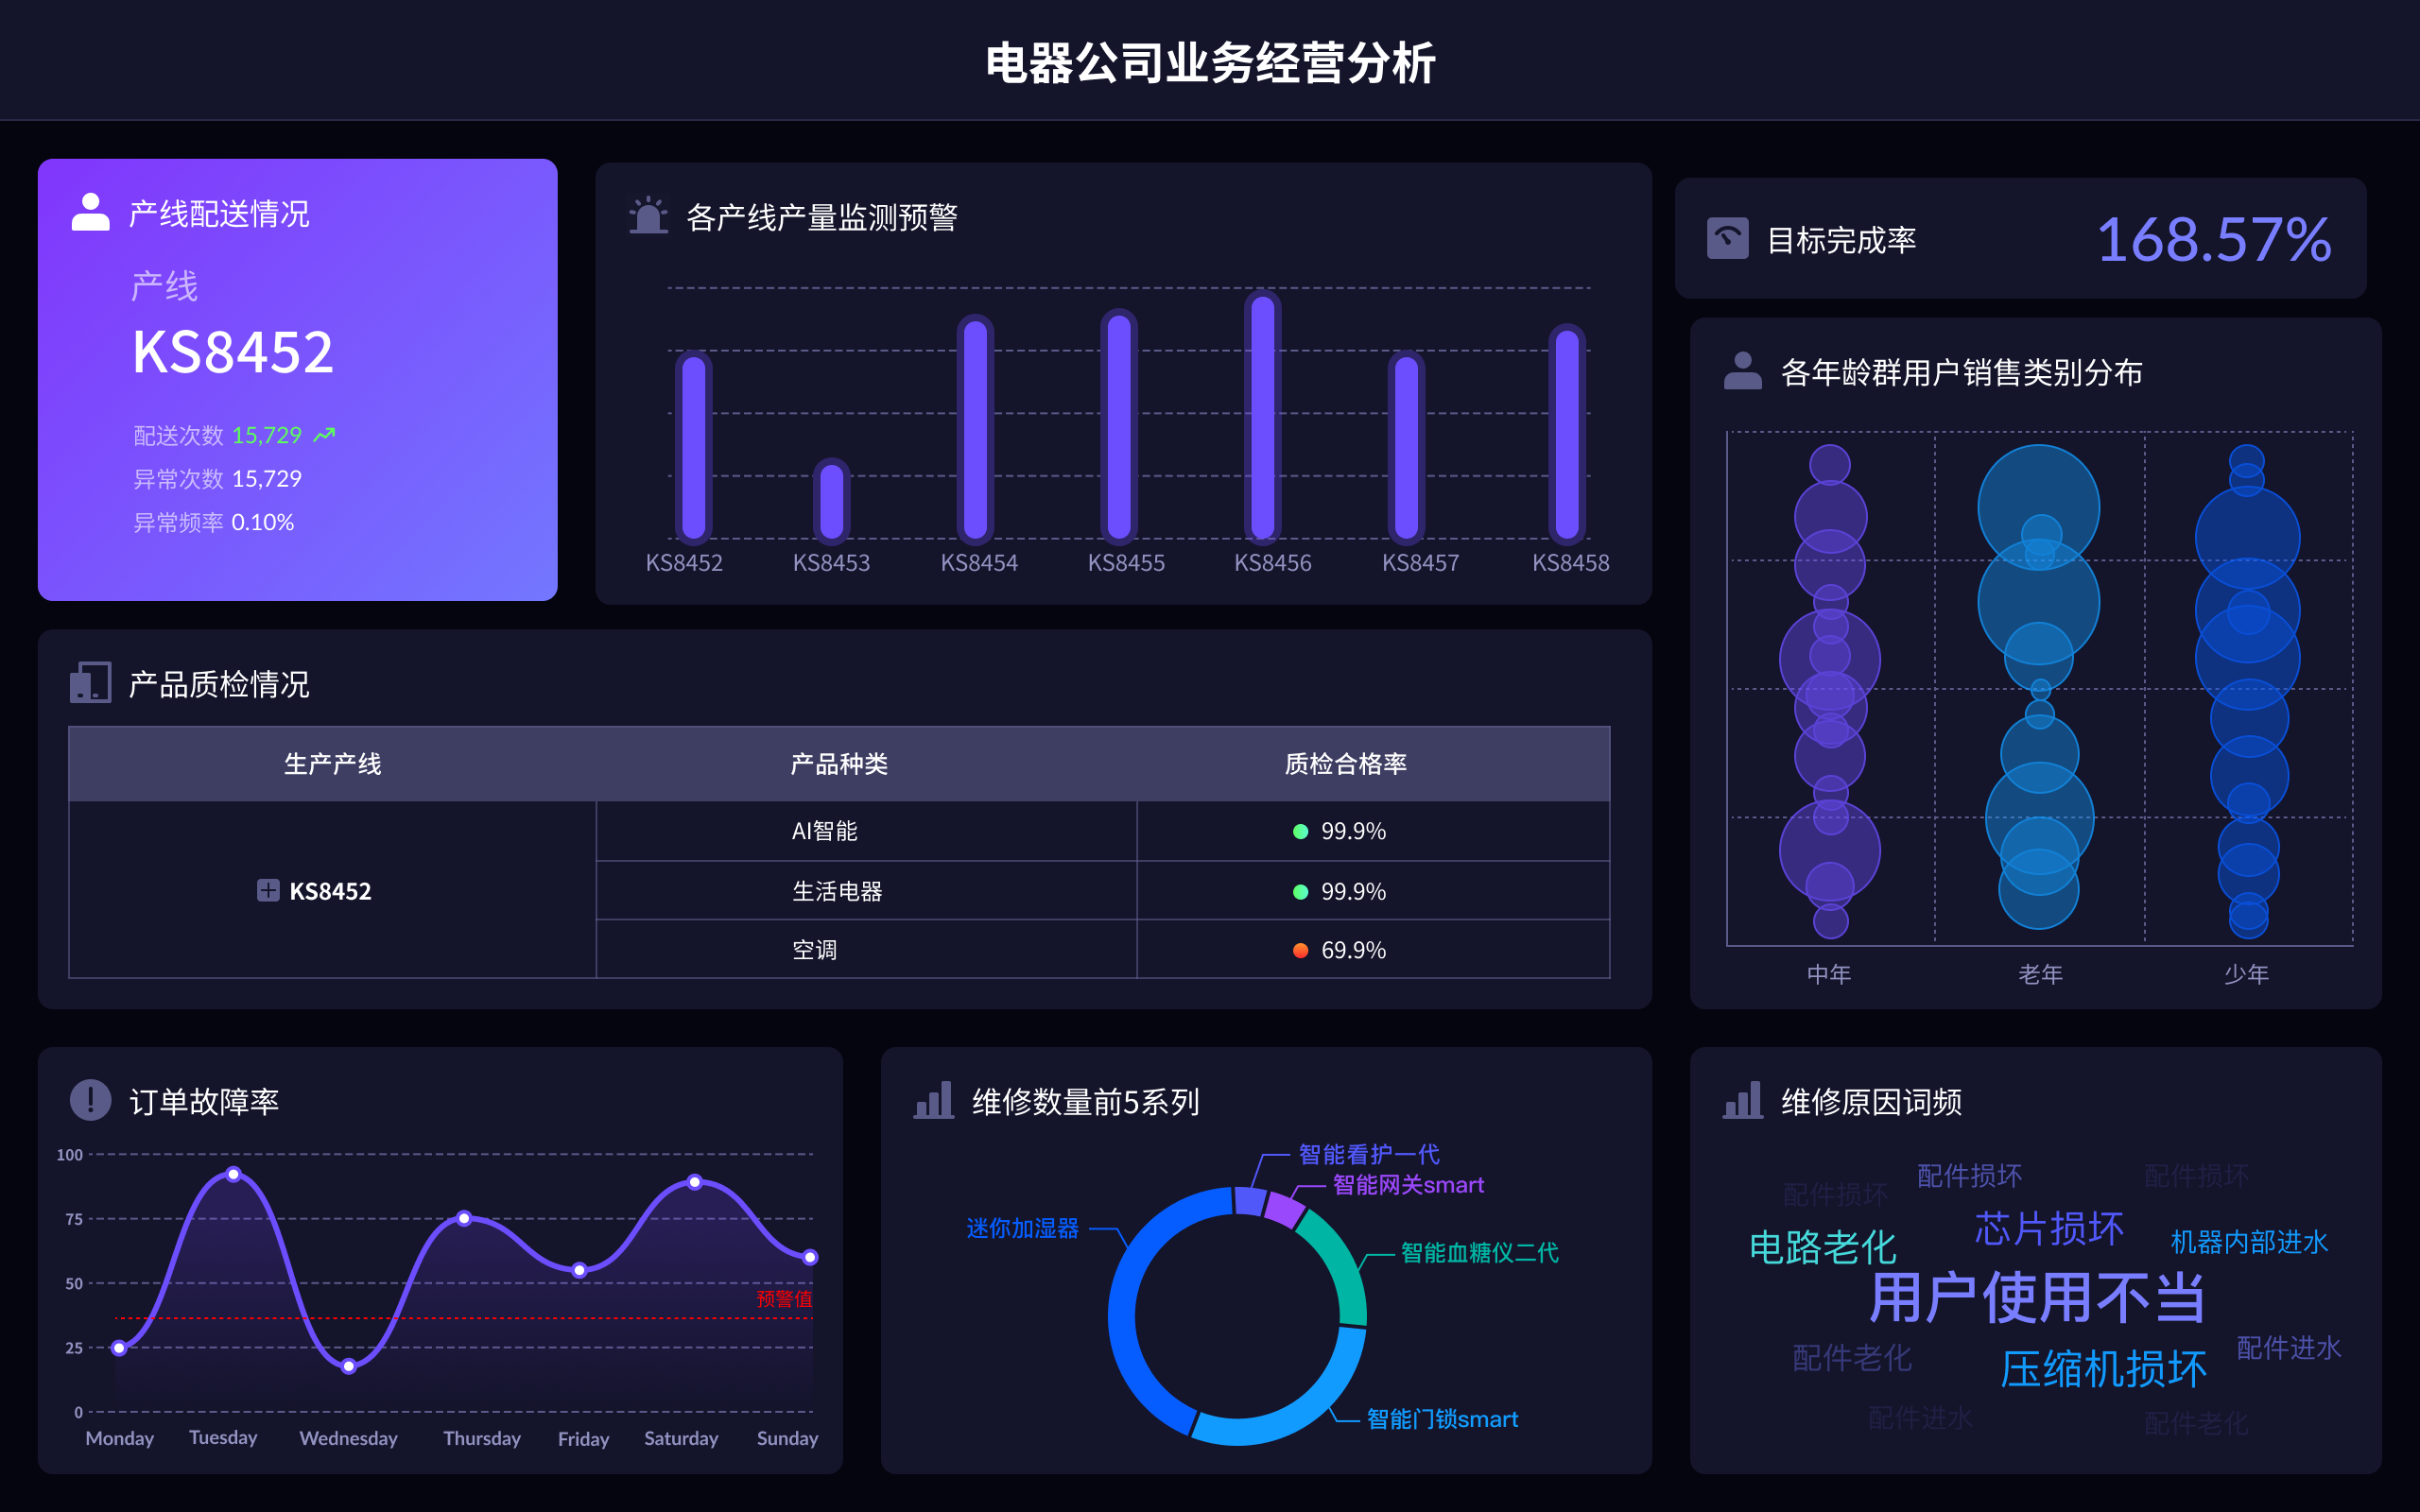
"Big Data Visualization" is the English term for "大数据可视化".
相关问答FAQs:
What is the English term for 大数据可视化?
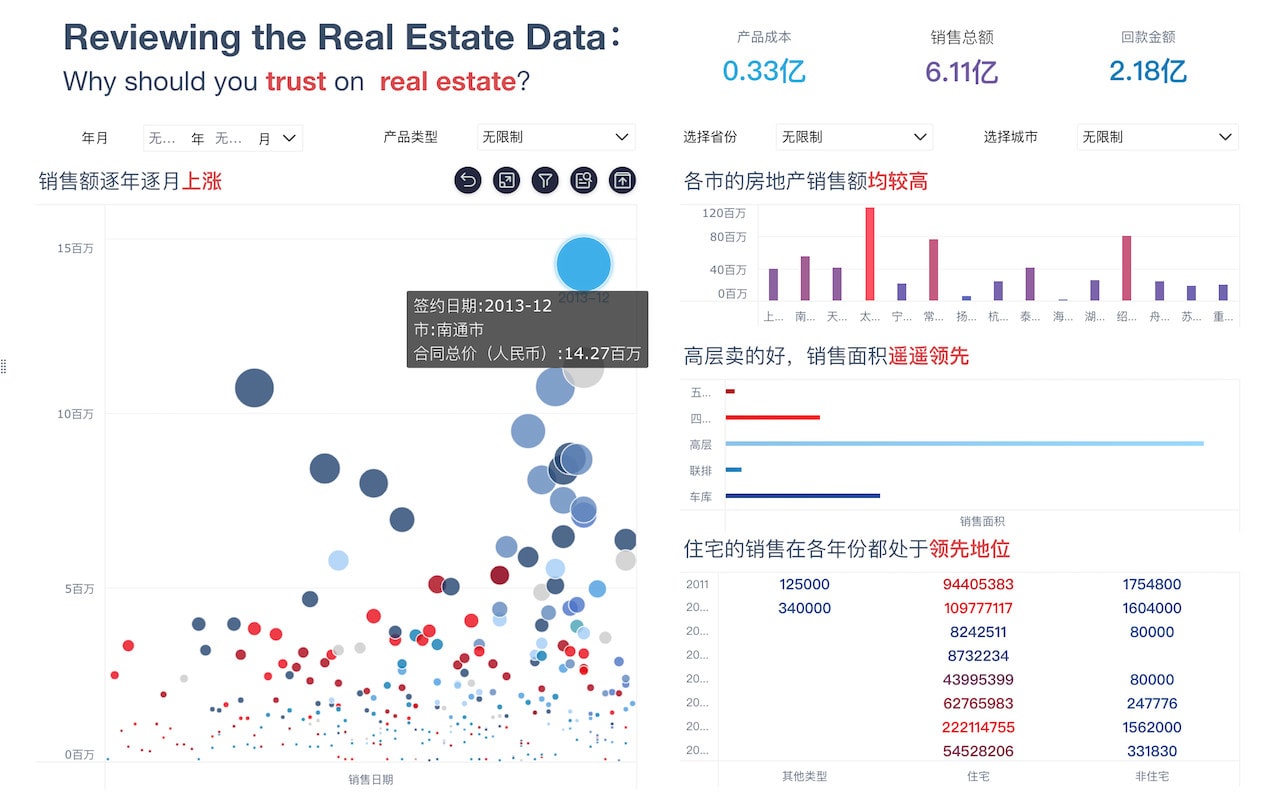
The English term for 大数据可视化 is "Big Data Visualization." This term is used to describe the graphical representation of complex data sets to make them easier to understand and analyze. In various fields such as business, science, and technology, big data visualization helps to transform raw data into visual formats like charts, graphs, and maps, which can reveal patterns, trends, and insights that might not be immediately apparent from the raw data alone. Effective big data visualization is crucial for making data-driven decisions and communicating findings to stakeholders.
Why is Big Data Visualization important?
Big Data Visualization plays a pivotal role in understanding large and complex data sets. By converting data into visual formats, it helps in several key areas:
-
Enhanced Understanding: Visualizations make it easier to grasp intricate details and trends within the data, which can be challenging to understand through raw numbers alone.
-
Effective Communication: Visual tools can communicate findings more clearly to various audiences, including those without a technical background. This is crucial for decision-making processes in business and policy-making.
-
Pattern Recognition: Visual representations of data can highlight patterns, correlations, and anomalies that might be missed in traditional data analysis methods.
-
Decision-Making: By providing a clearer view of data, visualization aids in making informed decisions quickly and accurately, which is essential in fast-paced environments.
Overall, Big Data Visualization is instrumental in leveraging data effectively to drive strategic initiatives and achieve organizational goals.
What are some common tools used for Big Data Visualization?
There are several tools available for Big Data Visualization, each offering unique features and capabilities. Some of the most popular ones include:
-
Tableau: Known for its user-friendly interface and powerful visualization capabilities, Tableau allows users to create interactive and shareable dashboards. It is widely used for its ability to handle large data sets and integrate with various data sources.
-
Power BI: Developed by Microsoft, Power BI is a robust tool for data visualization and business intelligence. It offers a range of visualization options and integrates seamlessly with other Microsoft products, making it a popular choice for organizations using Microsoft ecosystems.
-
D3.js: This JavaScript library is highly versatile and allows for the creation of custom and interactive data visualizations on the web. It provides extensive control over the appearance and behavior of visualizations, making it suitable for complex and bespoke visualizations.
-
QlikView: QlikView is known for its associative data model, which allows users to explore data freely and uncover insights that may not be immediately visible. It offers a variety of visualization options and is useful for in-depth data analysis.
-
Looker: Looker provides a platform for data exploration and visualization with a focus on business intelligence. It allows users to create custom reports and dashboards, and its integration with various data sources enhances its functionality.
These tools vary in complexity and features, so the choice of tool often depends on the specific needs of the user and the complexity of the data being visualized.
本文内容通过AI工具匹配关键字智能整合而成,仅供参考,帆软不对内容的真实、准确或完整作任何形式的承诺。具体产品功能请以帆软官方帮助文档为准,或联系您的对接销售进行咨询。如有其他问题,您可以通过联系blog@fanruan.com进行反馈,帆软收到您的反馈后将及时答复和处理。


