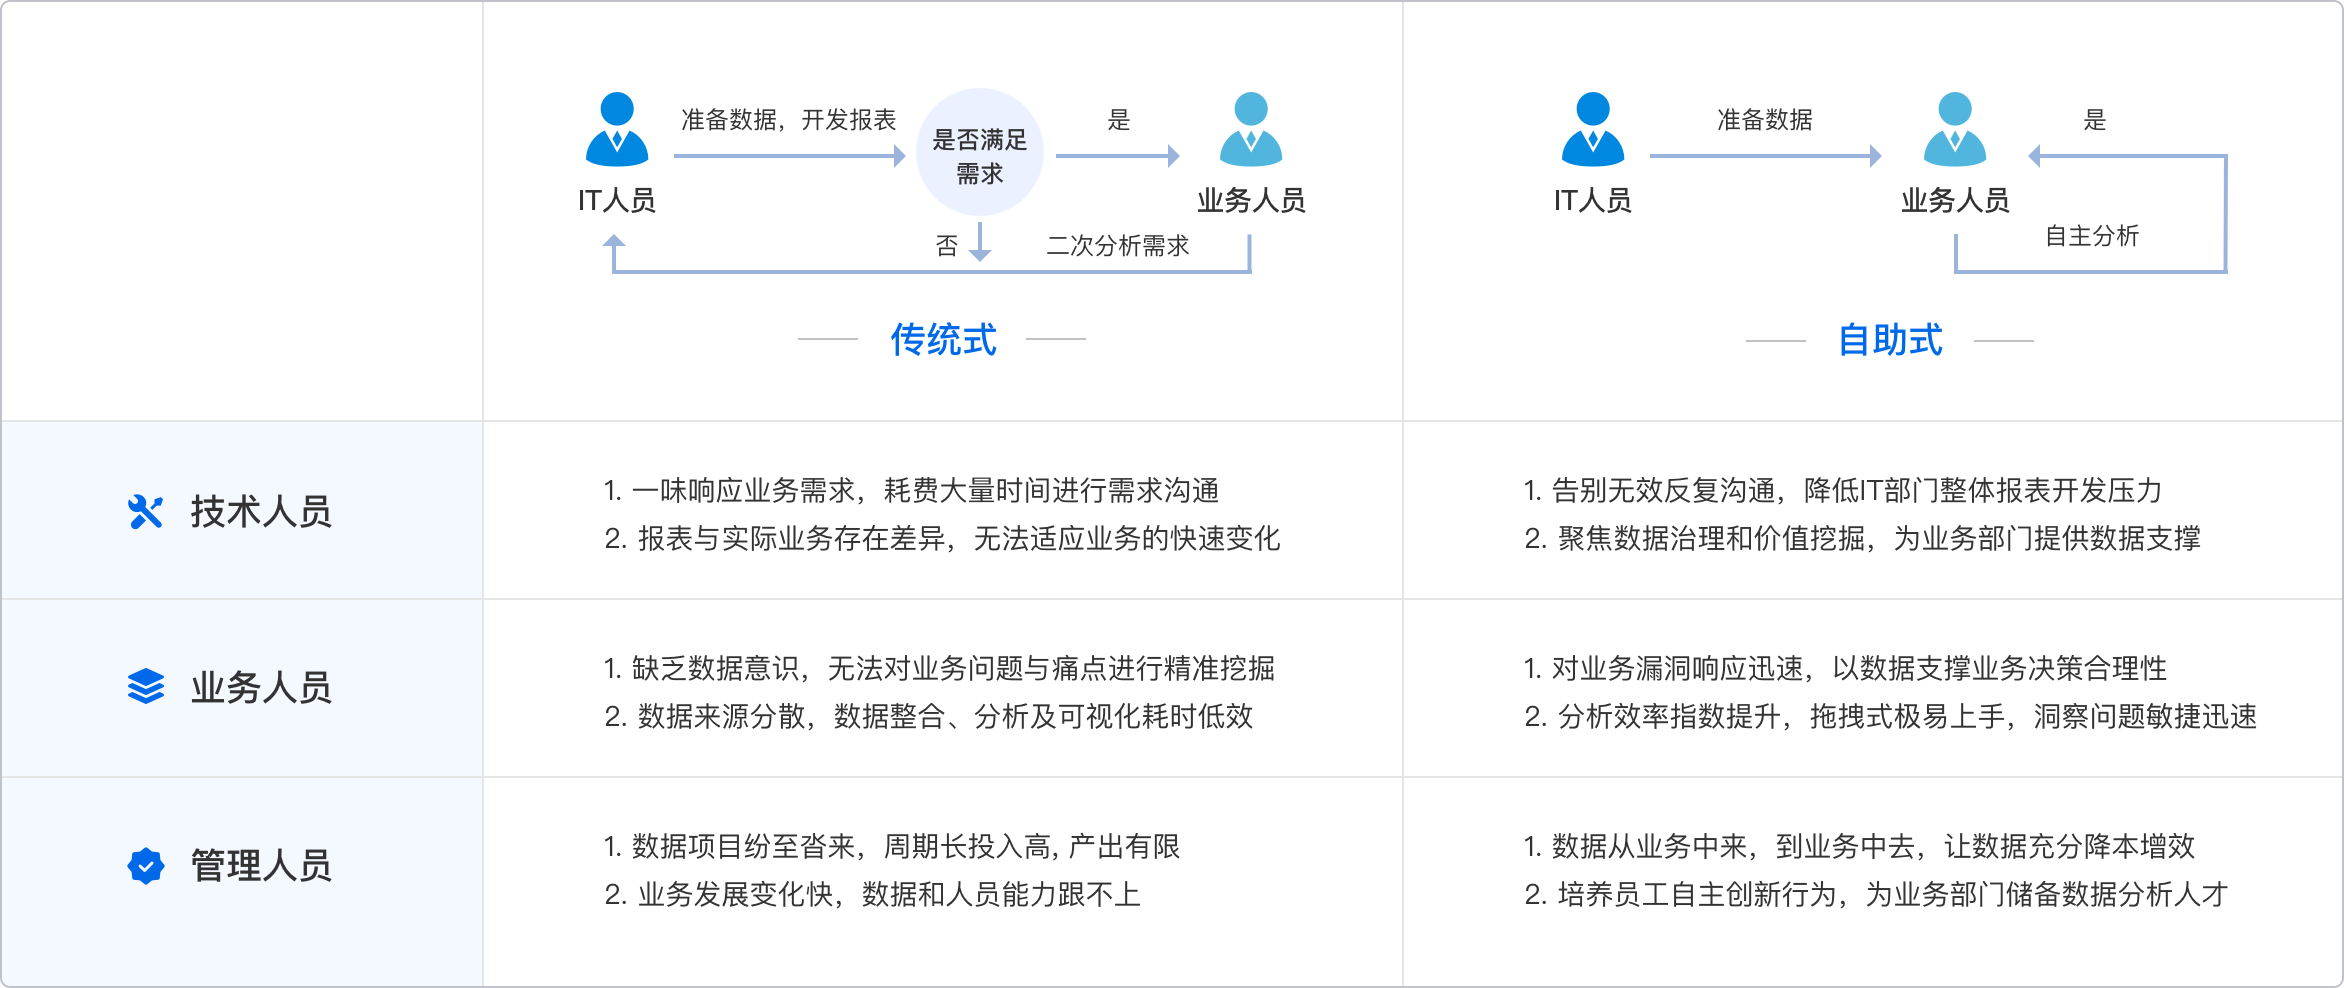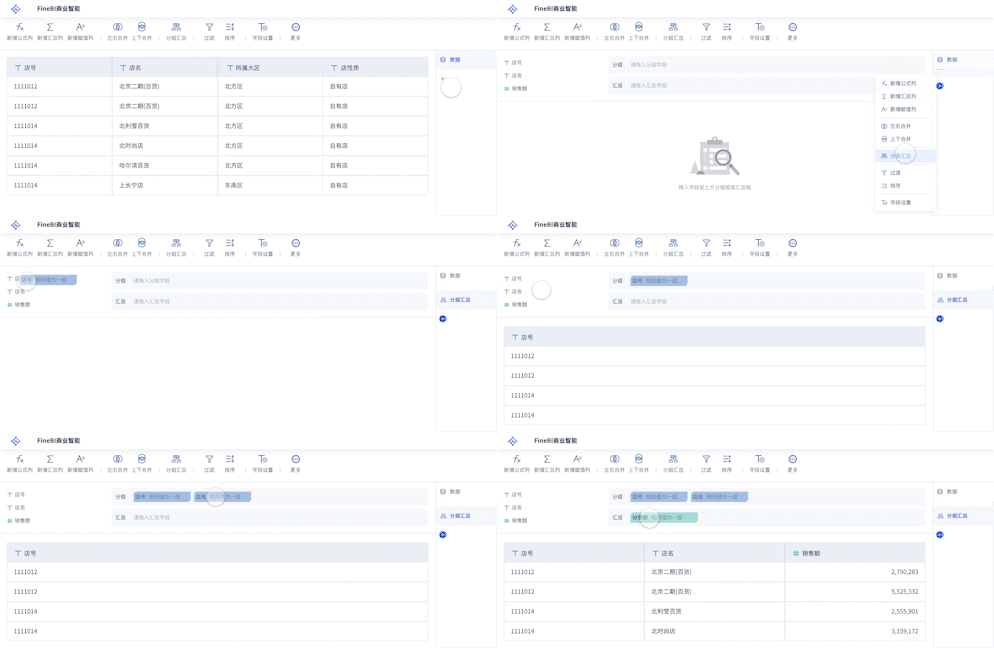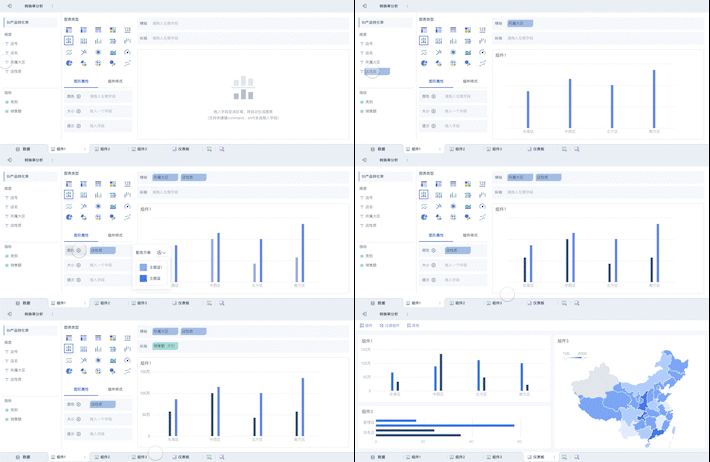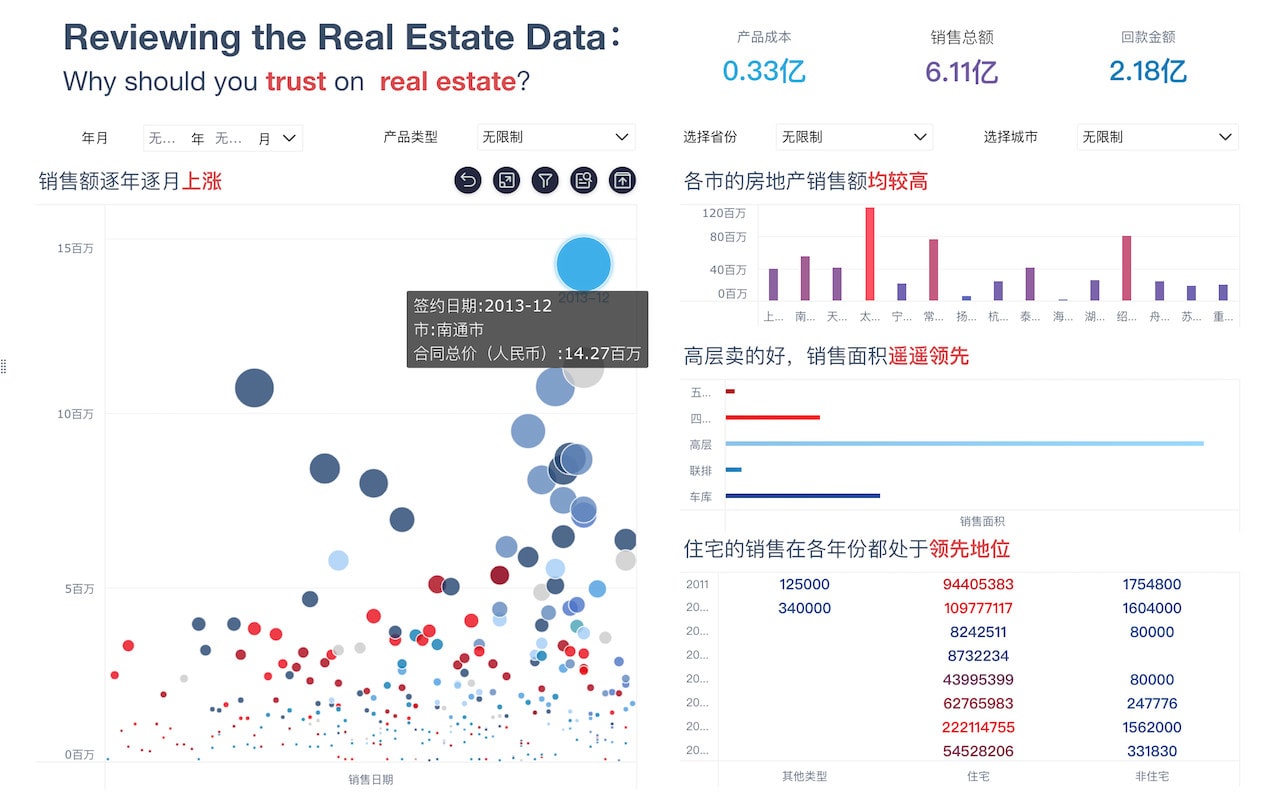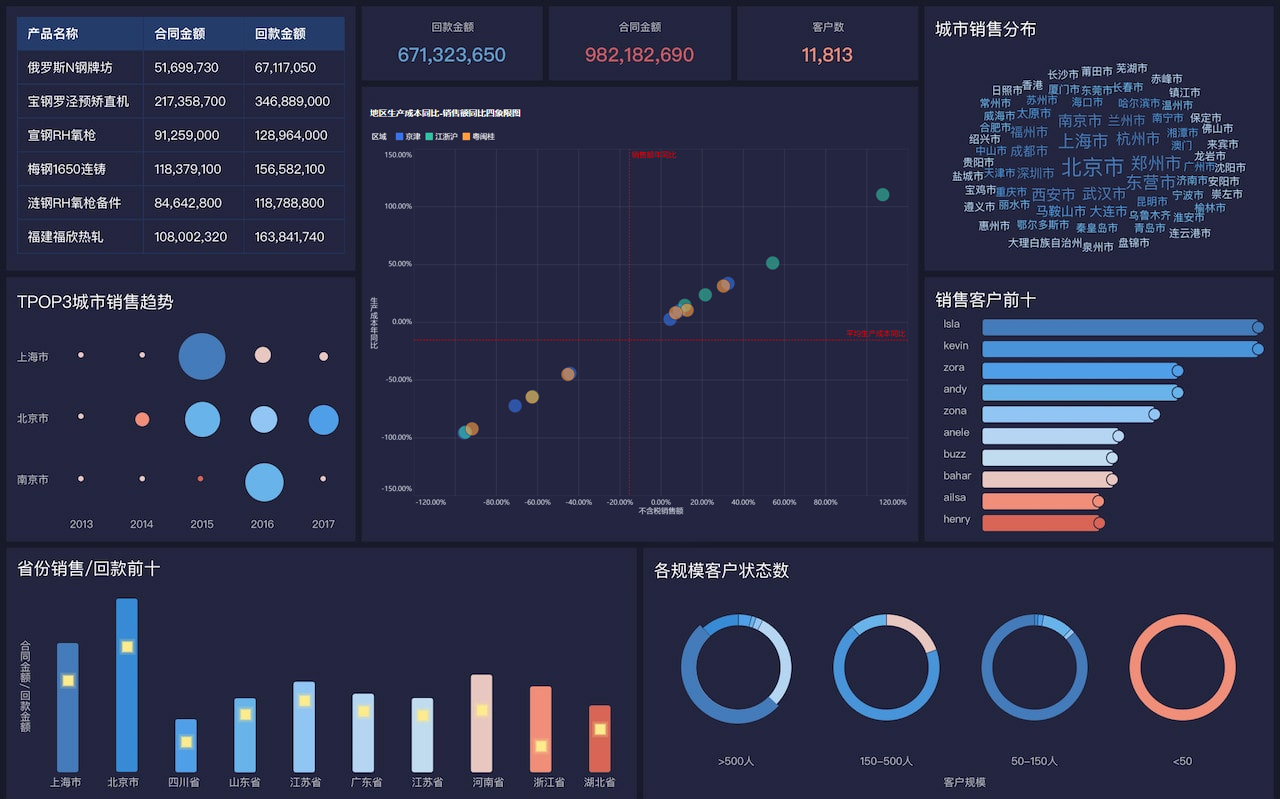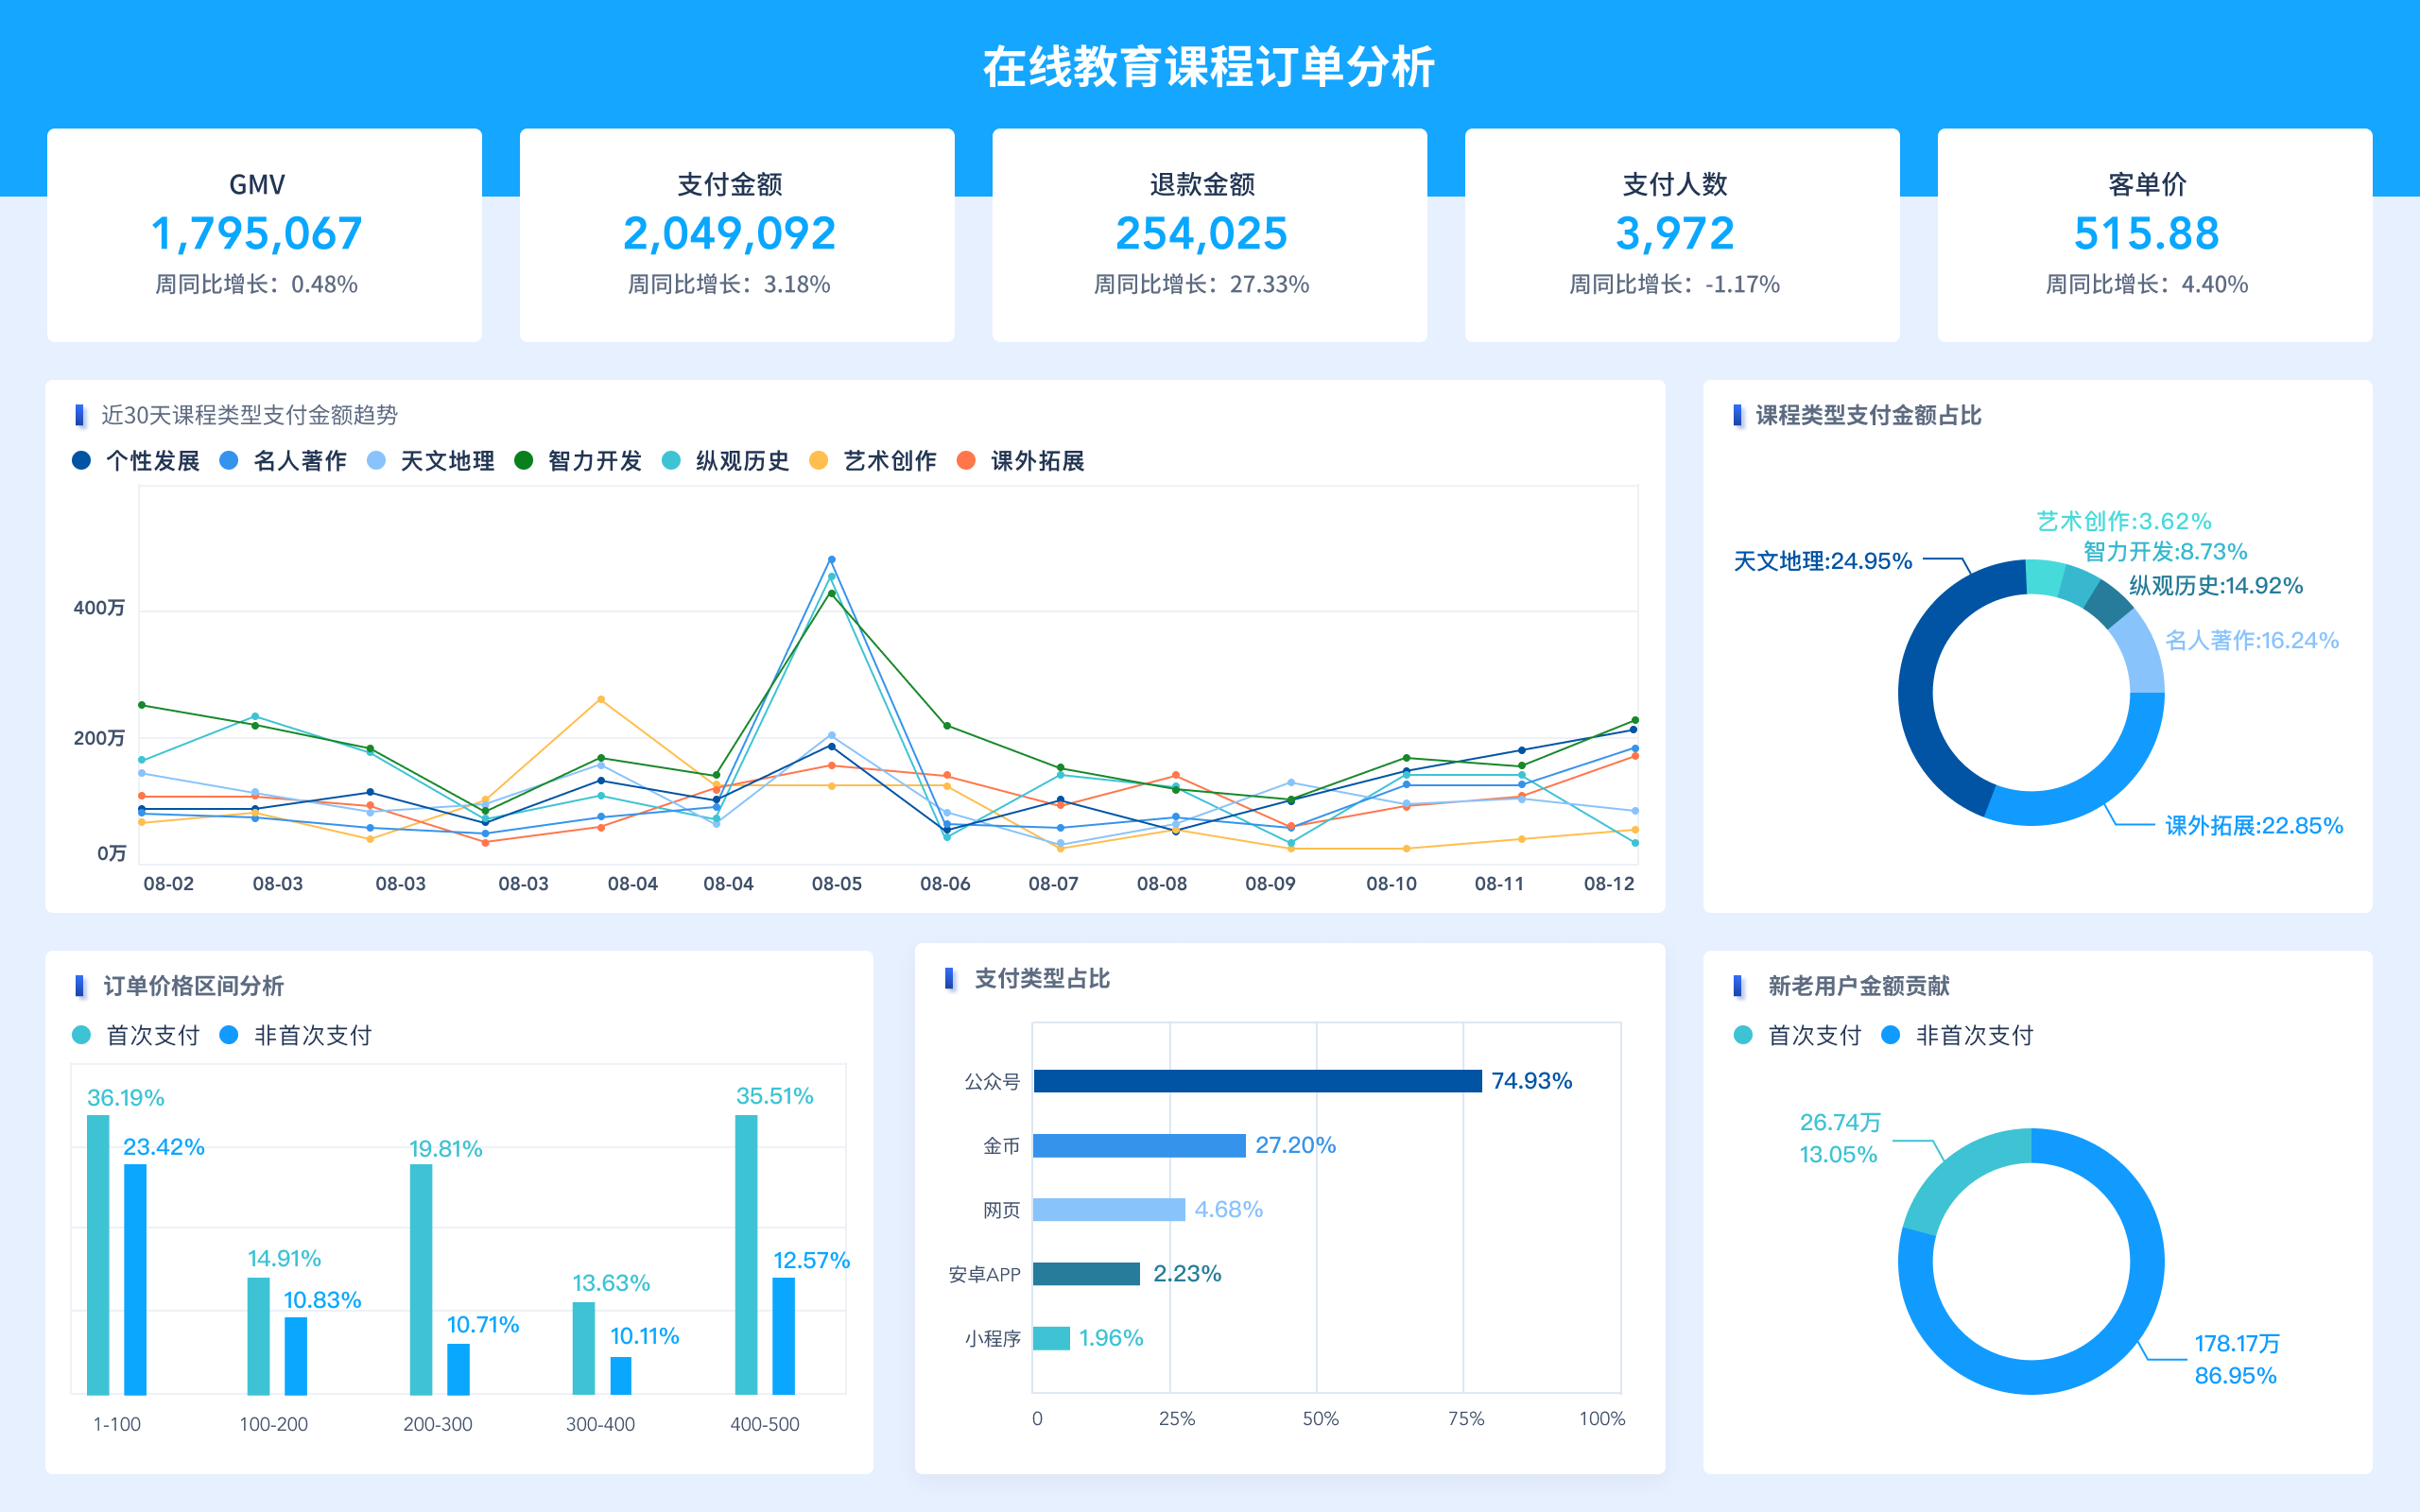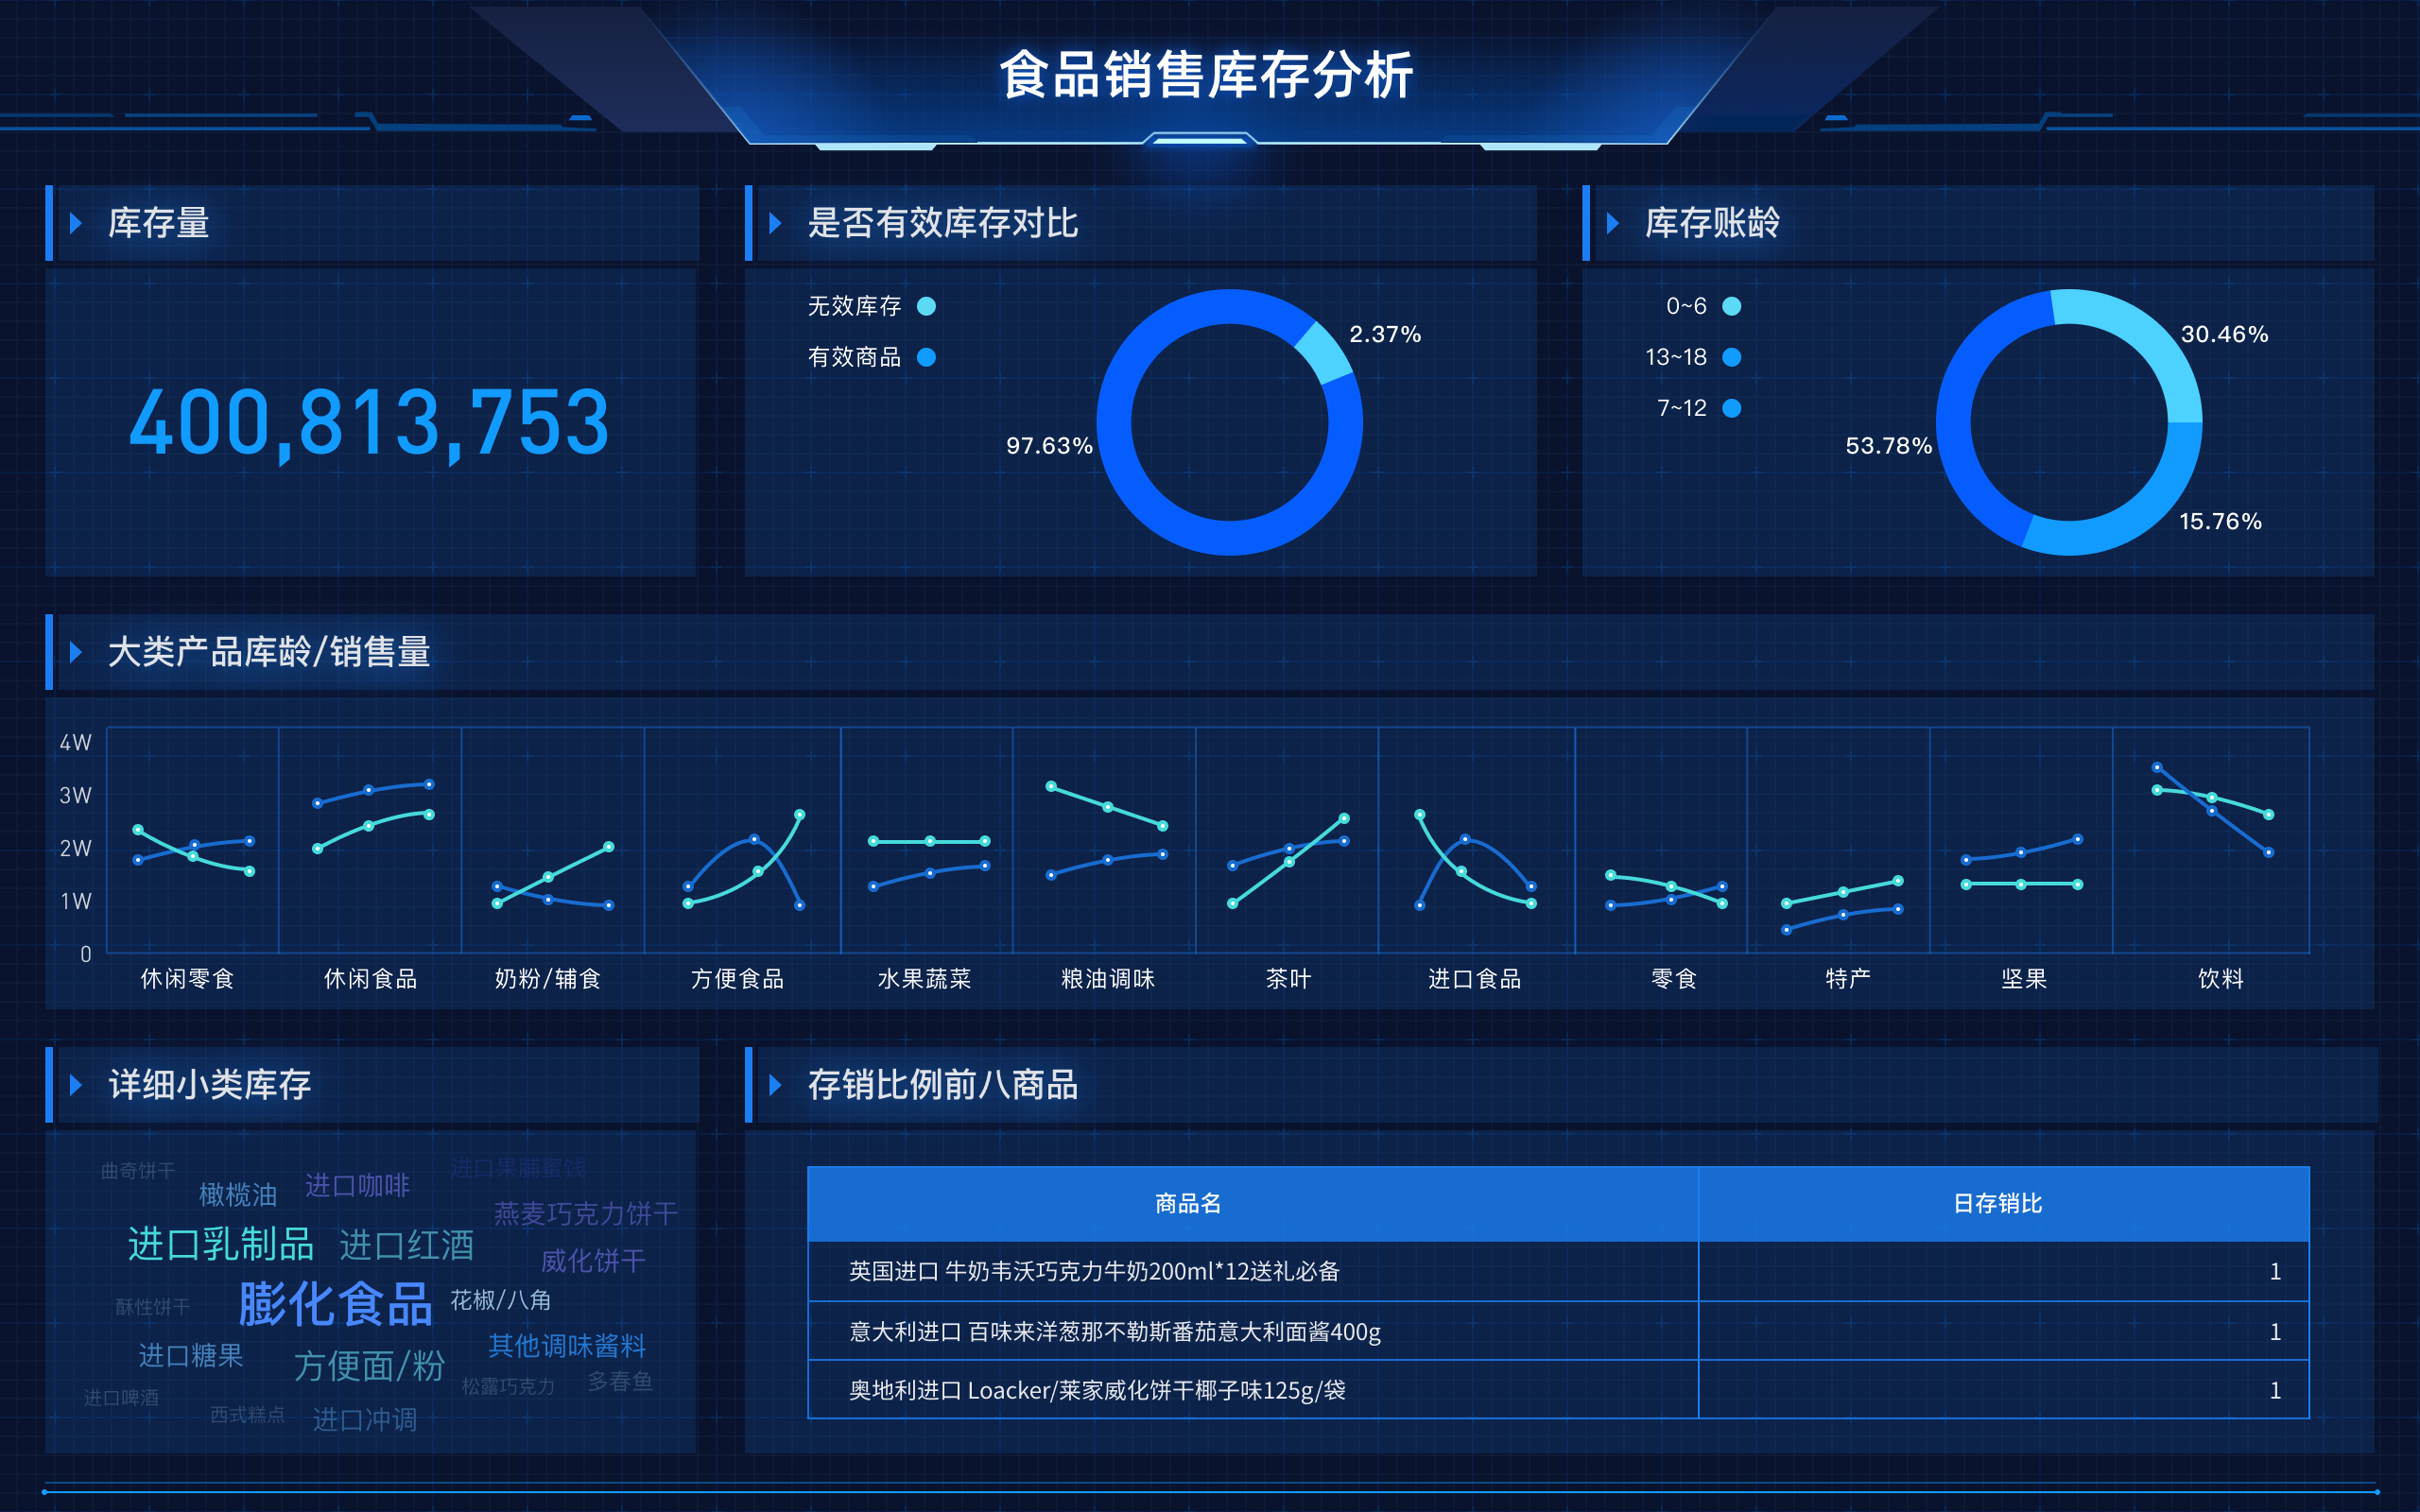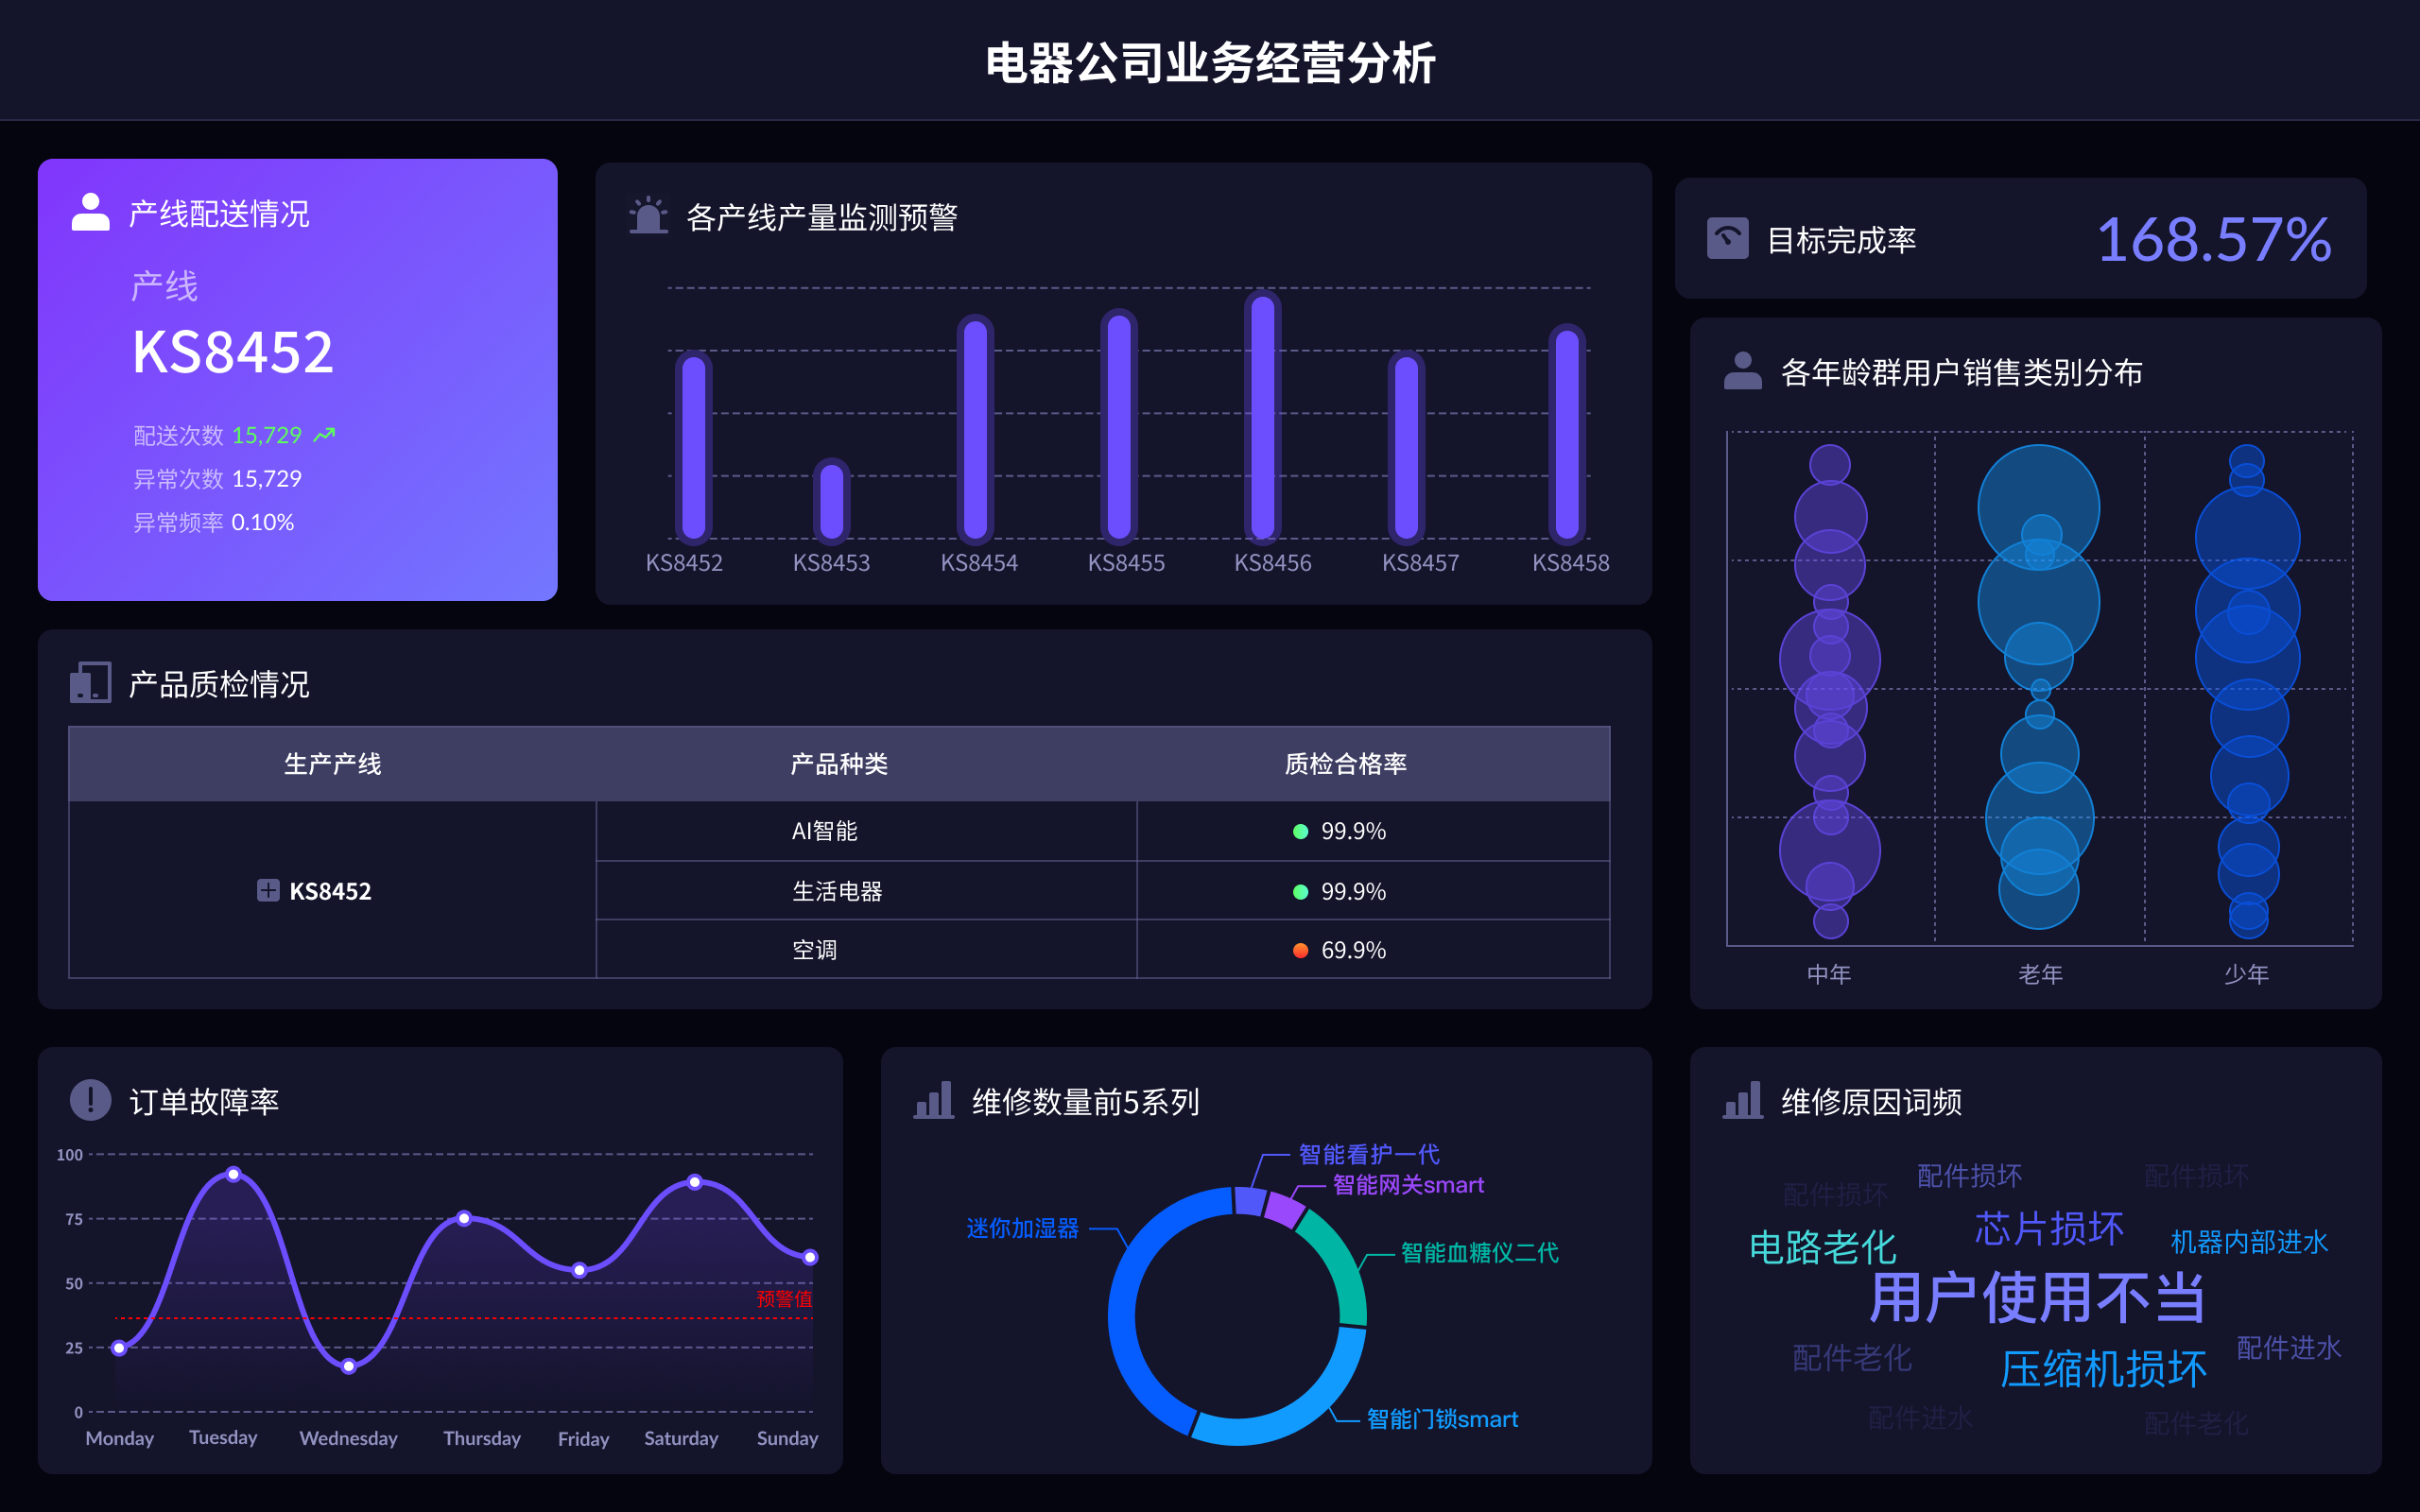
错误的数据可视化问题的解决方法包括:清洗数据、选择适当的可视化类型、优化图表设计、提高数据质量。清洗数据是关键的一步,因为原始数据中可能存在错误、缺失值或不一致的情况。清洗数据可以确保图表准确反映数据的实际情况,从而避免误导读者。通过使用数据清洗工具或编写脚本,可以自动化处理大部分常见问题,例如删除重复项、填补缺失值和标准化数据格式。选择适当的可视化类型也很重要,不同类型的图表适用于不同的数据集和分析需求,确保所选图表能够直观且有效地传达信息。
一、清洗数据
数据清洗是解决错误数据可视化的基础步骤。清洗数据包括以下几个方面:
-
处理缺失值:缺失值可能会导致图表中的空白或错误数据点。可以使用删除、插值或填补的方法来处理缺失值。例如,对于数值数据,可以使用均值或中位数进行填补;对于分类数据,可以使用众数填补。
-
删除重复数据:重复数据会导致图表中数据点重复,进而影响图表的准确性。可以通过编写脚本或使用数据清洗工具来自动检测并删除重复数据。
-
处理异常值:异常值是指远离其他数据点的数据,这些值可能是错误的输入或特殊情况。可以使用统计方法(如标准差、箱形图)来检测并处理异常值。
-
标准化数据格式:确保所有数据的格式一致,例如日期格式、数值单位等。这可以避免在图表生成过程中出现格式错误。
二、选择适当的可视化类型
选择适当的可视化类型能够有效传达数据背后的信息。不同的数据集和分析需求适用于不同的图表类型:
-
折线图:适用于显示数据随时间的变化,特别是时间序列数据。可以清晰地展示趋势和变化。
-
柱状图和条形图:适用于比较不同类别的数据。柱状图适合展示连续数据,而条形图适合展示离散数据。
-
饼图和环形图:适用于展示数据在总体中的比例,但不适合比较多个数据集。
-
散点图:适用于展示两个变量之间的关系。可以用来发现趋势、相关性或异常值。
-
热力图:适用于展示数据密度或频率,特别是在地理数据或矩阵数据中。
选择适当的图表类型不仅能提高图表的可读性,还能确保数据分析的准确性。
三、优化图表设计
图表设计优化对于提升数据可视化的效果至关重要:
-
简洁明了:避免过多的颜色、线条和标签。使用一致的颜色和样式,使图表看起来专业且易于理解。
-
明确的标题和标签:确保图表有清晰的标题,轴和数据点有明确的标签。这样可以帮助读者快速理解图表内容。
-
使用合适的比例:避免数据夸大或缩小的视觉误导。确保轴的刻度和数据比例一致,使图表反映真实情况。
-
注释和标记:在关键数据点或区域添加注释和标记,可以帮助读者理解图表中的重要信息或趋势。
-
响应式设计:确保图表在不同设备和屏幕尺寸上都能良好显示。这可以通过使用响应式设计技术来实现。
四、提高数据质量
提高数据质量是从根本上解决错误数据可视化问题的长远策略:
-
数据源的选择:选择可靠和权威的数据源。数据的准确性和可信度是保证图表质量的前提。
-
定期更新数据:确保数据是最新的。过时的数据可能会导致错误结论和误导性的可视化。
-
数据验证和校验:在使用数据之前进行严格的验证和校验。可以通过数据分析工具或手动检查来确保数据的准确性。
-
培训和意识:提高数据处理和分析人员的专业技能和数据意识。定期培训和知识更新可以帮助他们更好地处理和分析数据。
通过以上方法,可以有效地解决数据可视化中的错误问题,确保数据图表准确、清晰地传达信息。对于想要进一步提升数据可视化效果的用户,可以借助FineBI、FineReport和FineVis等专业工具,访问官网了解更多信息:
- FineBI官网: https://s.fanruan.com/f459r
- FineReport官网: https://s.fanruan.com/ryhzq
- FineVis官网: https://s.fanruan.com/7z296
相关问答FAQs:
FAQs about Resolving Incorrect Data Visualization
1. What are the common causes of incorrect data visualization, and how can they be addressed?
Incorrect data visualization often stems from several issues, including poor data quality, improper data processing, and inadequate choice of visualization types. To address these problems:
- Data Quality: Ensure that your data is accurate, complete, and up-to-date. Conduct regular data audits and cleaning processes to remove any inconsistencies or errors.
- Data Processing: Verify that the data processing steps, such as aggregation and transformation, are correctly implemented. Use data validation techniques to ensure that data transformations preserve the integrity of the original dataset.
- Visualization Type: Choose the appropriate type of visualization based on the nature of your data and the story you want to tell. For example, use bar charts for categorical comparisons and line graphs for trends over time. Avoid overcomplicating visualizations with too many variables or unnecessary embellishments.
By systematically addressing these issues, you can significantly enhance the accuracy and effectiveness of your data visualizations.
2. How can one verify the accuracy of data visualizations before finalizing them?
Verifying the accuracy of data visualizations involves several key practices:
- Cross-Checking Data: Compare the visualized data with raw data sources to ensure consistency. This involves checking data values, scales, and labels to confirm they match the original dataset.
- Peer Review: Have colleagues or data experts review your visualizations. Fresh eyes can catch errors or inconsistencies that might be overlooked.
- Testing with Real-World Scenarios: Test the visualizations with real-world scenarios or use cases to see if they effectively convey the intended message. This can involve creating mock reports or presenting the visualizations to a sample audience.
- Tool and Software Accuracy: Ensure that the tools or software used for creating the visualizations are functioning correctly and are up-to-date. Software bugs or outdated versions can sometimes introduce errors.
By implementing these verification steps, you can ensure that your data visualizations are accurate and reliable.
3. What strategies can be employed to improve the effectiveness of data visualizations that are currently inaccurate or misleading?
Improving ineffective data visualizations involves several strategies:
- Redesign Visualizations: Reevaluate the design and structure of your visualizations. Simplify complex graphics and use clear, concise labels and legends. Ensure that colors and shapes are used consistently and meaningfully.
- Enhance Data Presentation: Use interactive elements like filters and tooltips to allow users to explore data in more detail. Interactive visualizations can help users better understand and interpret the data.
- Provide Context and Annotations: Add contextual information and annotations to help viewers understand the data better. This can include explanations of trends, comparisons, or significant data points.
- Utilize Best Practices: Follow best practices for data visualization, such as avoiding misleading scales, using appropriate chart types, and maintaining visual consistency. Educate yourself and your team on effective visualization techniques and principles.
Implementing these strategies can significantly enhance the clarity and impact of your data visualizations, ensuring they convey accurate and meaningful insights.
本文内容通过AI工具匹配关键字智能整合而成,仅供参考,帆软不对内容的真实、准确或完整作任何形式的承诺。具体产品功能请以帆软官方帮助文档为准,或联系您的对接销售进行咨询。如有其他问题,您可以通过联系blog@fanruan.com进行反馈,帆软收到您的反馈后将及时答复和处理。


