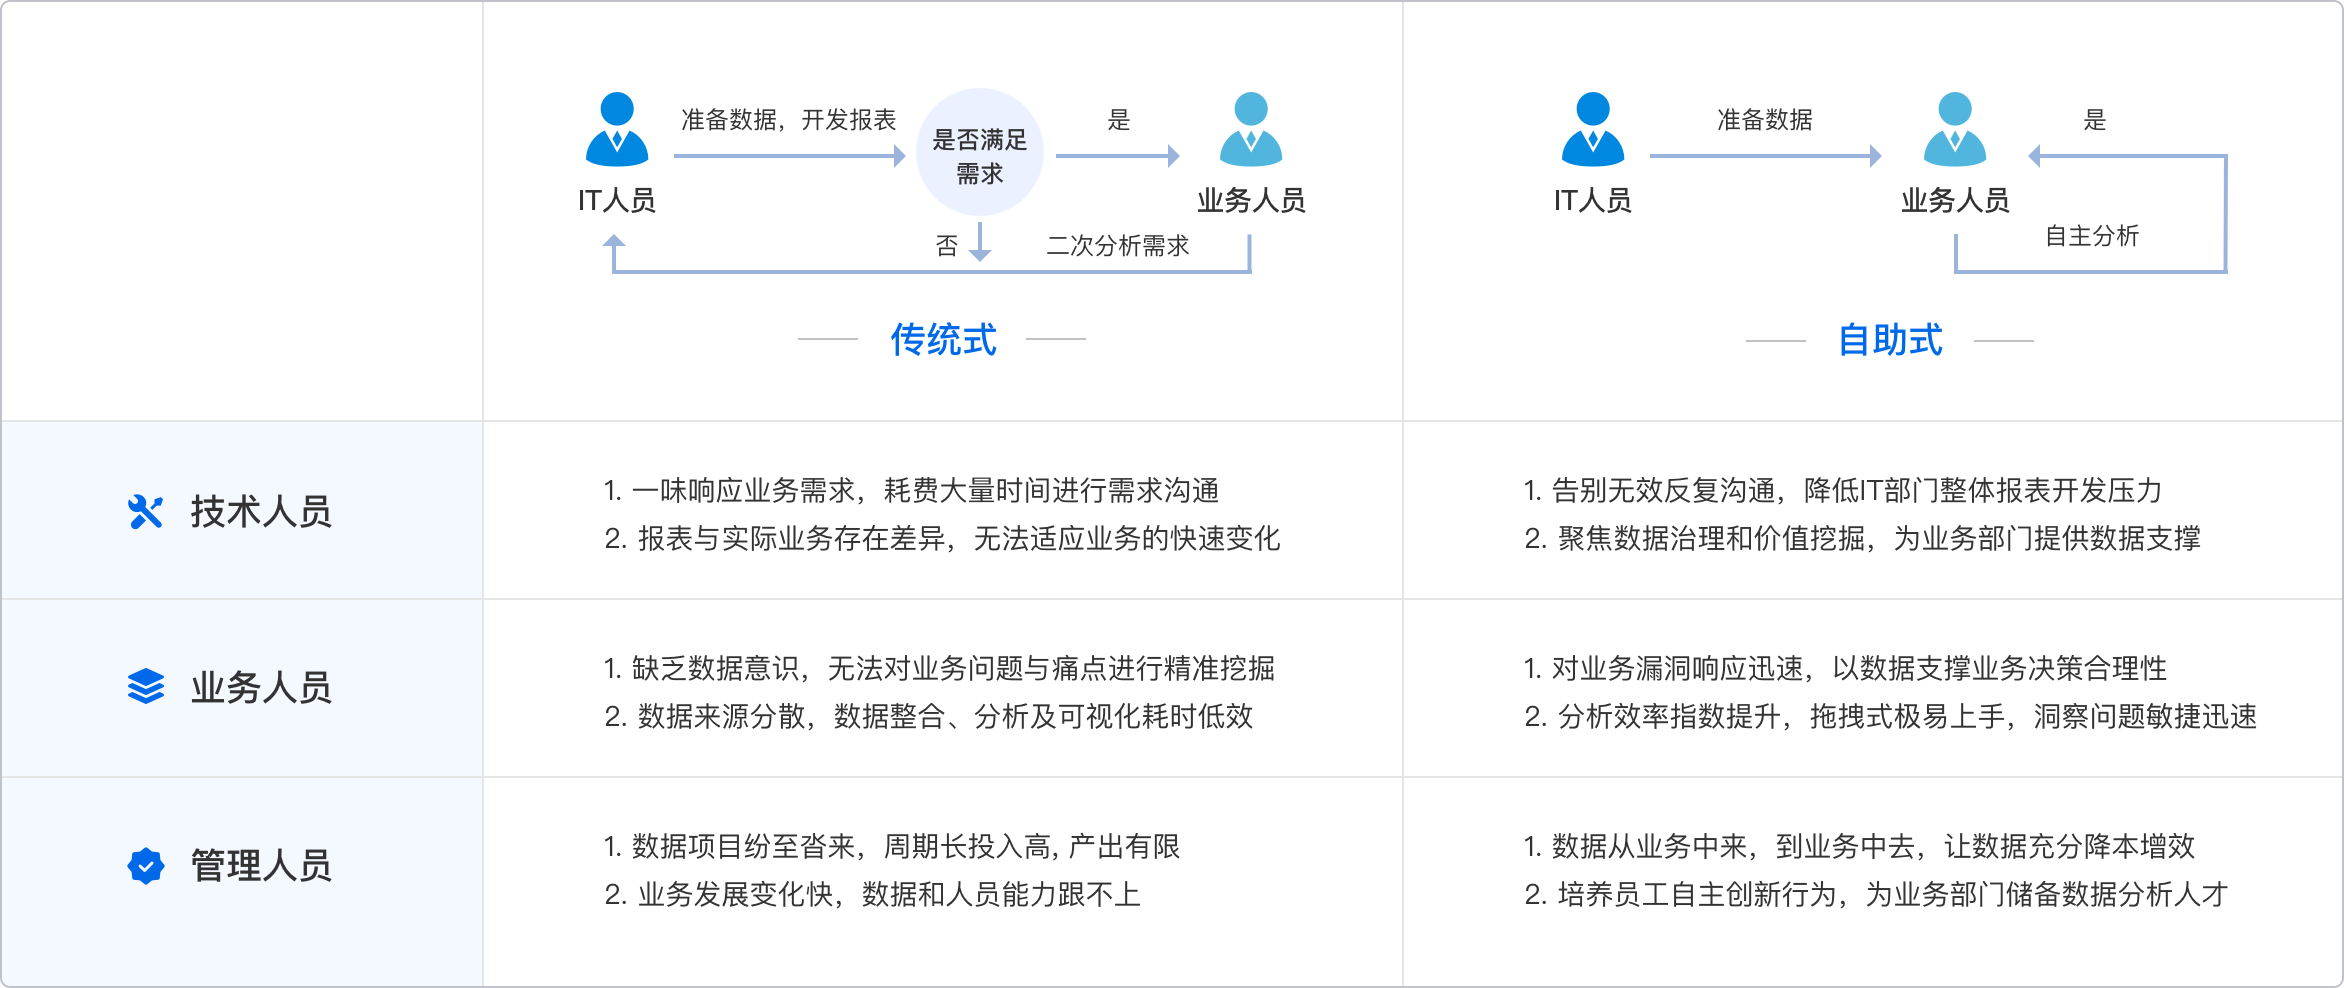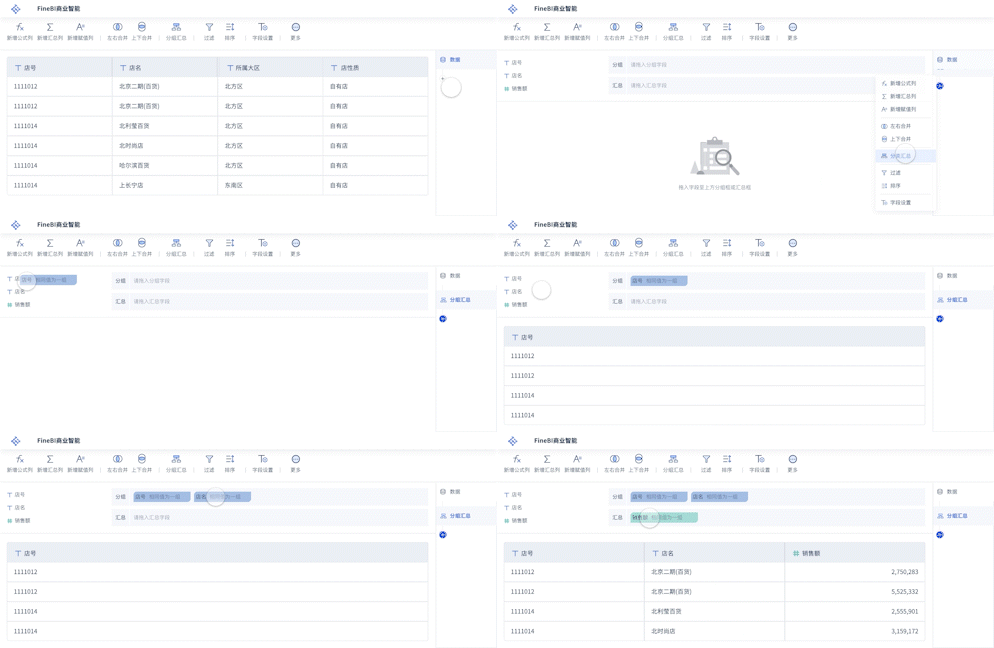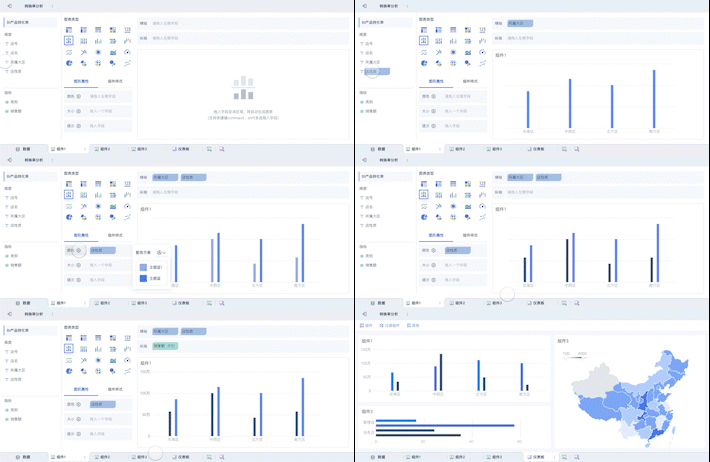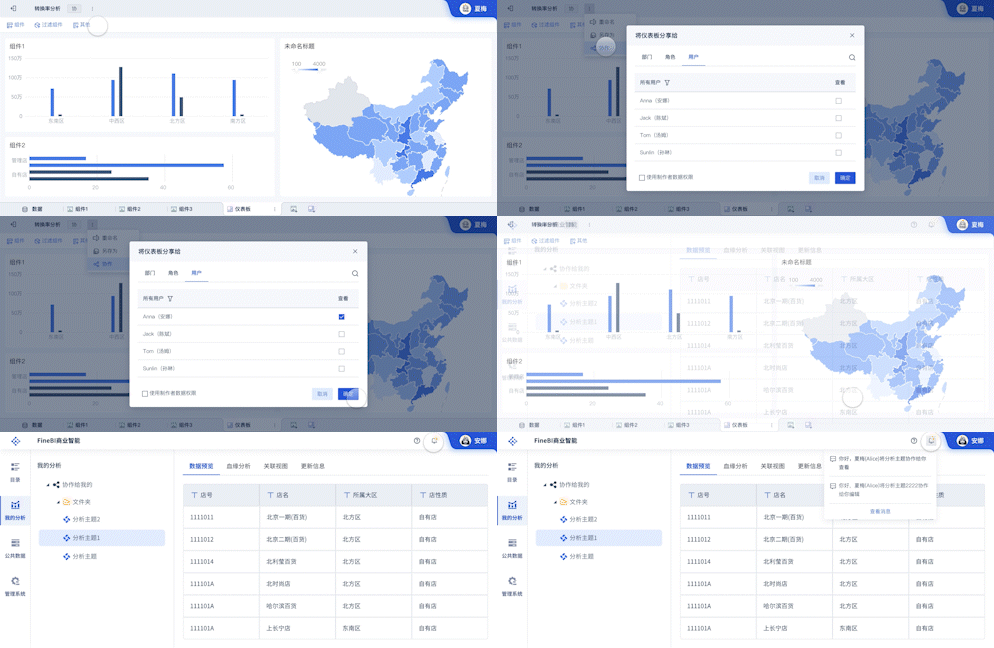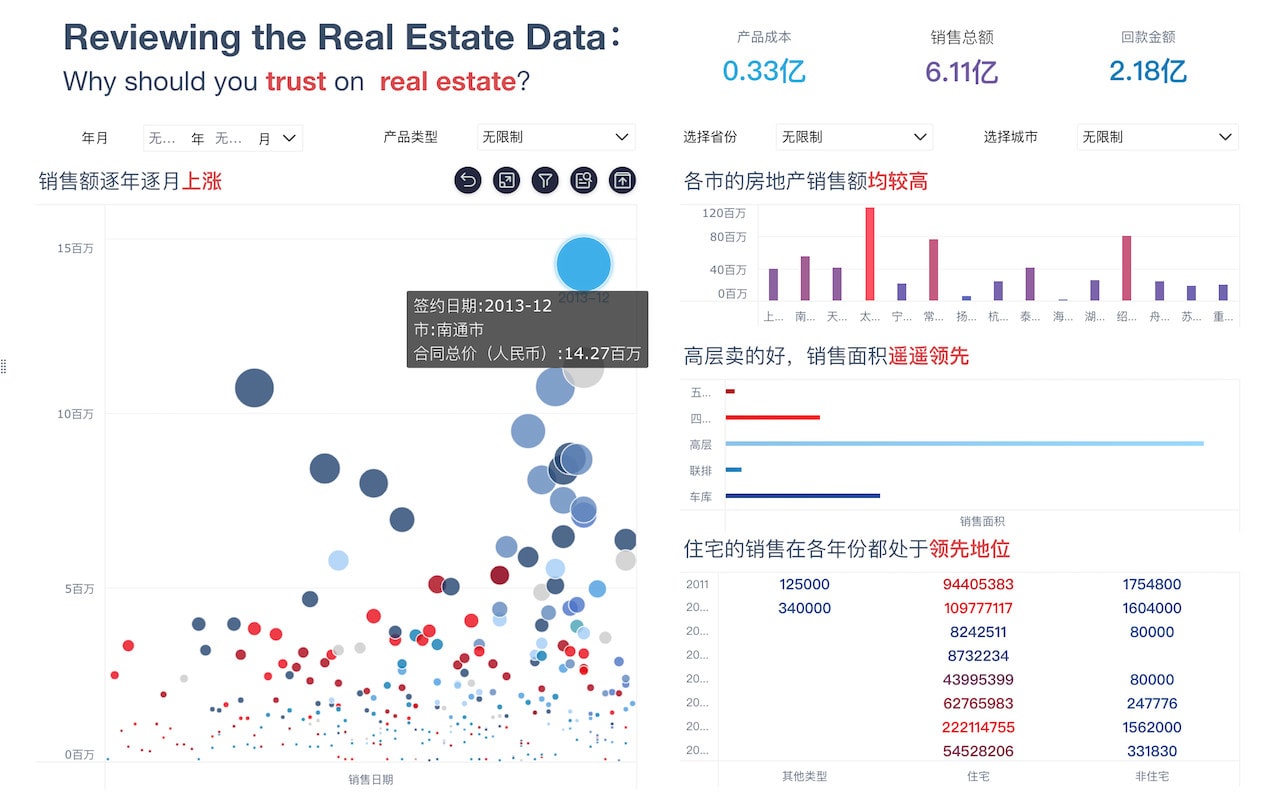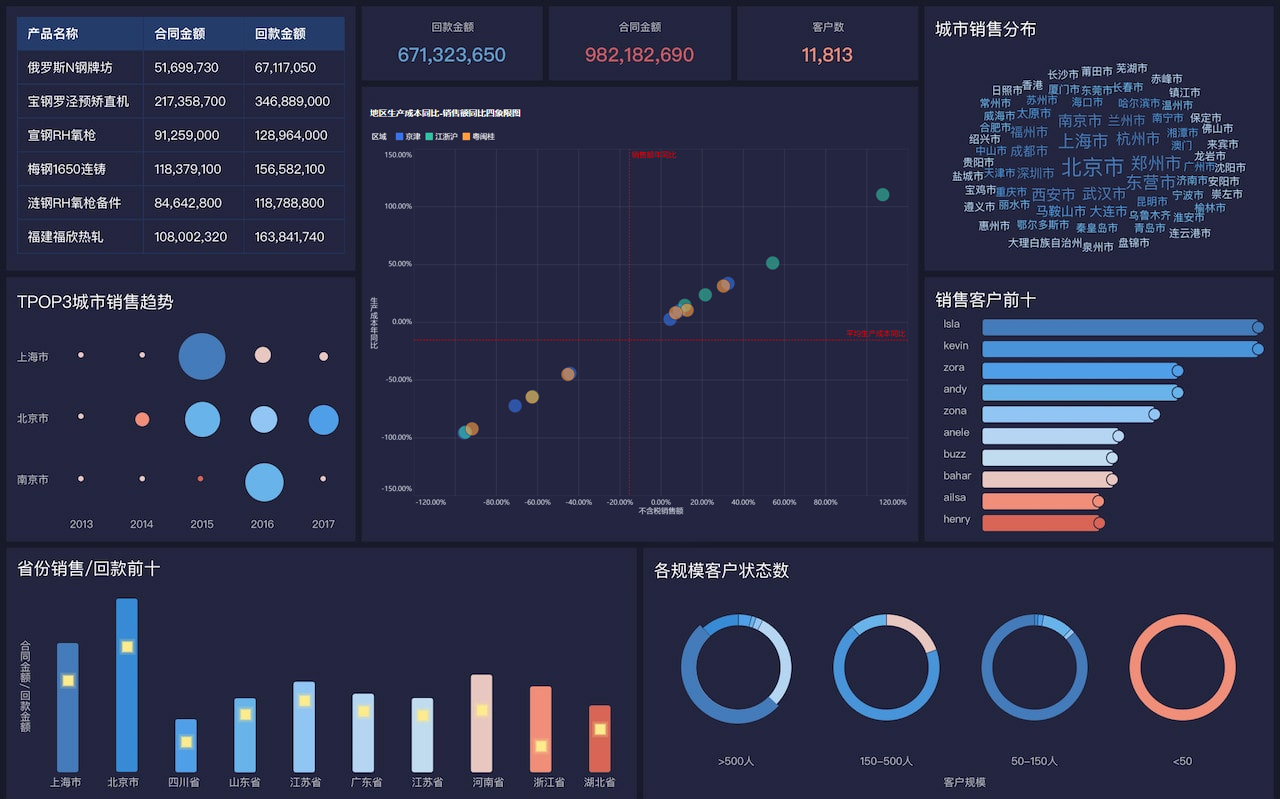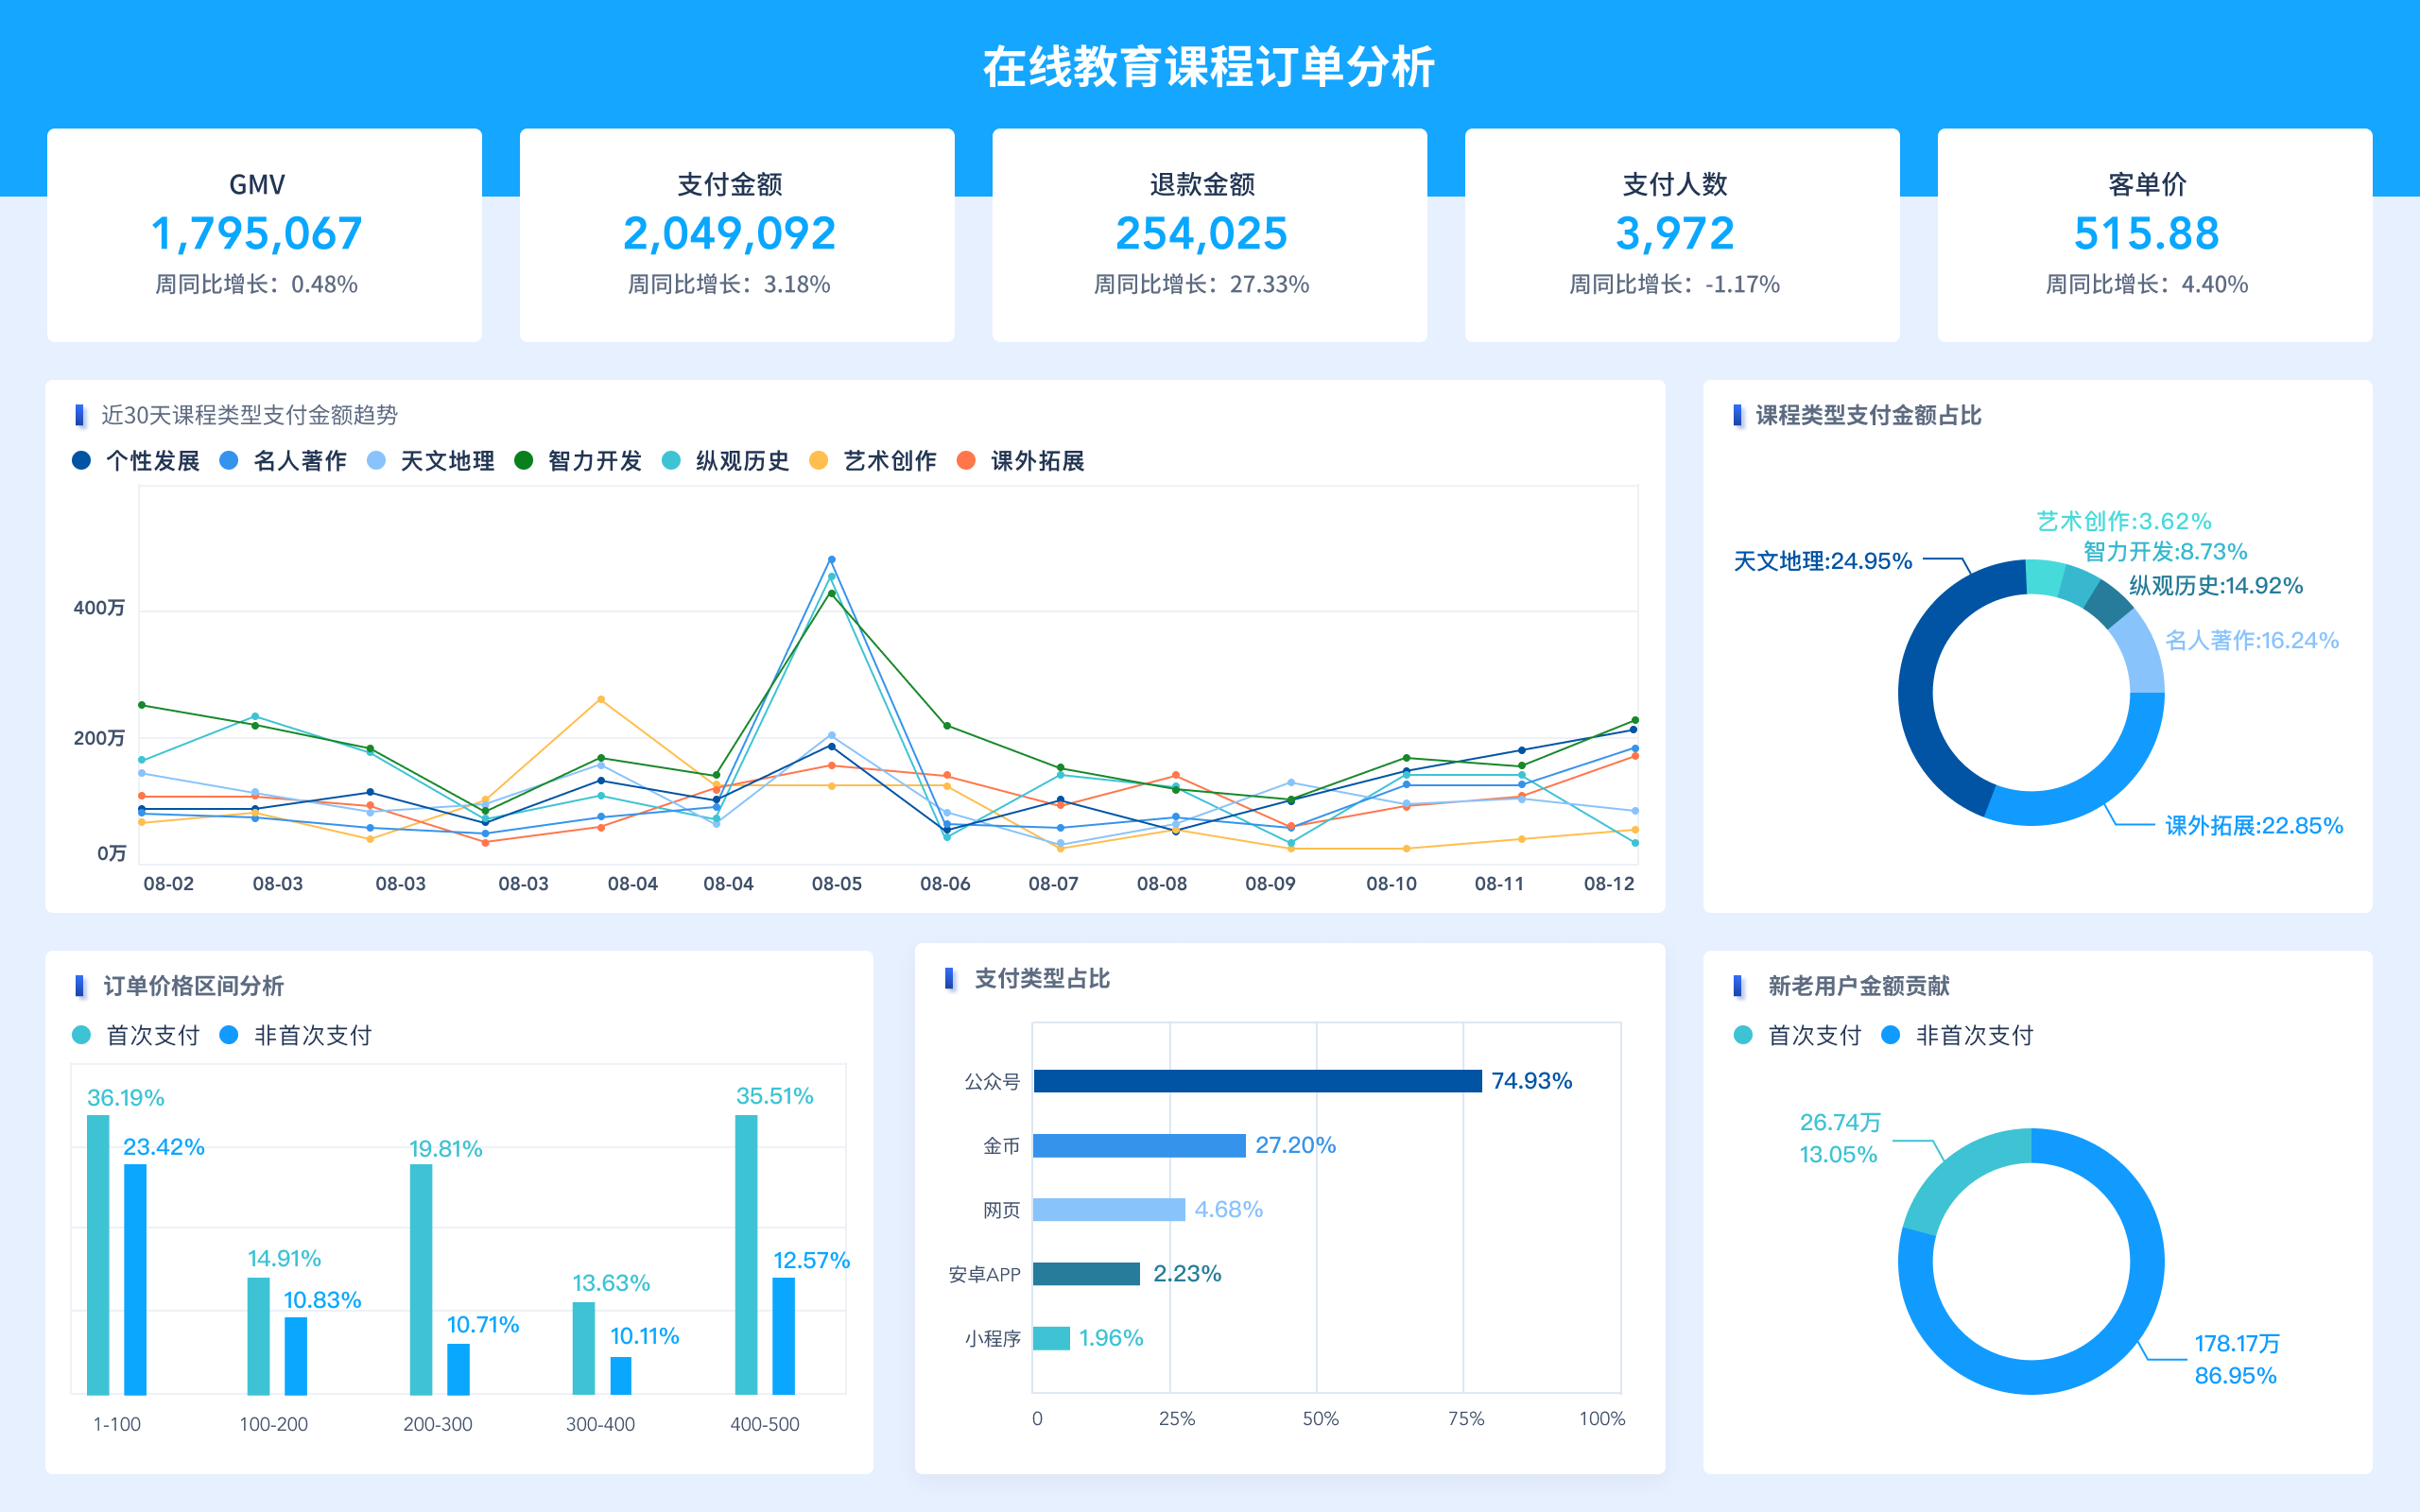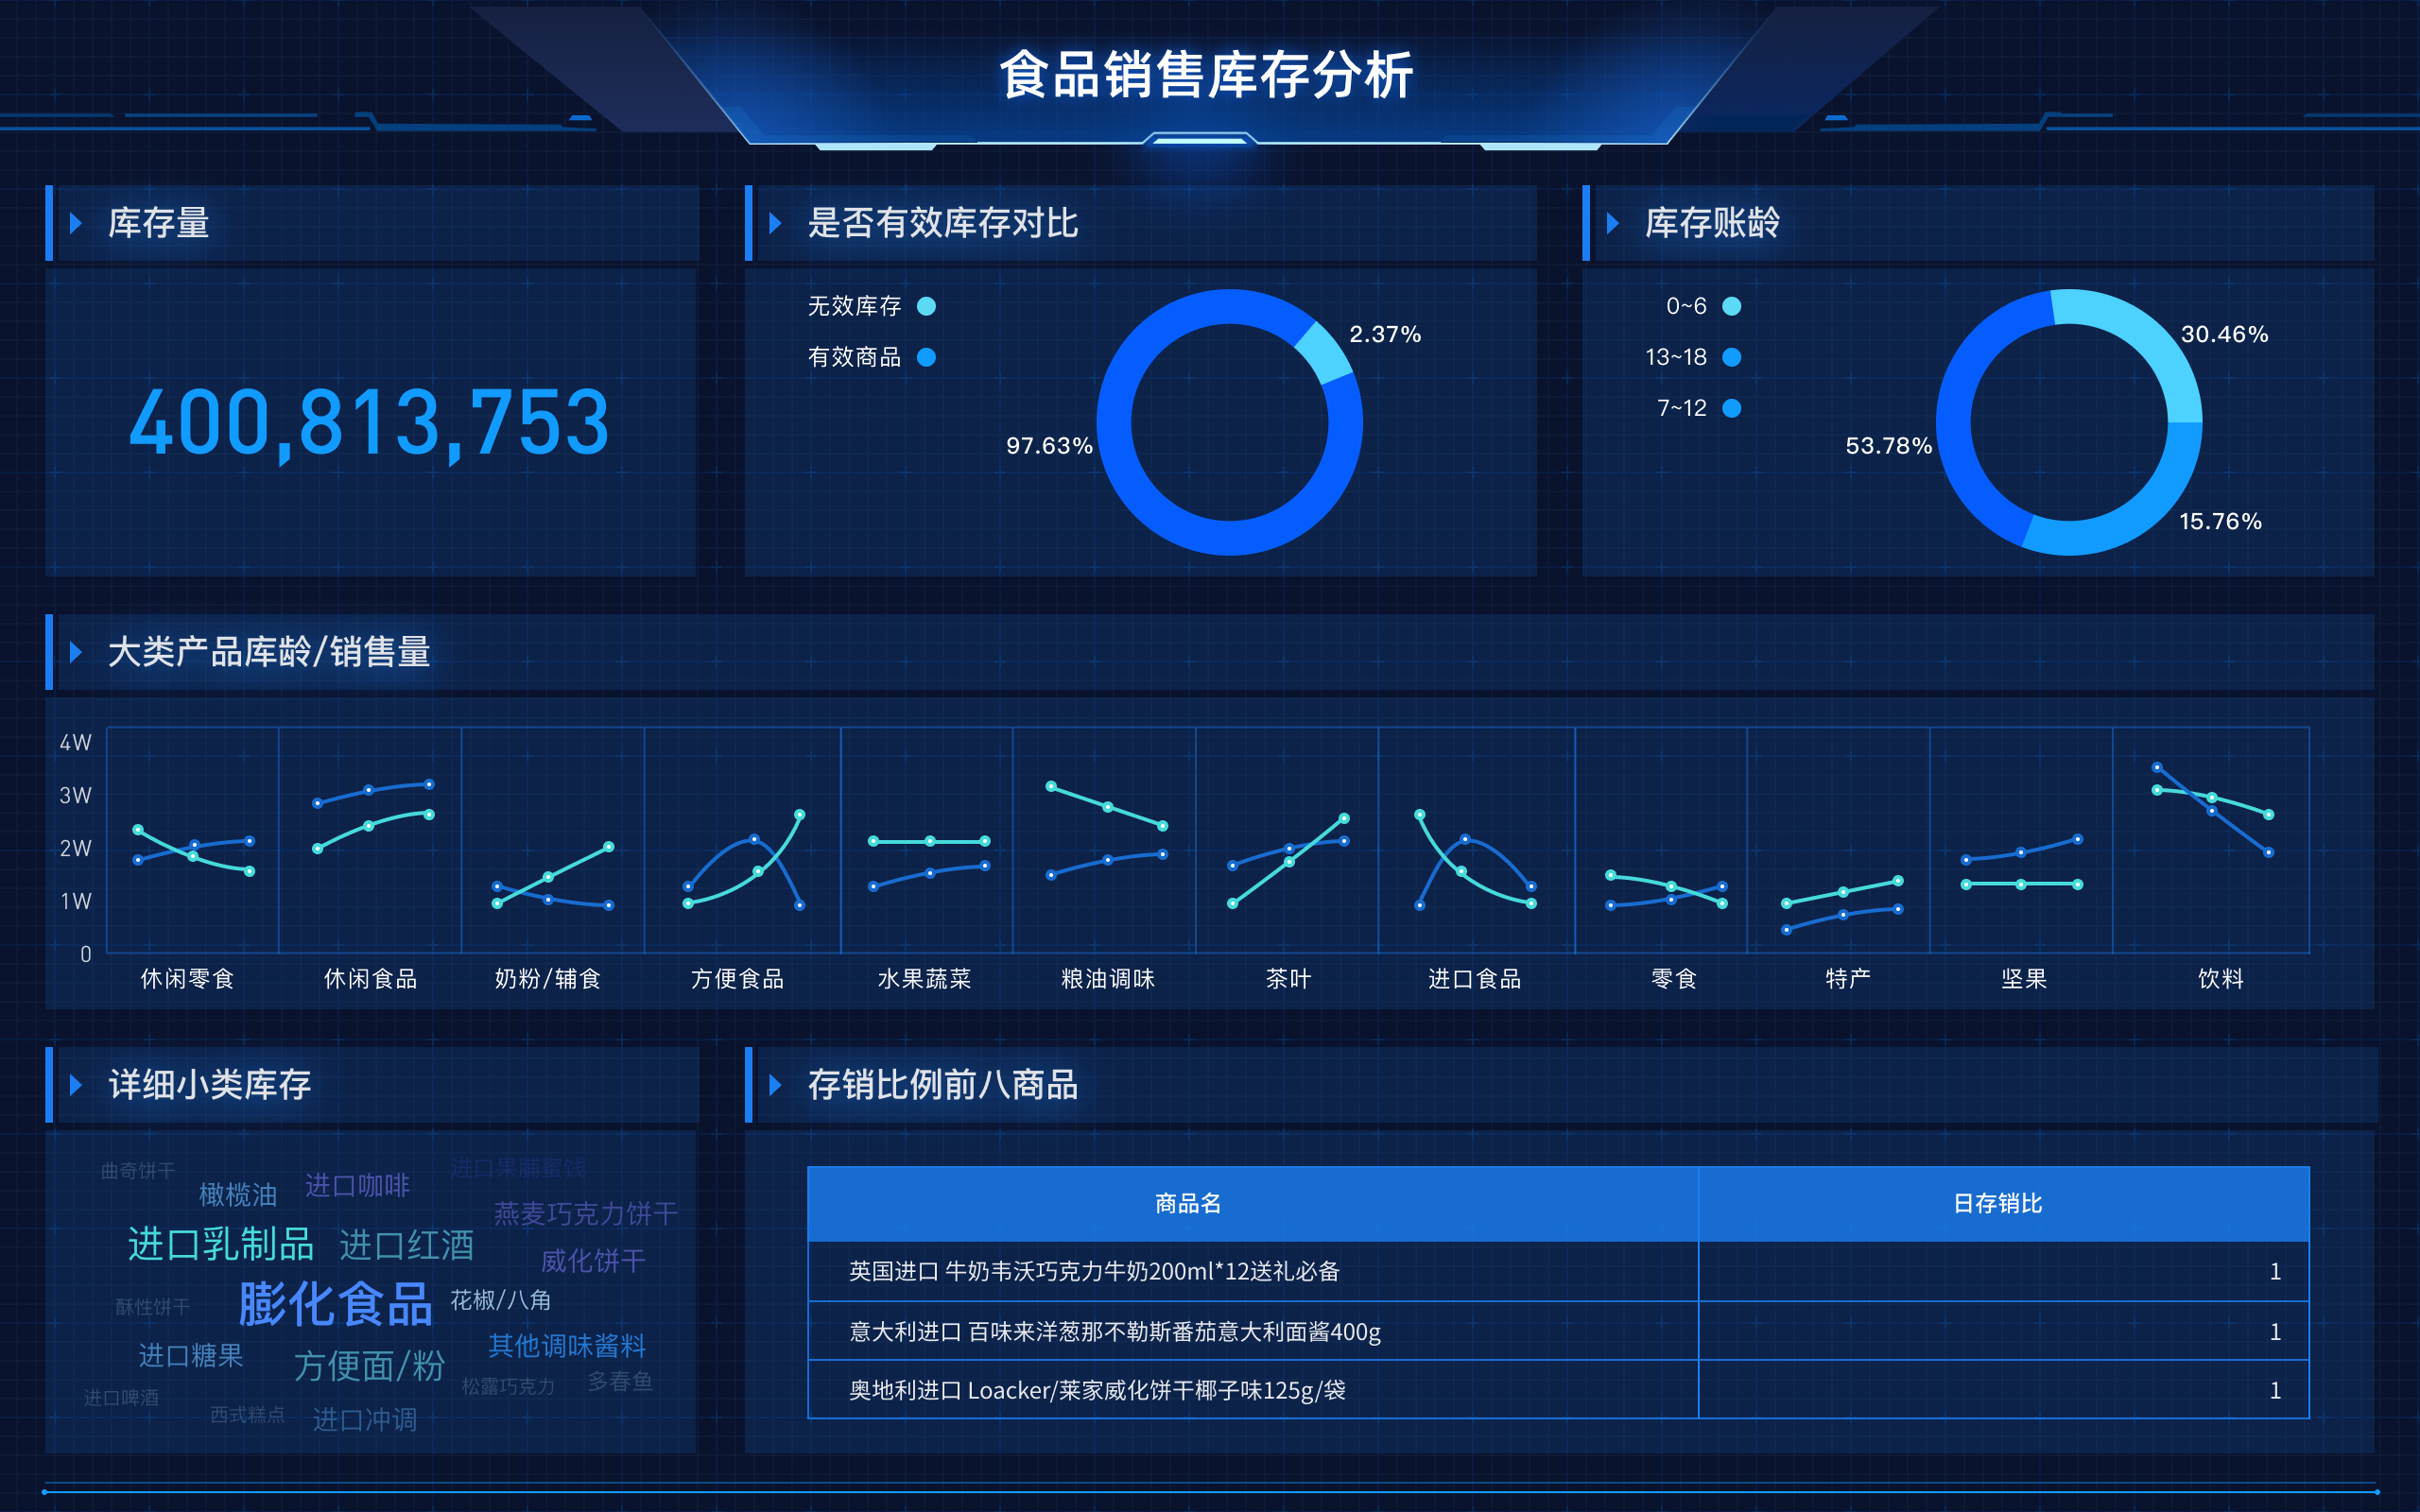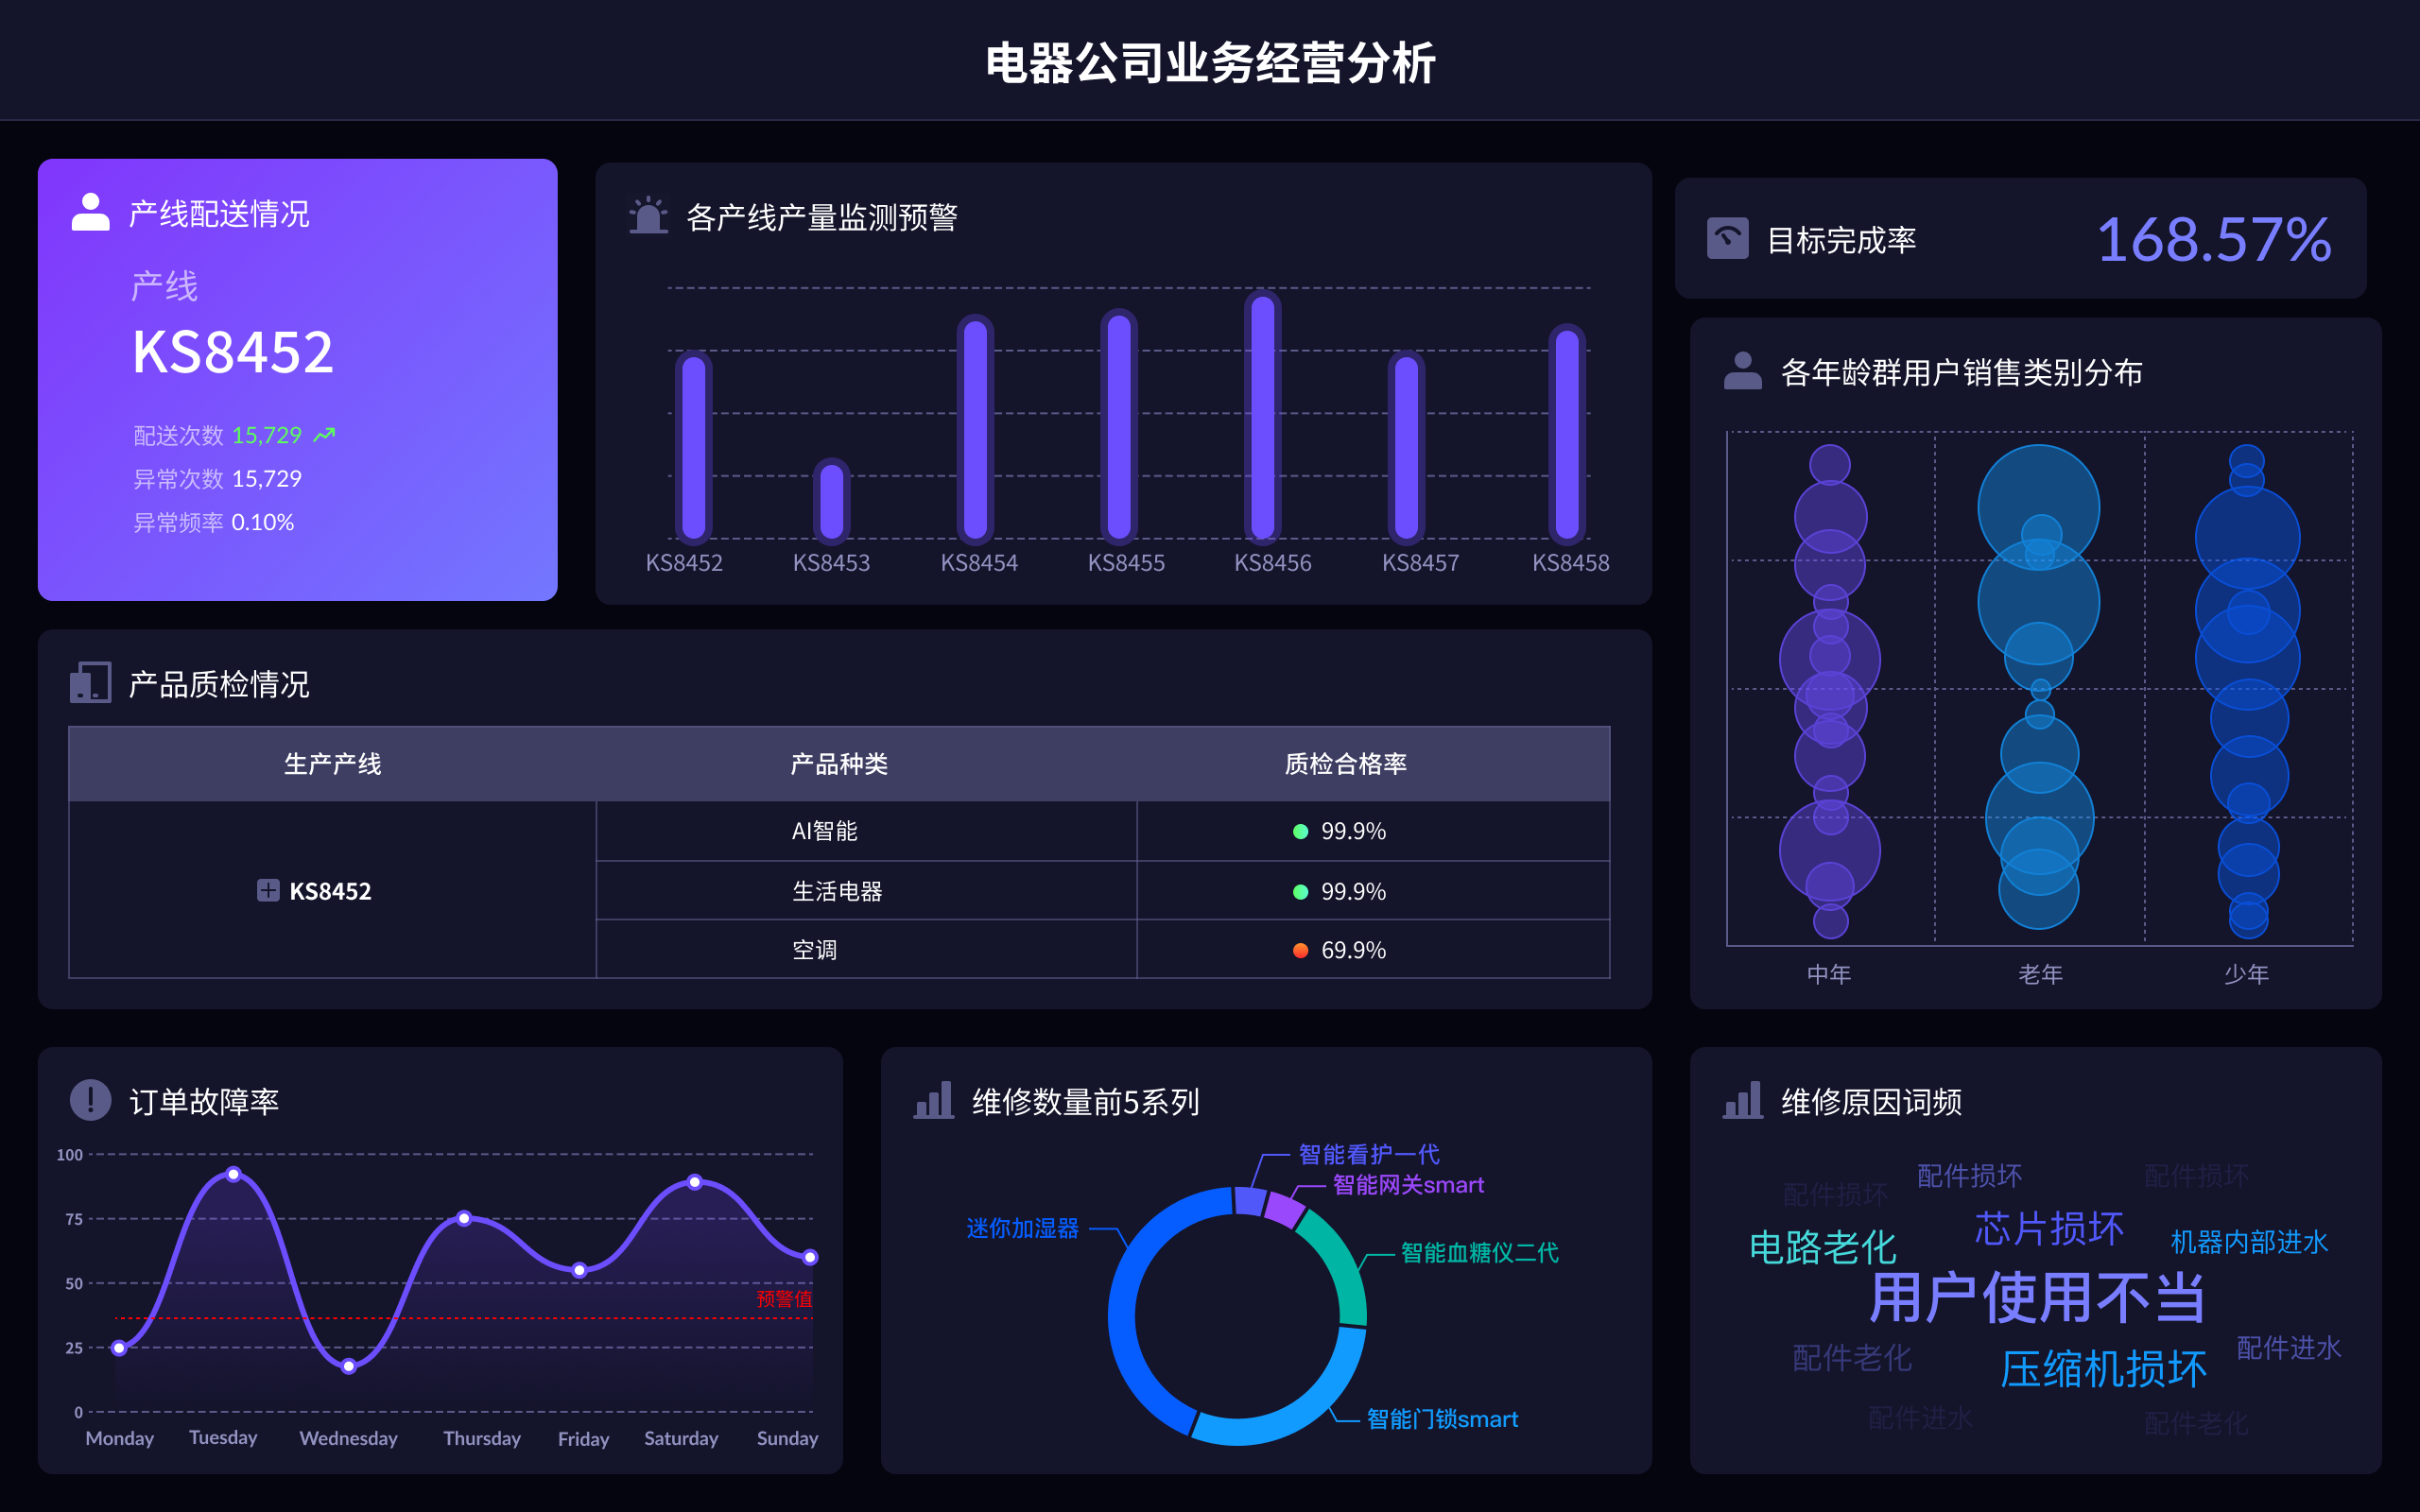
在UI数据可视化中,绘制流程图需要考虑多个关键步骤:确定目标、收集和整理数据、选择合适的可视化工具、设计和开发可视化界面、测试和优化。确定目标、收集和整理数据、选择合适的可视化工具、设计和开发可视化界面、测试和优化。详细描述一个关键点:确定目标是最重要的一步,它决定了整个可视化流程的方向和方法。明确目标能确保可视化展示的信息准确传达给用户,从而实现有效的数据解读和决策支持。
一、确定目标
在任何UI数据可视化项目中,首先需要明确的是项目的目标和需求。明确目标可以帮助定义数据的范围和深度,从而确保可视化结果符合预期。确定目标时,需要考虑以下几个方面:
- 业务需求:理解项目的业务背景和需求,是为了帮助决策、监控业务指标,还是为了展示研究成果?
- 受众分析:了解最终用户是谁,他们的知识水平和信息需求是什么?
- 关键指标:确定哪些指标和数据点是最重要的,需要重点展示和分析。
- 期望效果:明确期望达到的效果,是希望用户能够快速理解数据,还是能够进行深入分析?
通过上述步骤,能够确保整个可视化过程有明确的方向,避免偏离目标。
二、收集和整理数据
数据的收集和整理是UI数据可视化中至关重要的一步。数据的质量和完整性直接影响可视化的准确性和可靠性。在这个过程中,需要执行以下任务:
- 数据来源:确定数据的来源,可以是数据库、API接口、CSV文件等。确保数据来源可靠,数据更新及时。
- 数据清洗:对收集到的数据进行清洗,去除错误、不完整和重复的数据。确保数据的准确性和一致性。
- 数据整合:将来自不同来源的数据进行整合,形成一个完整的数据集。需要考虑数据格式的统一和数据关系的处理。
- 数据预处理:对数据进行预处理,如归一化、标准化、缺失值填补等,以便后续的可视化处理。
高质量的数据是成功进行数据可视化的基础,确保数据的准确和完整,是后续步骤顺利进行的前提。
三、选择合适的可视化工具
选择合适的可视化工具可以事半功倍。根据项目的需求和数据的特性,选择最适合的工具,能够有效提高工作效率和展示效果。常见的可视化工具包括:
- FineBI:适合处理复杂的商业数据分析和展示。它提供了丰富的图表和互动功能,适合企业级数据可视化需求。官网:FineBI官网
- FineReport:专注于报表设计和生成,适用于需要生成精美报表的场景。官网:FineReport官网
- FineVis:专为大数据可视化设计,支持多种数据源和图表类型,适合大数据分析和展示。官网:FineVis官网
选择工具时,应考虑其功能、易用性、扩展性和与现有系统的兼容性。
四、设计和开发可视化界面
在设计和开发可视化界面时,需要综合考虑数据的展示方式和用户的体验。设计过程中应遵循以下原则:
- 简洁明了:界面设计应简洁明了,避免过多的装饰元素,确保用户能够快速理解数据。
- 信息层次:合理安排信息的层次,突出重点数据,次要数据可以通过互动或辅助图表展示。
- 一致性:保持界面风格的一致性,包括颜色、字体、图表风格等,提高用户体验的连贯性。
- 响应式设计:考虑不同设备和屏幕尺寸的适配,确保在各种设备上都能良好展示。
在开发过程中,需要与设计师和数据分析师密切合作,确保最终的可视化界面既美观又实用。
五、测试和优化
在完成初步设计和开发后,需要进行全面的测试和优化。测试的目的是发现和修复问题,优化的目的是提升性能和用户体验。测试和优化的步骤包括:
- 功能测试:确保所有功能正常工作,包括数据加载、图表交互、过滤器等。
- 性能测试:测试界面的加载速度和响应速度,特别是对于大数据量的场景。
- 用户测试:邀请目标用户进行测试,收集他们的反馈,发现使用中的问题和不足。
- 优化调整:根据测试结果进行优化调整,提升界面的性能和用户体验。
通过不断的测试和优化,确保最终的可视化界面能够高效、稳定地运行,并且能够满足用户的需求。
总结来说,UI数据可视化的流程图绘制需要从确定目标开始,经过数据收集和整理、选择合适的工具、设计和开发界面,最后通过测试和优化来确保效果。每一步都至关重要,只有各个环节密切配合,才能实现高质量的可视化结果。
相关问答FAQs:
FAQs about Drawing UI Data Visualization Flowcharts
1. What is a UI data visualization flowchart and why is it important?
A UI data visualization flowchart is a diagrammatic representation used to plan and design the visual elements of a user interface (UI) that display data. This type of flowchart helps in understanding how data will be presented to users, ensuring clarity, usability, and effectiveness in communicating information. By visualizing the data flow and interactions, designers can map out how users will interact with different elements and how data will be processed and displayed. This is crucial in creating intuitive and user-friendly interfaces, reducing complexity, and improving the overall user experience. An effective flowchart can guide developers and stakeholders through the design process, ensuring that all aspects of the data visualization are well-thought-out and aligned with user needs.
2. What are the essential steps to create a UI data visualization flowchart?
Creating a UI data visualization flowchart involves several key steps:
-
Define the Purpose: Start by clearly defining the objectives of your data visualization. What kind of data will be displayed? What insights are users expected to gain? Understanding the purpose will help shape the flowchart’s structure and content.
-
Identify Key Data Elements: Determine the types of data that will be visualized. This includes defining data sources, data types, and any relevant metrics. Knowing these elements will help in designing the flow of data through the interface.
-
Outline User Interactions: Map out how users will interact with the data. This includes identifying key user actions, such as filtering, sorting, or drilling down into data. Understanding these interactions will help design the flowchart to accommodate user needs effectively.
-
Design the Flowchart Layout: Create a visual representation of how data will flow through the interface. This typically involves drawing various components such as data sources, processing stages, and output visualizations. Use symbols and connectors to illustrate the relationships and processes.
-
Refine and Review: After drafting the flowchart, review it to ensure that it accurately represents the intended data flow and user interactions. Seek feedback from stakeholders and make necessary adjustments to improve clarity and functionality.
-
Document and Communicate: Once finalized, document the flowchart and communicate it to the development team and other stakeholders. This ensures everyone involved has a clear understanding of the design and data flow.
3. What tools and techniques are best for creating a UI data visualization flowchart?
There are several tools and techniques available for creating effective UI data visualization flowcharts:
-
Flowchart Software: Dedicated software such as Lucidchart, Microsoft Visio, and Draw.io offer extensive features for designing flowcharts. These tools provide various templates, symbols, and formatting options to create professional and detailed flowcharts.
-
Wireframing Tools: Tools like Figma, Sketch, and Adobe XD are useful for integrating data visualization elements within broader UI designs. They allow for the creation of interactive prototypes that can help in visualizing how data will be presented and interacted with in the final product.
-
Diagramming Techniques: Techniques such as hierarchical, linear, or swimlane diagrams can be used to structure data flowcharts. Choose a technique based on the complexity of the data and interactions. For instance, hierarchical diagrams are suitable for representing data processing stages, while swimlane diagrams are useful for showing different user roles and their interactions with the data.
-
Design Principles: Adhering to design principles such as simplicity, clarity, and consistency is essential in creating effective flowcharts. Ensure that the flowchart is easy to understand and that all components are clearly labeled and logically arranged.
-
Collaboration Tools: Utilizing collaboration platforms like Miro or Confluence can facilitate teamwork and feedback during the flowchart creation process. These tools allow multiple users to contribute, review, and revise the flowchart in real-time.
By leveraging these tools and techniques, you can create a well-organized and effective UI data visualization flowchart that supports the design and development of a user-friendly interface.
本文内容通过AI工具匹配关键字智能整合而成,仅供参考,帆软不对内容的真实、准确或完整作任何形式的承诺。具体产品功能请以帆软官方帮助文档为准,或联系您的对接销售进行咨询。如有其他问题,您可以通过联系blog@fanruan.com进行反馈,帆软收到您的反馈后将及时答复和处理。


