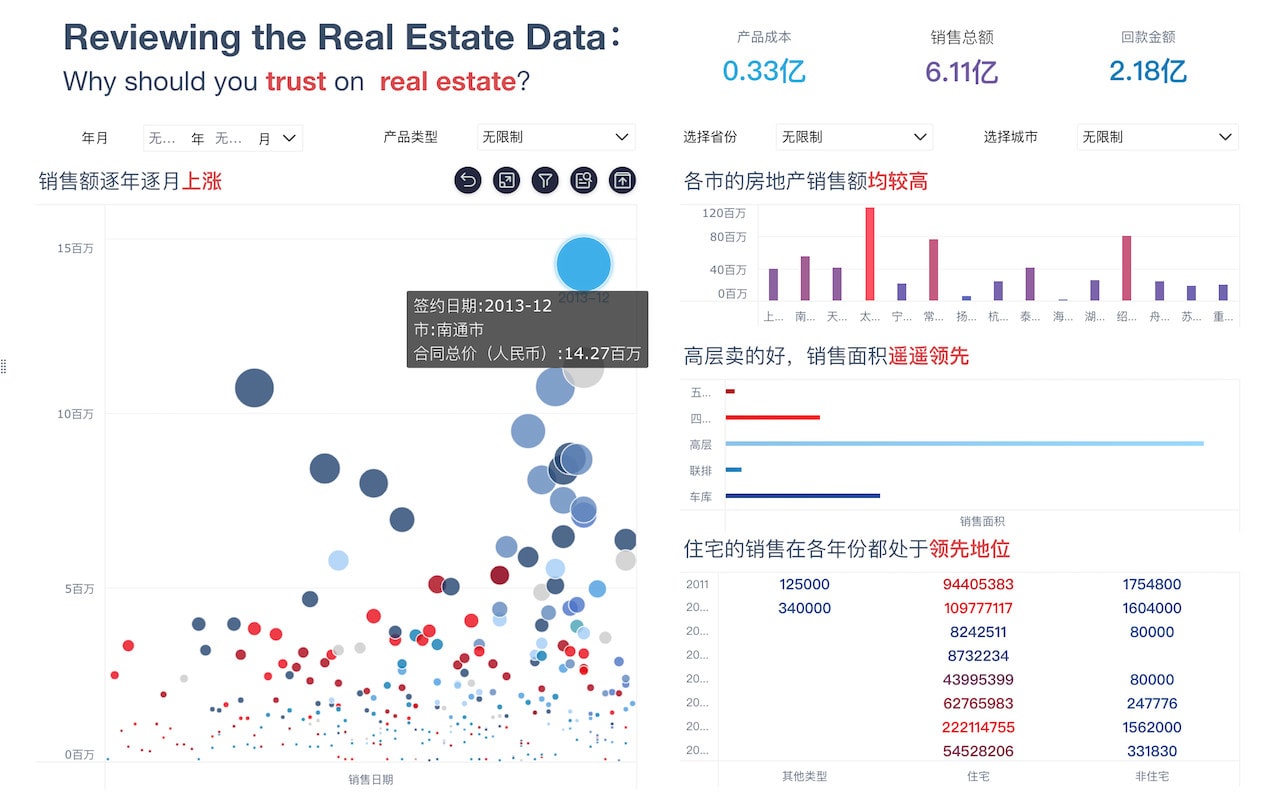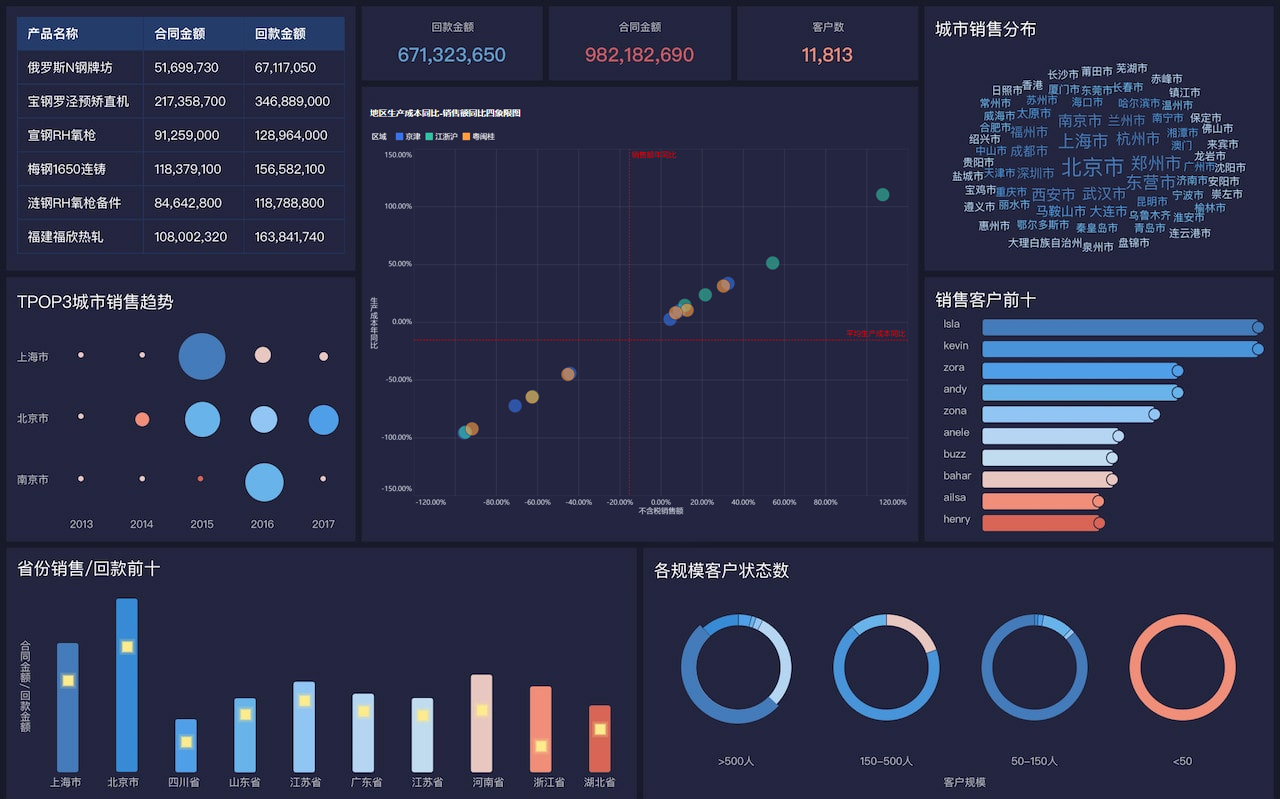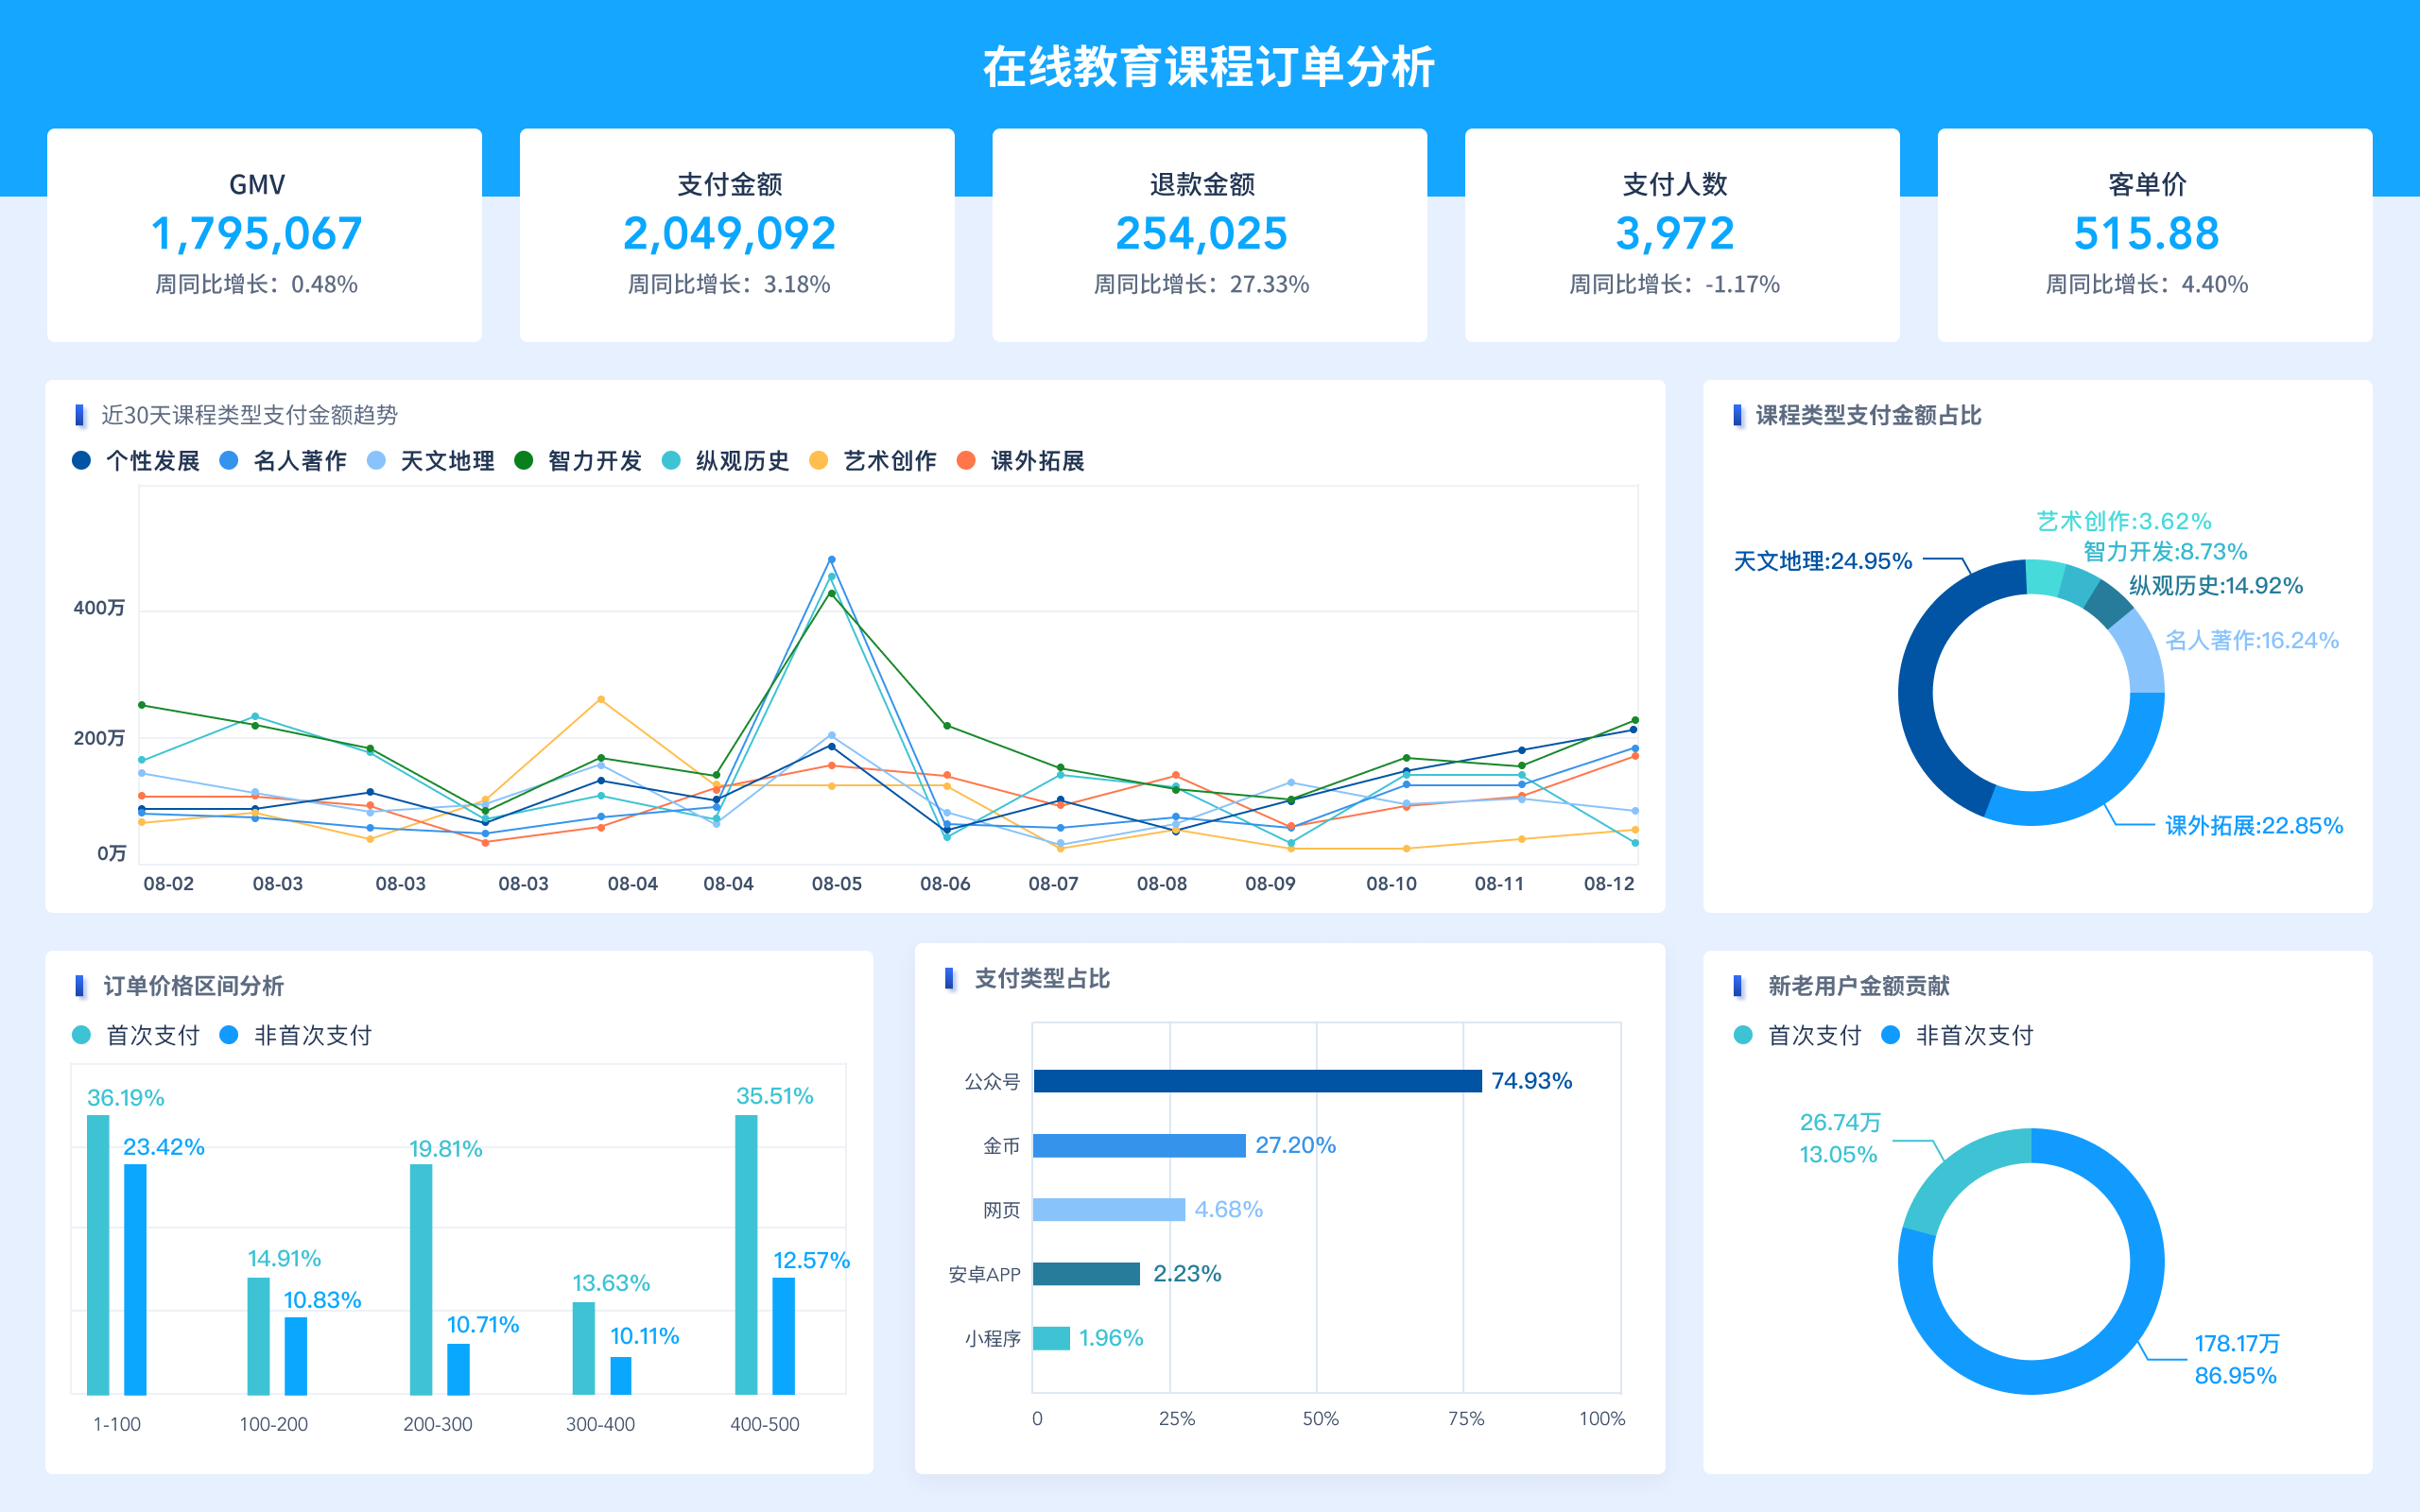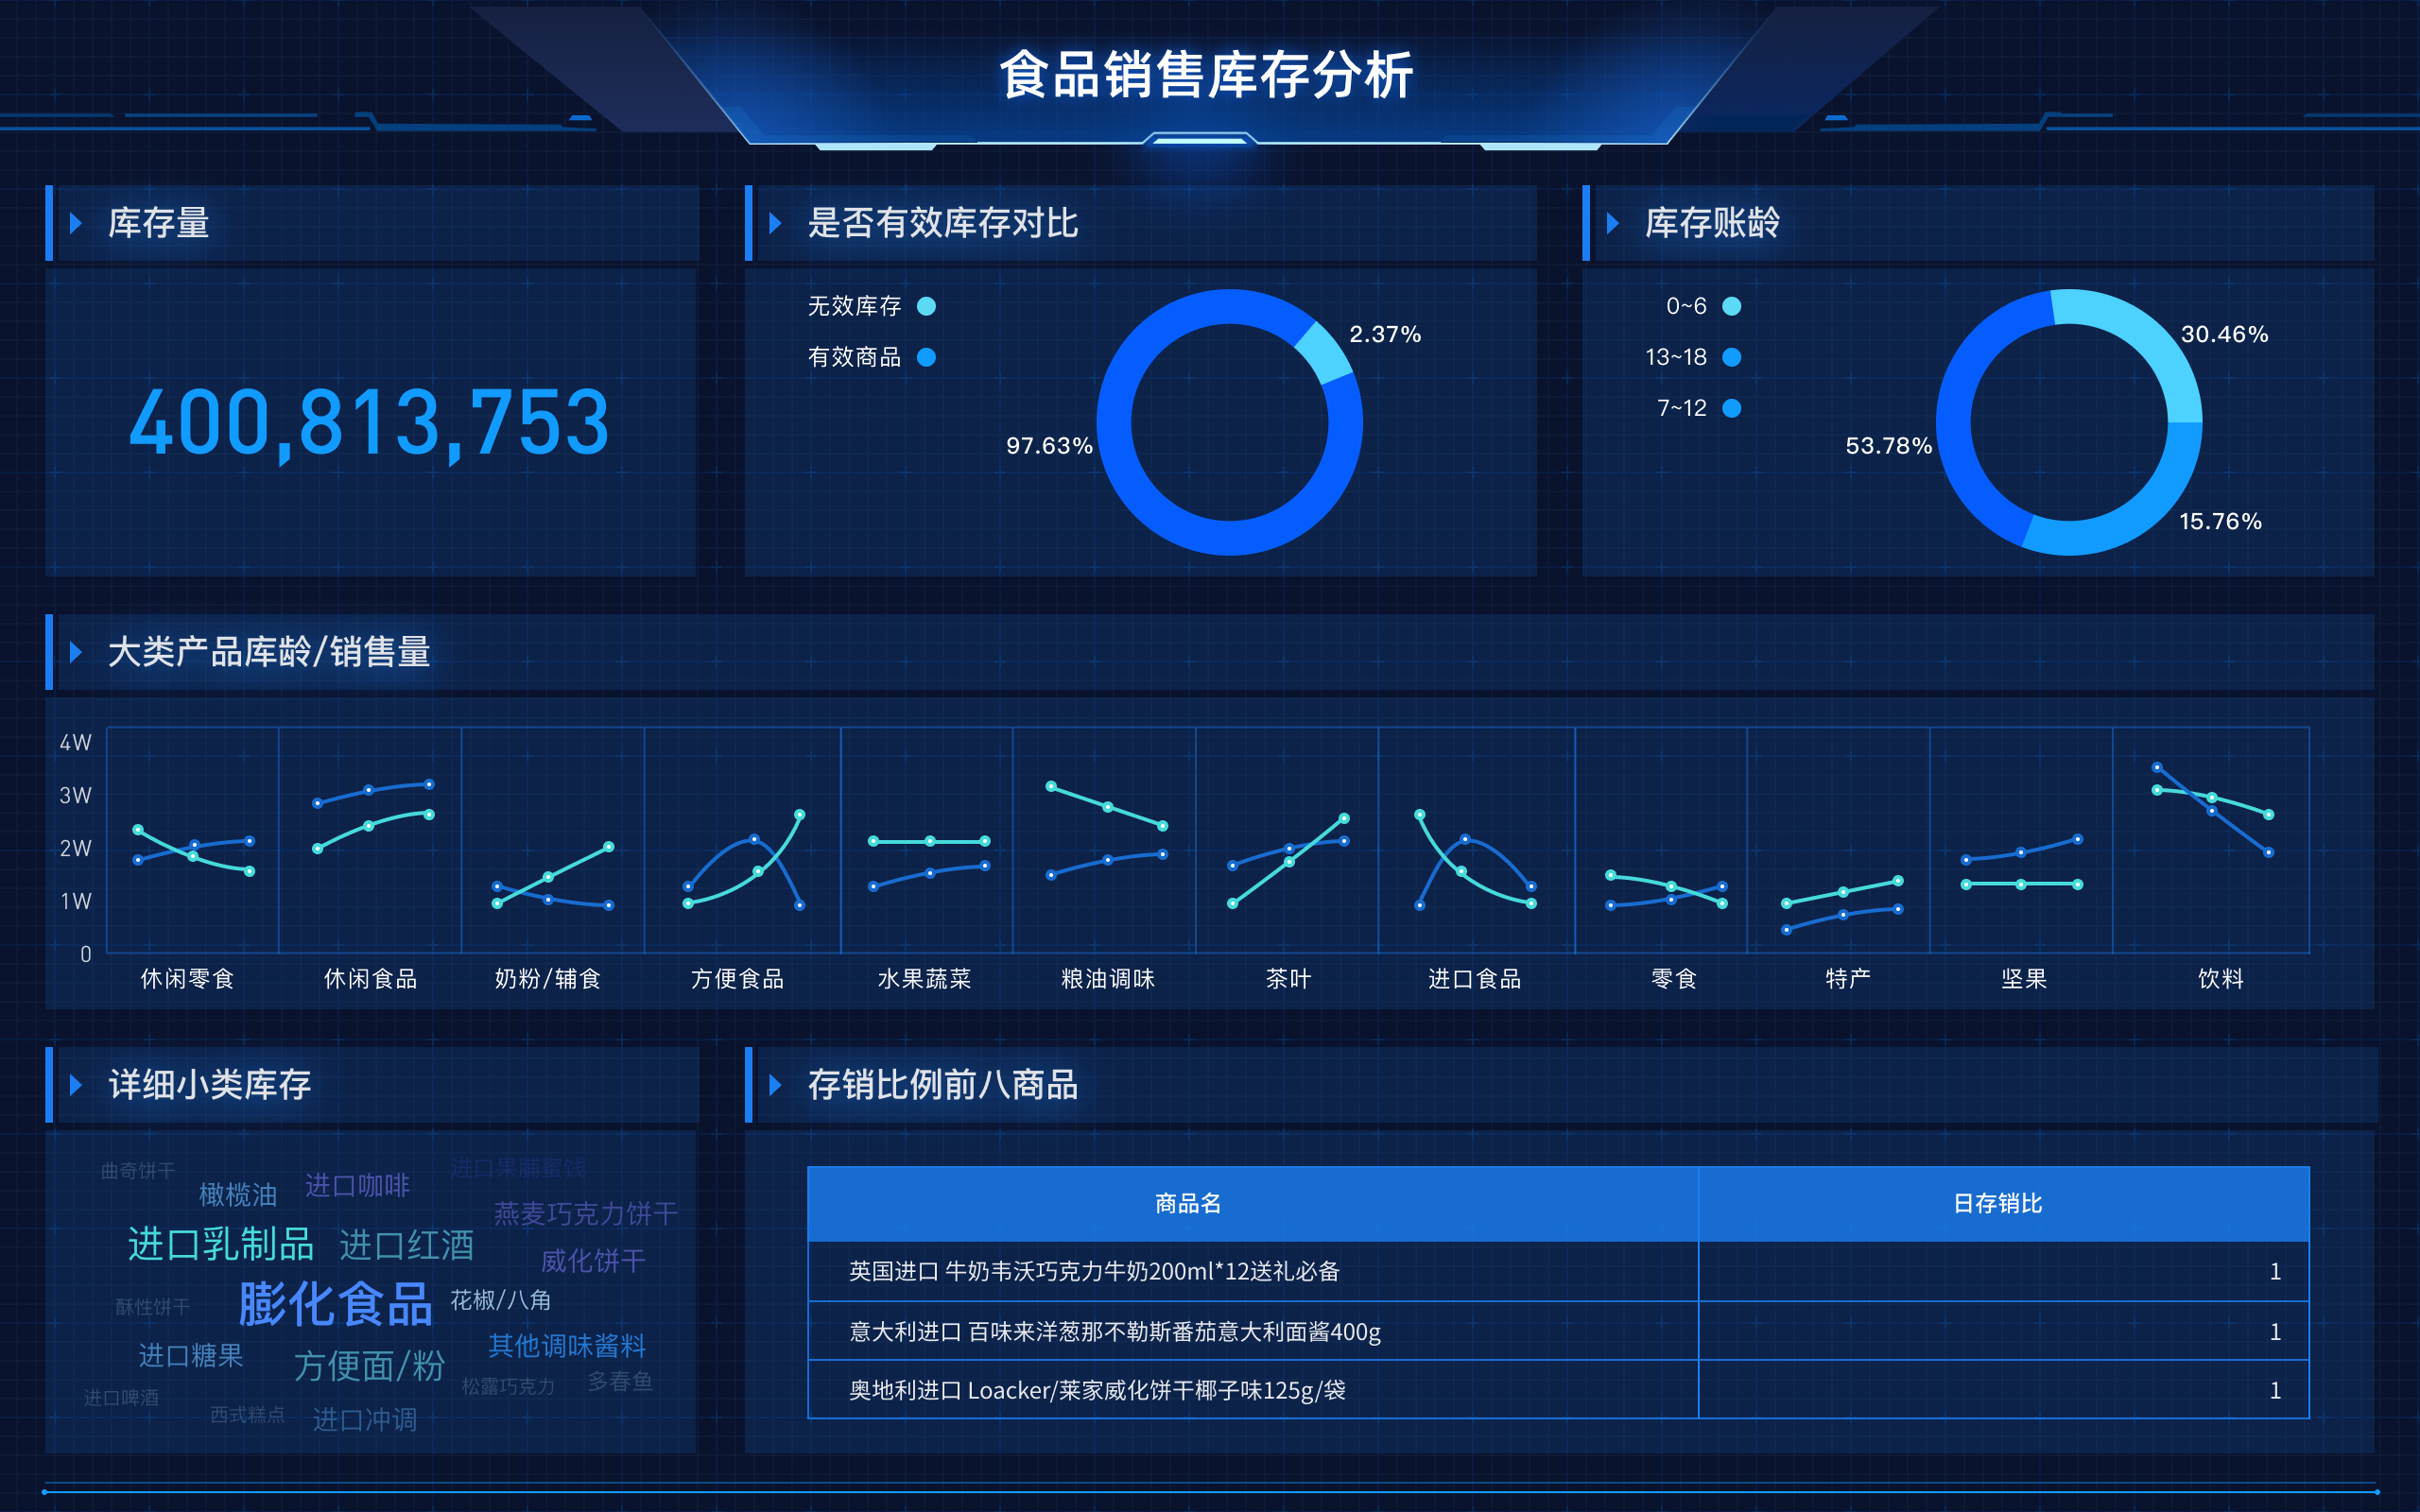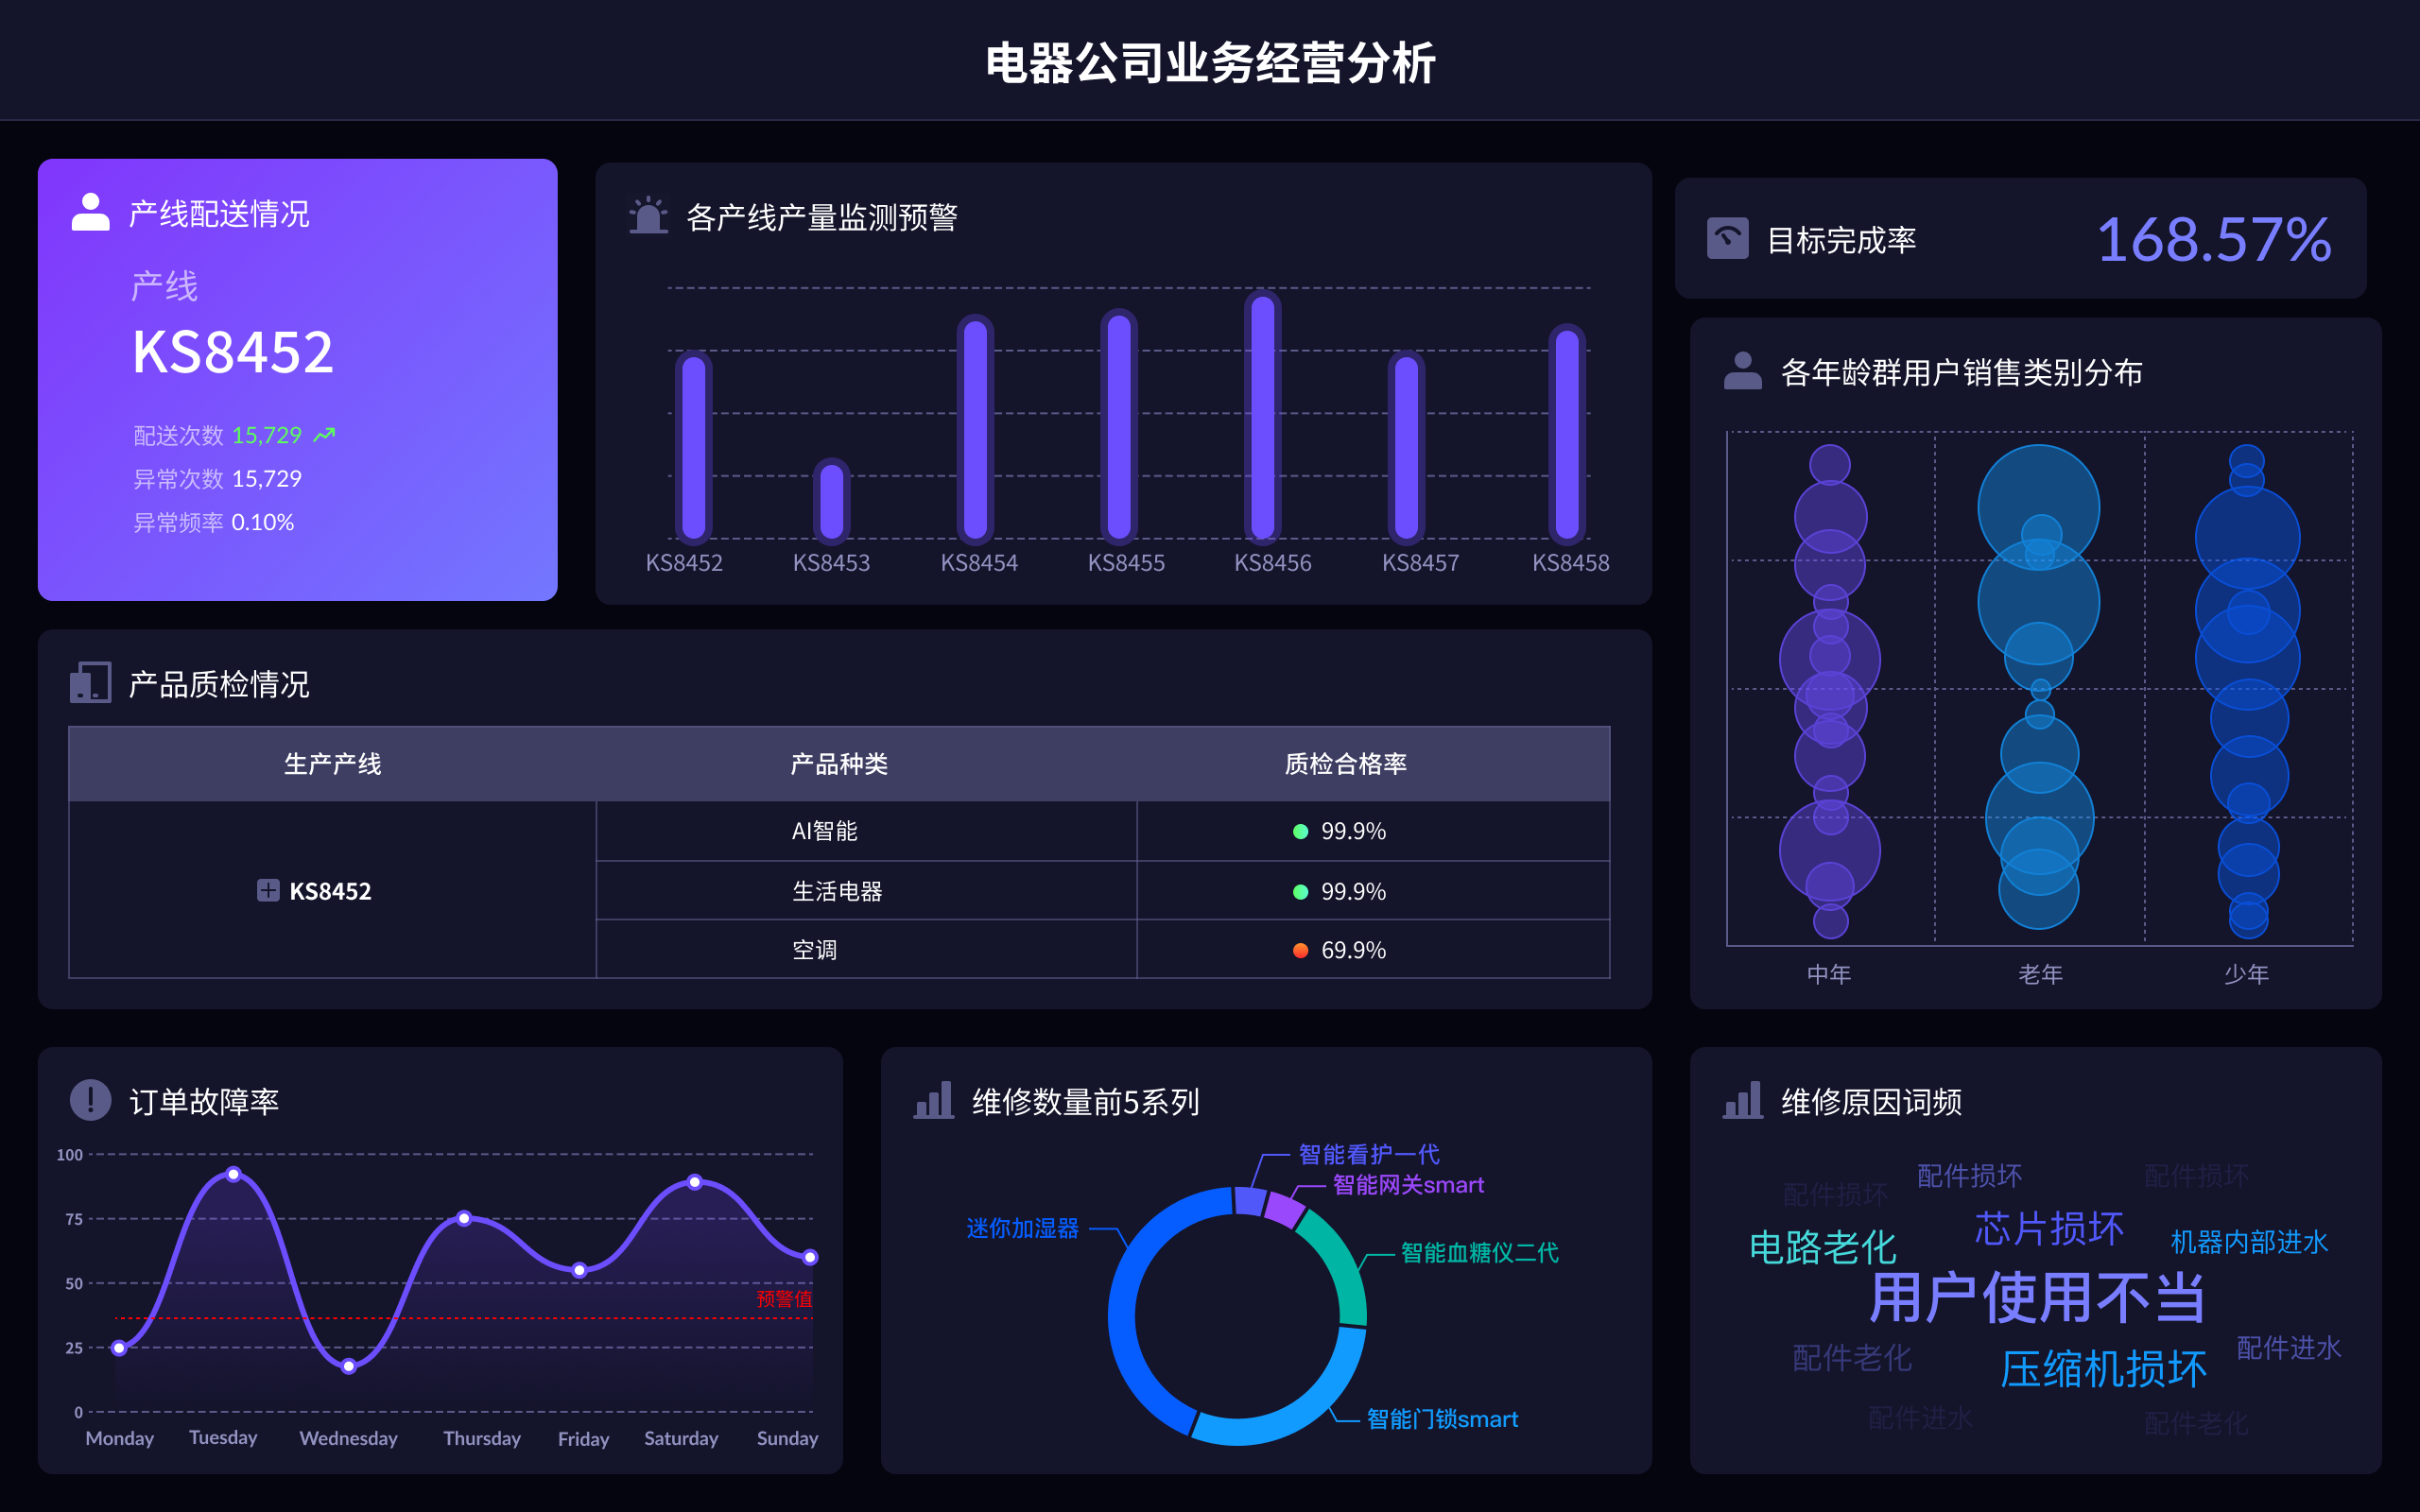
在UI数据可视化领域,有许多插件和工具可以帮助开发者创建交互式和美观的数据可视化图表。常见的UI数据可视化插件包括:D3.js、Chart.js、Highcharts、Echarts、FineBI、FineReport、FineVis,这些插件提供了丰富的功能和灵活性。其中,D3.js以其强大的数据绑定和自定义能力被广泛使用,它允许开发者通过数据驱动的方式生成动态和复杂的可视化效果,适合需要高度定制的项目。
一、D3.JS
D3.js(Data-Driven Documents)是一个基于JavaScript的库,用于创建动态和交互式的数据可视化。D3.js的强大之处在于它可以绑定任意数据到DOM,并应用数据驱动的转换。开发者可以通过D3.js操作DOM,使用SVG、Canvas和HTML创建丰富的图表和数据可视化。
D3.js的主要特点包括:
- 数据绑定和操作:可以将数据绑定到DOM元素,并对这些元素进行操作和转换。
- 灵活性和扩展性:开发者可以完全控制图表的外观和行为,适合高度定制的可视化需求。
- 动画和交互:支持动画效果和交互功能,提升用户体验。
二、CHART.JS
Chart.js是一个简单易用的JavaScript库,用于绘制各种常见的图表。它提供了一系列预设的图表类型,如折线图、柱状图、饼图等,适合快速创建基础图表。
Chart.js的主要特点包括:
- 易用性:简单的API和直观的配置选项,适合初学者。
- 响应式设计:默认支持响应式设计,可以适应不同屏幕尺寸。
- 动画和交互:内置动画效果,支持基本的交互功能。
三、HIGHCHARTS
Highcharts是一个商业图表库,提供了丰富的图表类型和高级功能。Highcharts广泛应用于商业项目中,因其高质量的图表和专业支持。
Highcharts的主要特点包括:
- 多样的图表类型:支持多种图表类型,如折线图、区域图、柱状图、饼图等。
- 高级功能:如实时数据更新、导出功能、丰富的主题和样式选项。
- 兼容性:支持所有主流浏览器,并且可以与Angular、React等框架集成。
四、ECHARTS
Echarts是由百度开源的可视化库,提供了强大的数据可视化能力和丰富的图表类型。Echarts以其优异的性能和丰富的配置选项受到广泛欢迎。
Echarts的主要特点包括:
- 多样的图表类型:包括基本图表、关系图、地图等。
- 强大的配置选项:支持多种数据格式和复杂的图表配置。
- 高性能:使用Canvas绘制,性能优异,适合大规模数据的可视化。
五、FINEBI
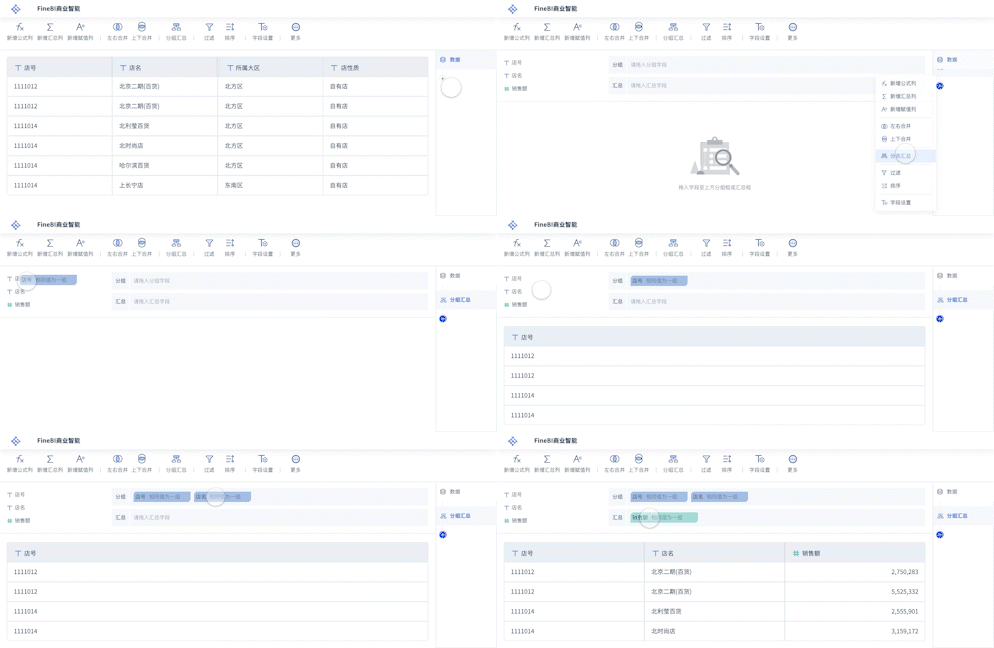
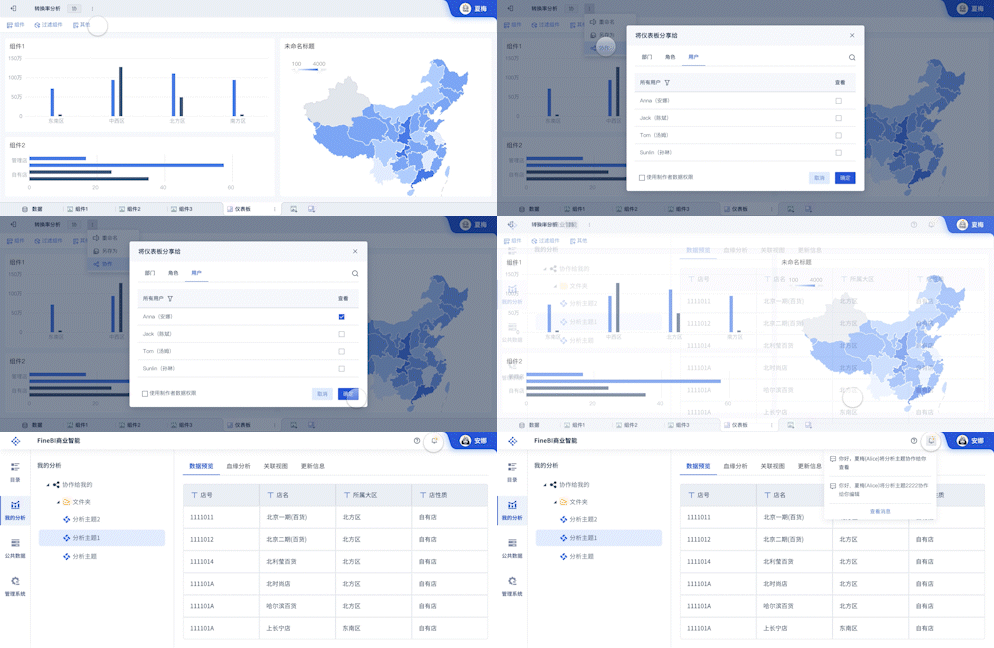
FineBI是帆软公司推出的一款商业智能分析工具,它集成了数据处理、分析和可视化功能,适合企业级应用。FineBI官网:FineBI。
FineBI的主要特点包括:
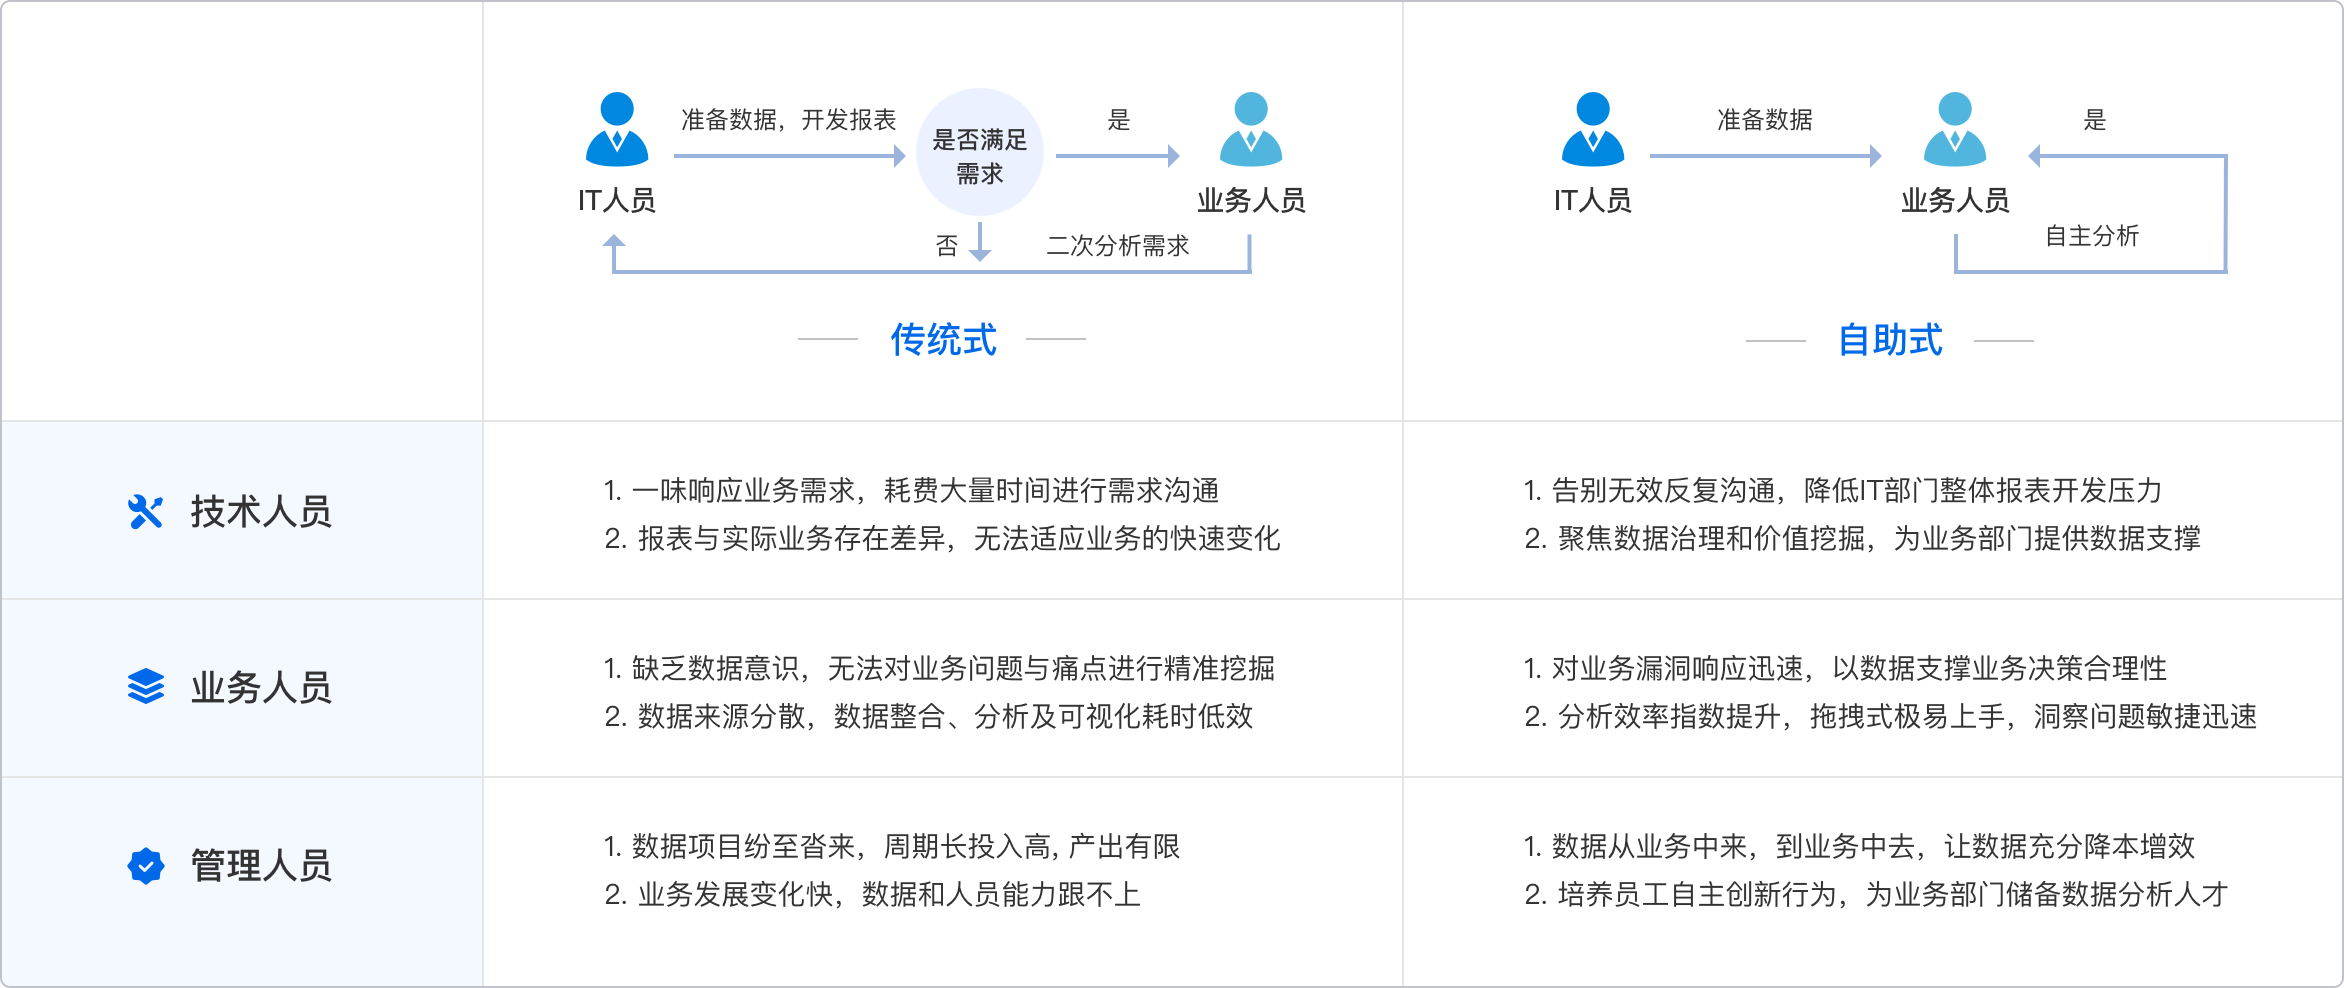
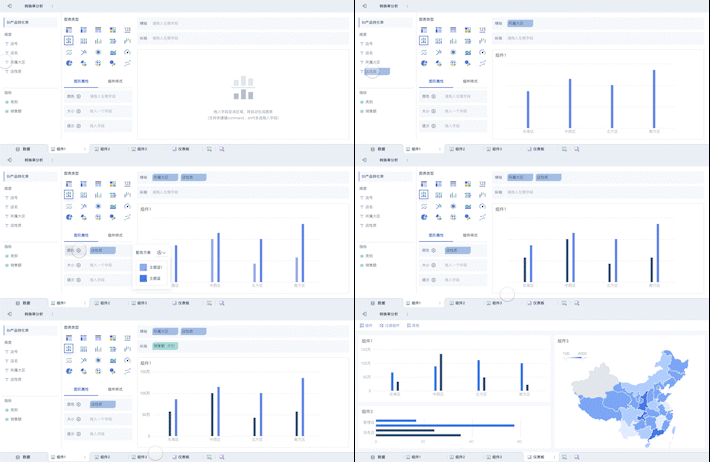
- 自助式分析:用户可以通过拖拽方式完成数据分析和报表制作。
- 丰富的图表类型:支持多种图表类型,满足不同的可视化需求。
- 数据处理能力:内置强大的数据处理引擎,支持复杂的数据转换和计算。
六、FINEREPORT
FineReport同样是帆软公司推出的一款报表工具,主要用于企业报表和数据分析。FineReport官网:FineReport。
FineReport的主要特点包括:
- 模板设计:提供多种报表模板,用户可以快速创建专业的报表。
- 灵活的数据源:支持多种数据源接入,如数据库、Excel等。
- 自动化报表:支持定时任务和自动生成报表,提升工作效率。
七、FINEVIS
FineVis是帆软公司新推出的一款可视化工具,专注于数据可视化和大屏展示。FineVis官网:FineVis。
FineVis的主要特点包括:
- 大屏展示:适合大屏幕数据展示,提供丰富的可视化组件。
- 实时数据:支持实时数据更新,适合监控和展示动态数据。
- 易用性:简单直观的操作界面,用户可以轻松创建和定制可视化内容。
这些UI数据可视化插件各有特点和优势,开发者可以根据具体需求选择合适的工具来实现数据可视化,从而提升数据展示效果和用户体验。
相关问答FAQs:
FAQs about UI Data Visualization Plugins
1. What are the most popular UI data visualization plugins available today?
When it comes to UI data visualization, several plugins stand out for their features and versatility. Some of the most popular ones include:
-
D3.js: A powerful JavaScript library for creating custom, dynamic, and interactive visualizations using web standards. It offers extensive control over the final appearance and functionality of visual elements.
-
Chart.js: Known for its simplicity and ease of use, Chart.js is ideal for creating common chart types such as line, bar, and pie charts. It offers a range of customization options and a responsive design.
-
Highcharts: This library provides a wide array of chart types and is known for its high performance and ease of integration. Highcharts also supports real-time data updates and offers extensive documentation.
-
ECharts: Developed by Baidu, ECharts is a robust, feature-rich library that supports a variety of charts and visualizations. Its emphasis on performance and interactivity makes it suitable for complex datasets.
-
ApexCharts: ApexCharts provides a wide range of chart types and features, including real-time data updates and a user-friendly API. It also supports responsive and accessible design.
Each of these plugins offers unique features that cater to different needs, from simple charts to complex, interactive data visualizations. Choosing the right plugin depends on factors such as the complexity of the data, the level of customization required, and the specific requirements of your project.
2. How do I choose the right UI data visualization plugin for my project?
Selecting the appropriate UI data visualization plugin involves several considerations:
-
Project Requirements: Assess the complexity of the data you need to visualize. For simple charts and graphs, lightweight libraries like Chart.js might be sufficient. For more complex visualizations involving large datasets and custom interactions, D3.js or Highcharts may be more appropriate.
-
Customization Needs: Determine how much control you need over the appearance and behavior of your visualizations. D3.js offers extensive customization options but requires more effort to implement. In contrast, Chart.js and ApexCharts provide a more straightforward setup with fewer customization options.
-
Performance Considerations: Consider the performance requirements of your application, especially if you’re dealing with real-time data or large datasets. Highcharts and ECharts are designed to handle high-performance scenarios effectively.
-
Integration and Compatibility: Ensure the plugin integrates seamlessly with your existing technology stack. Check for compatibility with frameworks and libraries you are already using.
-
Documentation and Support: Good documentation and active community support can significantly ease the development process. Plugins like Highcharts and ECharts offer extensive documentation and community support.
Evaluating these factors will help you make an informed decision and select a plugin that best fits your project's needs and constraints.
3. What are the key features to look for in a UI data visualization plugin?
When evaluating UI data visualization plugins, consider the following key features:
-
Variety of Chart Types: A diverse range of chart types allows you to present data in the most effective manner. Look for plugins that offer multiple chart types such as bar, line, pie, scatter, and more advanced options like heatmaps or tree maps.
-
Customization and Flexibility: The ability to customize visual elements such as colors, labels, and tooltips can enhance the user experience and align visualizations with your brand’s design. Plugins with flexible customization options enable you to tailor visualizations to specific needs.
-
Performance: Performance is crucial, especially for large datasets and real-time data updates. Plugins that are optimized for speed and efficiency can handle complex visualizations without significant lag.
-
Interactivity: Interactive features like zooming, panning, and data highlighting enhance the usability of visualizations. These features allow users to explore data in more detail and improve the overall user experience.
-
Responsiveness: With the increasing use of mobile devices, ensuring that visualizations are responsive and adapt to different screen sizes is essential. Choose plugins that offer responsive design capabilities.
-
Ease of Integration: Consider how easily the plugin integrates with your existing technology stack and development environment. A plugin with straightforward integration can save time and reduce development complexity.
-
Documentation and Support: Comprehensive documentation and active community or commercial support can make a significant difference in the development process. Good support resources can help troubleshoot issues and ensure smooth implementation.
By focusing on these features, you can select a UI data visualization plugin that meets your specific needs and enhances the effectiveness of your data presentation.
本文内容通过AI工具匹配关键字智能整合而成,仅供参考,帆软不对内容的真实、准确或完整作任何形式的承诺。具体产品功能请以帆软官方帮助文档为准,或联系您的对接销售进行咨询。如有其他问题,您可以通过联系blog@fanruan.com进行反馈,帆软收到您的反馈后将及时答复和处理。


