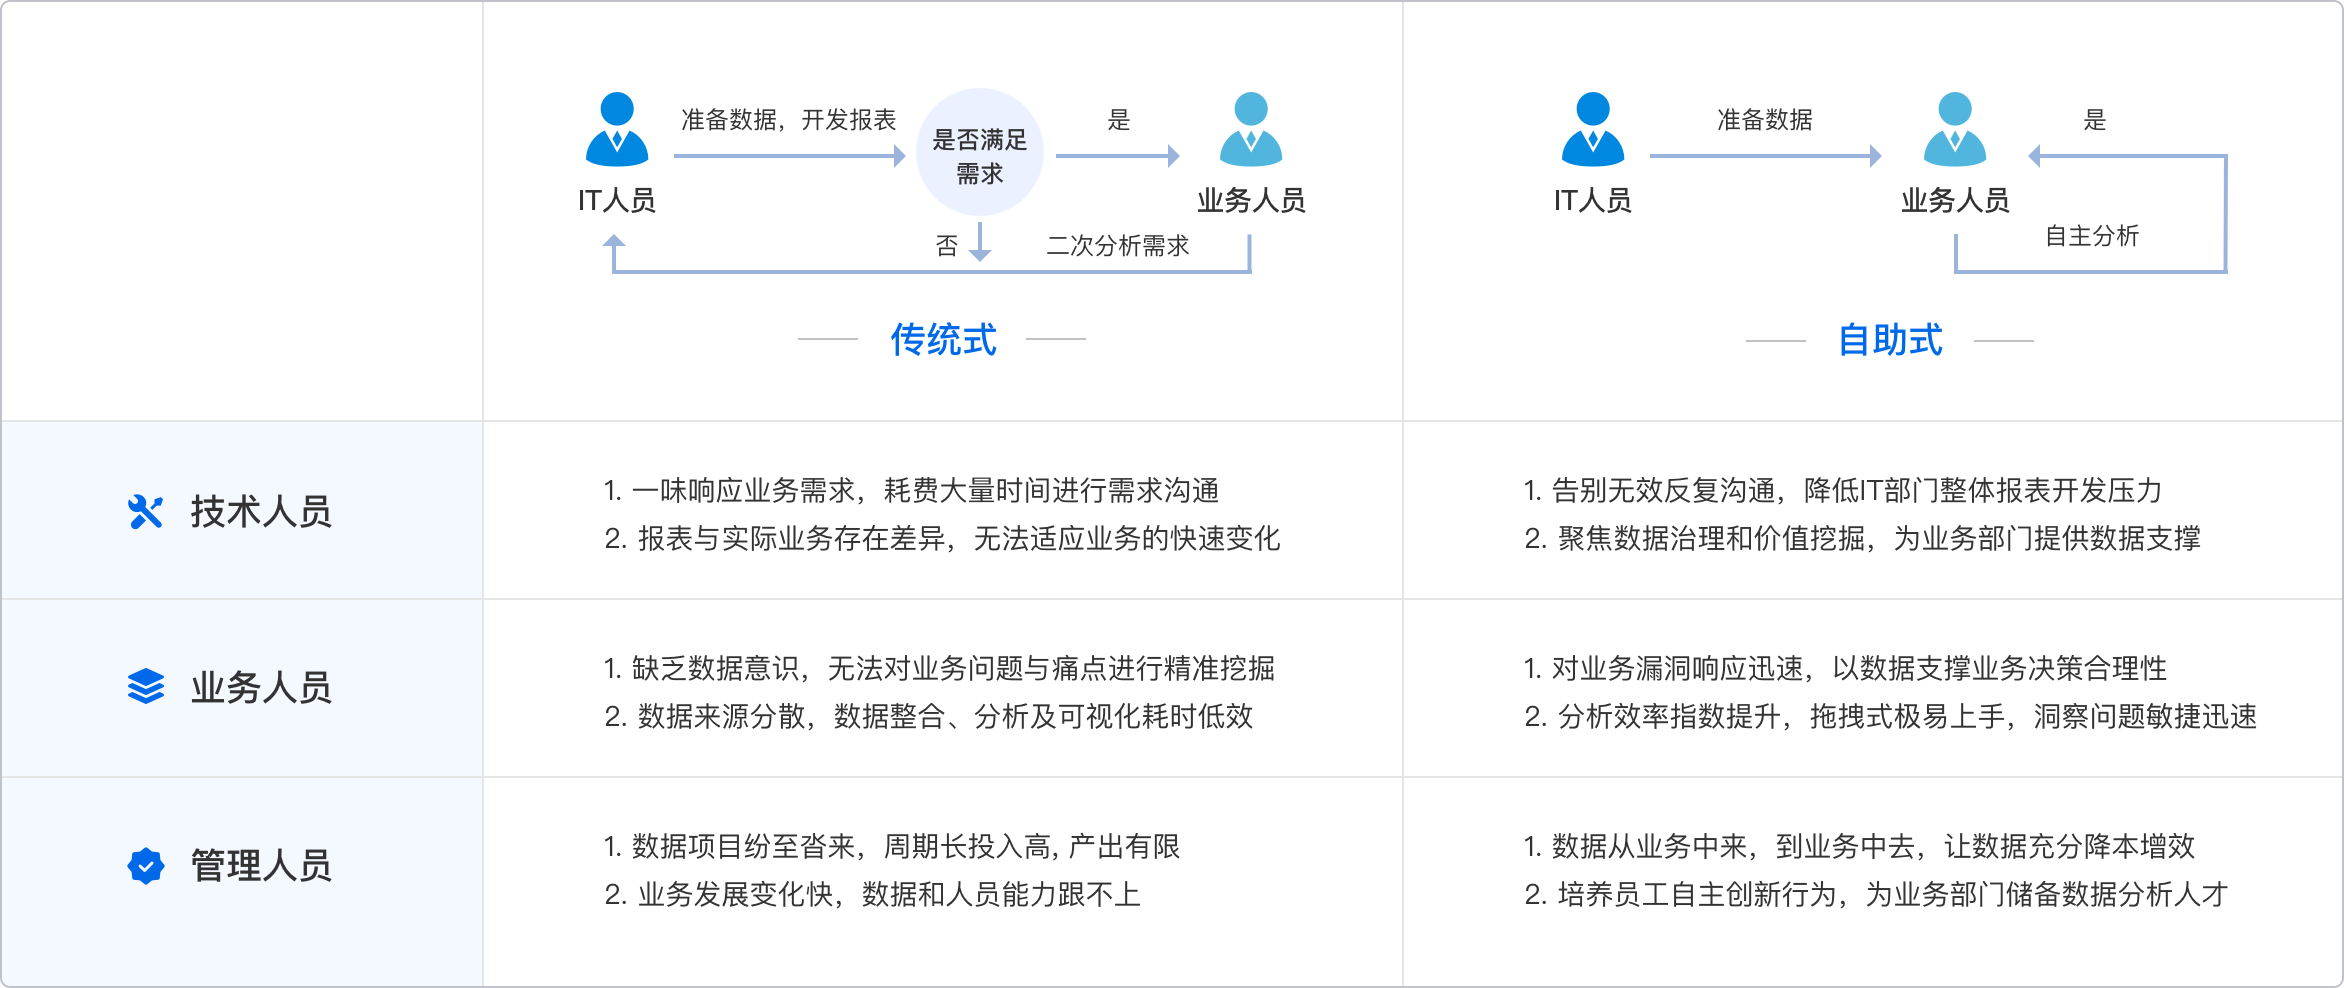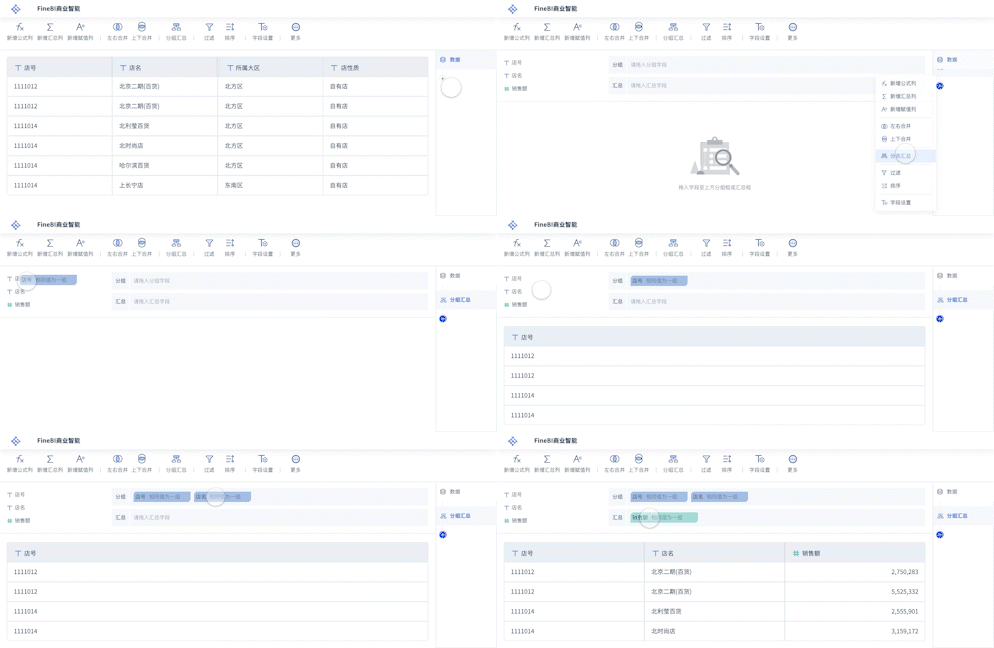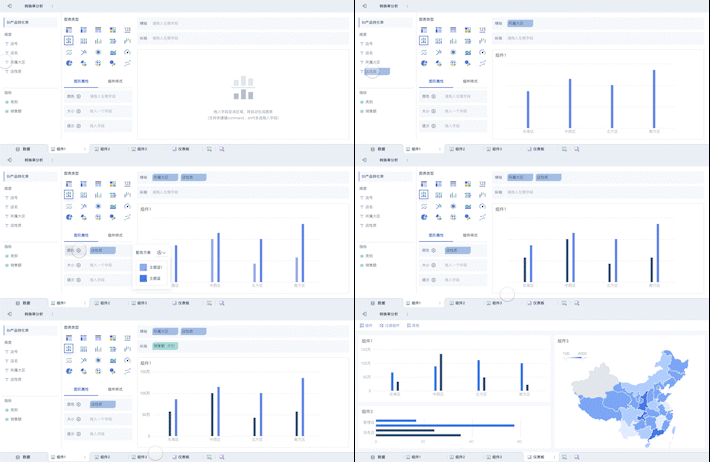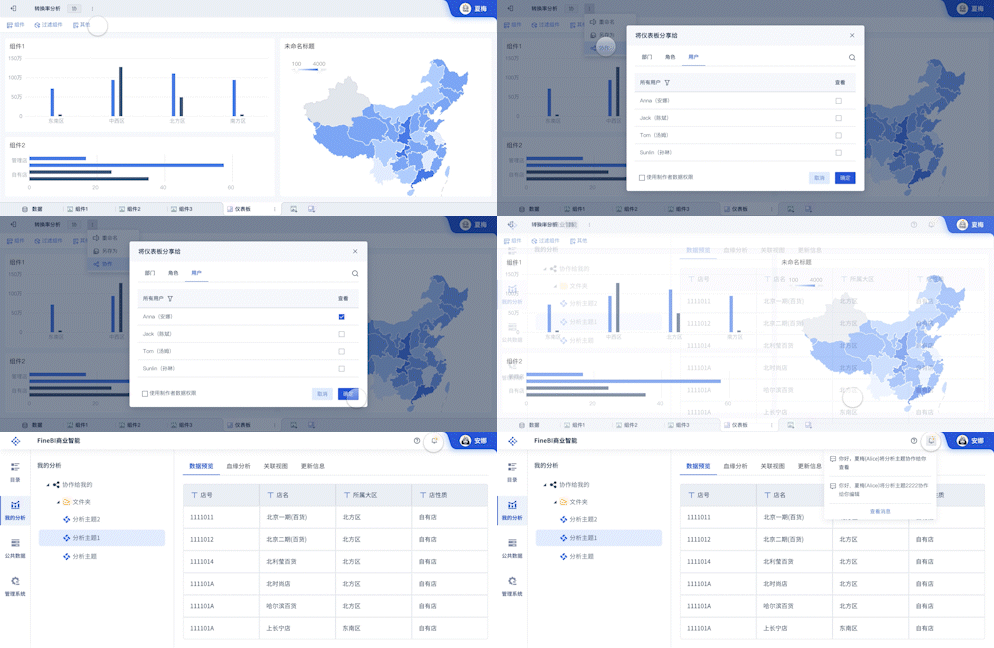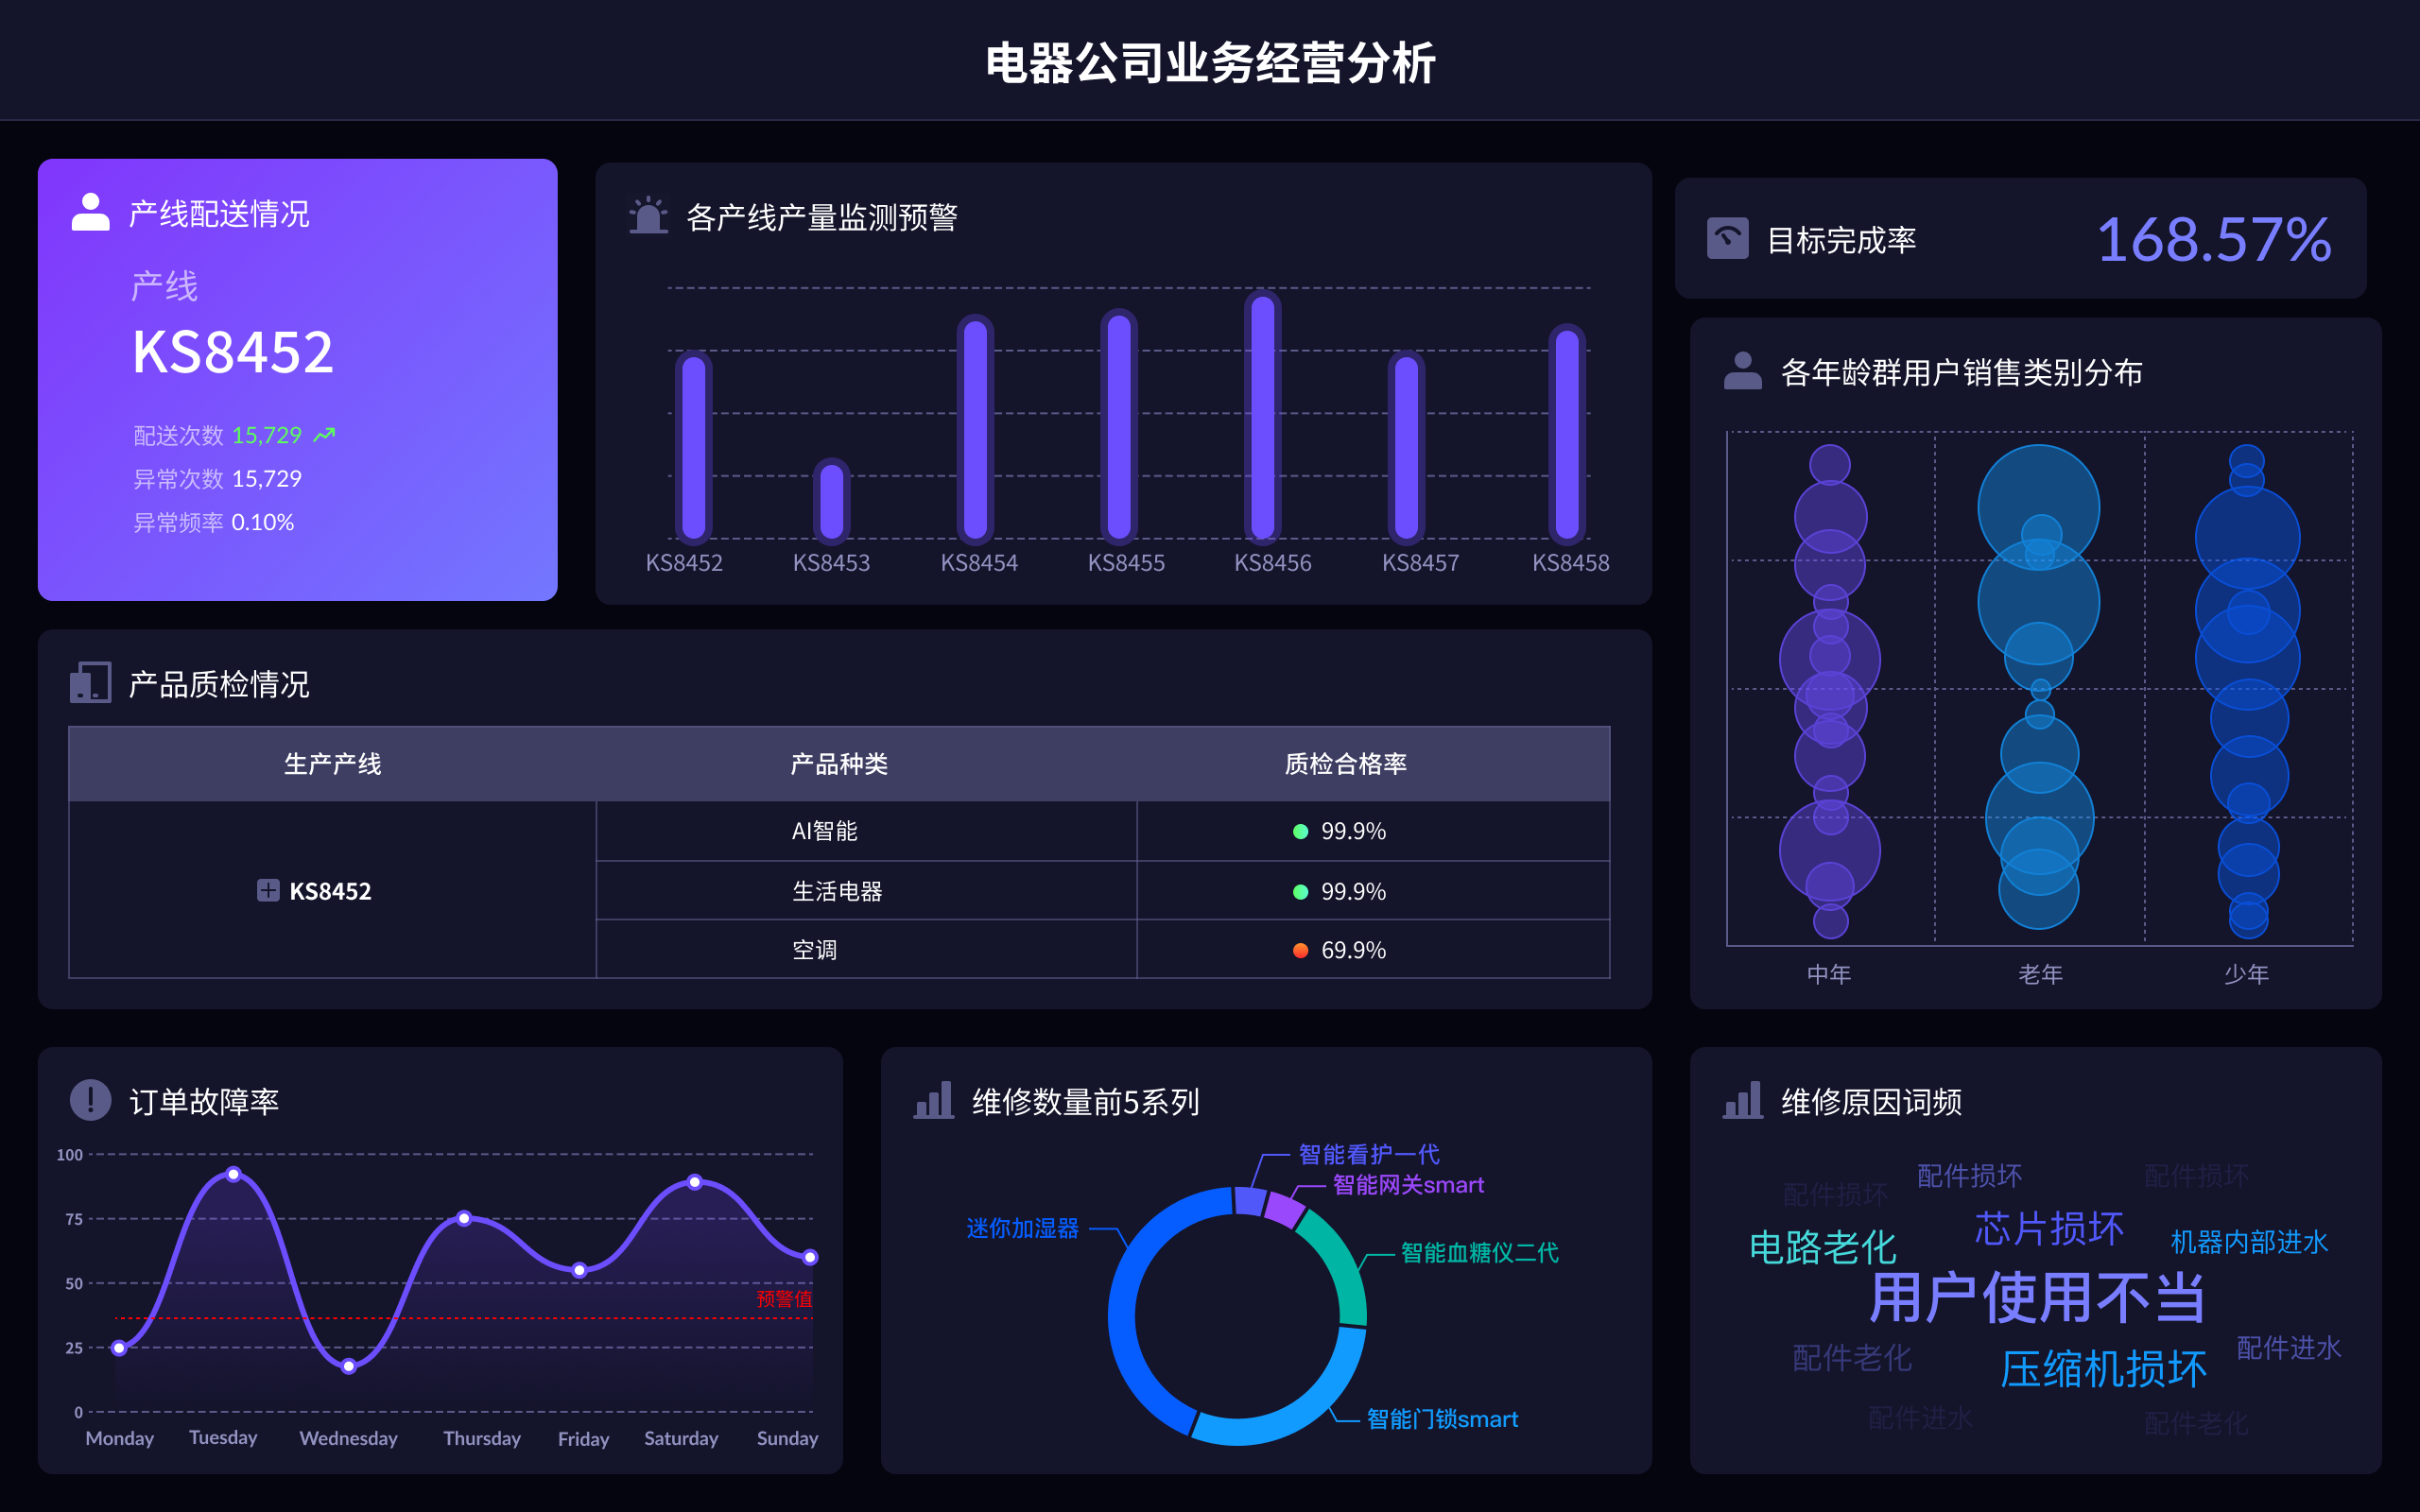
在SQL可视化窗口插入数据的方法包括:使用INSERT INTO语句、导入CSV文件、利用可视化工具的表格功能。这些方法各有优劣,其中使用INSERT INTO语句最为灵活,适用于需要精细控制插入数据的场景。通过INSERT INTO语句,用户可以在SQL编辑器中直接编写插入数据的SQL语句,指定目标表及其对应的字段,详细控制插入的数据内容。相对于导入CSV文件和利用可视化工具的表格功能,这种方法不仅更为灵活,而且能更好地满足复杂的数据插入需求。
一、INSERT INTO语句插入数据
INSERT INTO语句是SQL中用于插入数据的基本命令。使用这种方式,可以精细控制插入的数据内容和格式。具体步骤如下:
- 选择目标表:在SQL可视化窗口中,首先选择需要插入数据的目标表。
- 编写INSERT INTO语句:在SQL编辑器中编写插入数据的SQL语句。基本语法如下:
INSERT INTO 表名 (列1, 列2, 列3, ...)VALUES (值1, 值2, 值3, ...);
例如,向名为“students”的表中插入一条新记录:
INSERT INTO students (name, age, grade)VALUES ('Alice', 14, '8th');
- 执行语句:编写完成后,点击执行按钮运行该SQL语句,数据将被插入到指定的表中。
这种方法适用于需要逐条插入数据的情况,也可以通过一次插入多条记录,提高效率。其优点是灵活性强,可以针对不同的需求进行调整。
二、导入CSV文件插入数据
导入CSV文件是一种批量插入数据的高效方法,特别适合处理大量数据。操作步骤如下:
- 准备CSV文件:确保CSV文件格式正确,每一行对应一条记录,每列对应表中的一个字段。
- 选择导入功能:在SQL可视化工具中,选择“导入数据”或类似功能。
- 上传CSV文件:根据提示上传需要导入的CSV文件。
- 映射字段:将CSV文件中的列与数据库表中的字段进行映射,确保数据能够正确插入。
- 执行导入:完成映射后,执行导入操作,系统会自动将CSV文件中的数据插入到指定的表中。
导入CSV文件的优点在于效率高,能够快速处理大量数据,但需要确保CSV文件的格式和数据正确,以避免数据插入错误。
三、利用可视化工具的表格功能插入数据
一些SQL可视化工具提供了表格视图,允许用户通过图形界面直接编辑数据。具体操作如下:
- 打开表格视图:在可视化工具中打开目标表的表格视图。
- 添加新行:在表格视图中添加一行新记录。
- 填写数据:直接在表格中输入每个字段的值。
- 保存更改:完成数据输入后,保存更改,数据将被插入到表中。
这种方法直观易用,适合小规模数据插入或数据修改,但效率较低,不适合处理大量数据。
四、FineBI、FineReport、FineVis数据可视化工具的插入数据方法
帆软旗下的FineBI、FineReport和FineVis是常用的数据可视化工具,它们在数据插入和管理方面各有特色。
FineBI:
- 数据准备:通过FineBI的数据准备功能,可以从各种数据源导入数据,包括数据库、Excel、CSV等。
- 数据清洗:导入数据后,可以利用FineBI的数据清洗功能,进行数据预处理,确保数据质量。
- 数据插入:利用FineBI的自定义SQL查询功能,可以编写INSERT INTO语句,直接向数据库插入数据。
FineReport:
- 数据源连接:通过FineReport连接到数据库或其他数据源。
- 数据集管理:创建数据集并进行数据准备。
- 插入数据:在FineReport中,可以通过报表的编辑界面直接编辑数据,或使用SQL语句进行数据插入。
FineVis:
- 数据导入:FineVis支持从多种数据源导入数据,包括数据库、CSV文件等。
- 数据管理:导入数据后,可以利用FineVis的数据管理功能,进行数据的预处理和清洗。
- 可视化编辑:在FineVis的可视化编辑界面中,可以通过交互操作插入和修改数据。
了解更多关于FineBI、FineReport和FineVis的信息,可以访问它们的官网:
通过以上方法,用户可以根据具体需求和工具特性,选择最合适的方式在SQL可视化窗口中插入数据。无论是使用INSERT INTO语句的灵活性,还是利用导入CSV文件的高效,亦或是通过可视化工具的直观操作,都能帮助用户有效地管理和操作数据。
相关问答FAQs:
FAQs about Inserting Data in SQL Visualization Windows
1. What are the common methods to insert data into a SQL visualization window?
In SQL visualization tools, inserting data typically involves several common methods. One popular approach is using the GUI (Graphical User Interface) features of the tool. Many visualization tools offer a user-friendly interface where you can manually input data directly into tables. This method is often straightforward and suitable for small datasets or quick data entries.
Another method involves using SQL queries to insert data programmatically. This is especially useful for larger datasets or when working with automated scripts. In this case, you can use the INSERT INTO SQL statement, which allows you to add new rows to a table. For example:
INSERT INTO table_name (column1, column2, column3)
VALUES (value1, value2, value3);
This command adds a new record with specified values into the designated columns of the table.
Additionally, some advanced visualization tools support integration with data sources like CSV files or spreadsheets. You can import data from these sources into the visualization window, which is convenient for bulk data insertion and ensures that your data remains consistent with external files.
2. How can I ensure data integrity when inserting data in SQL visualization windows?
Ensuring data integrity during insertion involves several practices. Firstly, it’s essential to validate data before insertion to prevent errors or inconsistencies. Most SQL visualization tools provide validation rules or constraints that can be set up to enforce data integrity. For instance, you can define primary keys to uniquely identify records, or set up foreign key constraints to maintain relationships between tables.
Additionally, using transactions can help maintain data integrity. Transactions allow you to group multiple SQL operations into a single unit of work, ensuring that either all operations complete successfully or none of them do. This approach prevents partial updates and maintains the consistency of your data. An example of using transactions in SQL is:
BEGIN TRANSACTION;
INSERT INTO table_name (column1, column2) VALUES (value1, value2);
UPDATE another_table SET column = new_value WHERE condition;
COMMIT;
It’s also crucial to handle errors gracefully. Implementing error handling mechanisms, such as TRY...CATCH blocks, can capture and manage any issues that occur during data insertion, allowing you to address problems without affecting the overall data integrity.
3. What are the best practices for managing large datasets in SQL visualization windows?
Managing large datasets in SQL visualization tools requires strategic approaches to maintain performance and usability. One best practice is to use indexing to speed up query performance. Indexes help quickly locate and retrieve data, making operations on large datasets more efficient. For example, creating an index on a frequently queried column can significantly reduce query execution time.
Partitioning is another effective strategy. By dividing a large table into smaller, more manageable pieces, you can improve query performance and simplify data management. This approach is particularly beneficial for handling very large tables where operations on the entire dataset could be inefficient.
Additionally, optimizing data import and export processes can enhance performance. Batch processing allows you to insert or update data in chunks rather than one record at a time, reducing the overall time and resource consumption. For instance, instead of inserting individual rows, you can use bulk insert operations to load data more efficiently.
Regular maintenance tasks such as updating statistics, rebuilding indexes, and monitoring performance can help ensure that your SQL visualization tool remains responsive and capable of handling large datasets effectively.
本文内容通过AI工具匹配关键字智能整合而成,仅供参考,帆软不对内容的真实、准确或完整作任何形式的承诺。具体产品功能请以帆软官方帮助文档为准,或联系您的对接销售进行咨询。如有其他问题,您可以通过联系blog@fanruan.com进行反馈,帆软收到您的反馈后将及时答复和处理。


