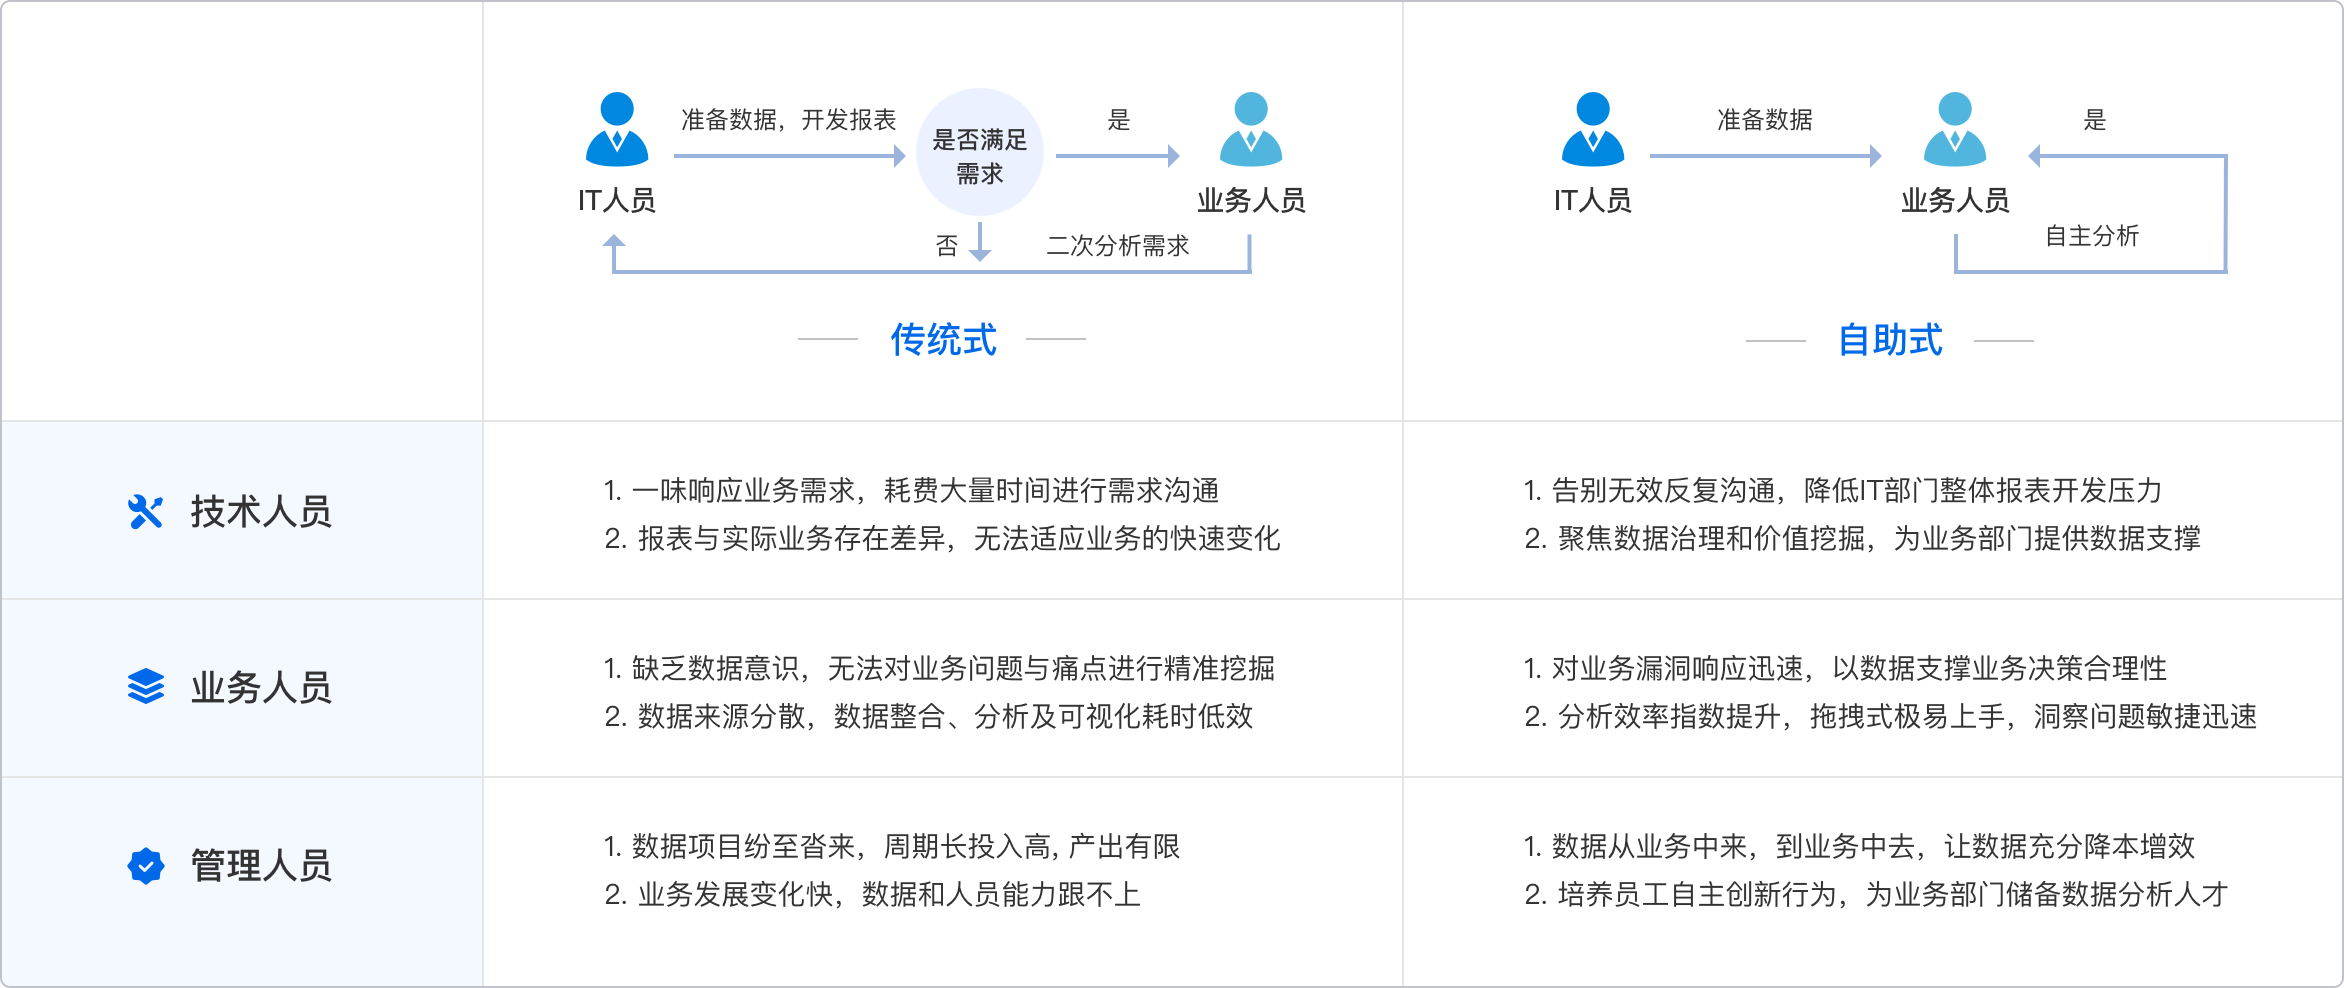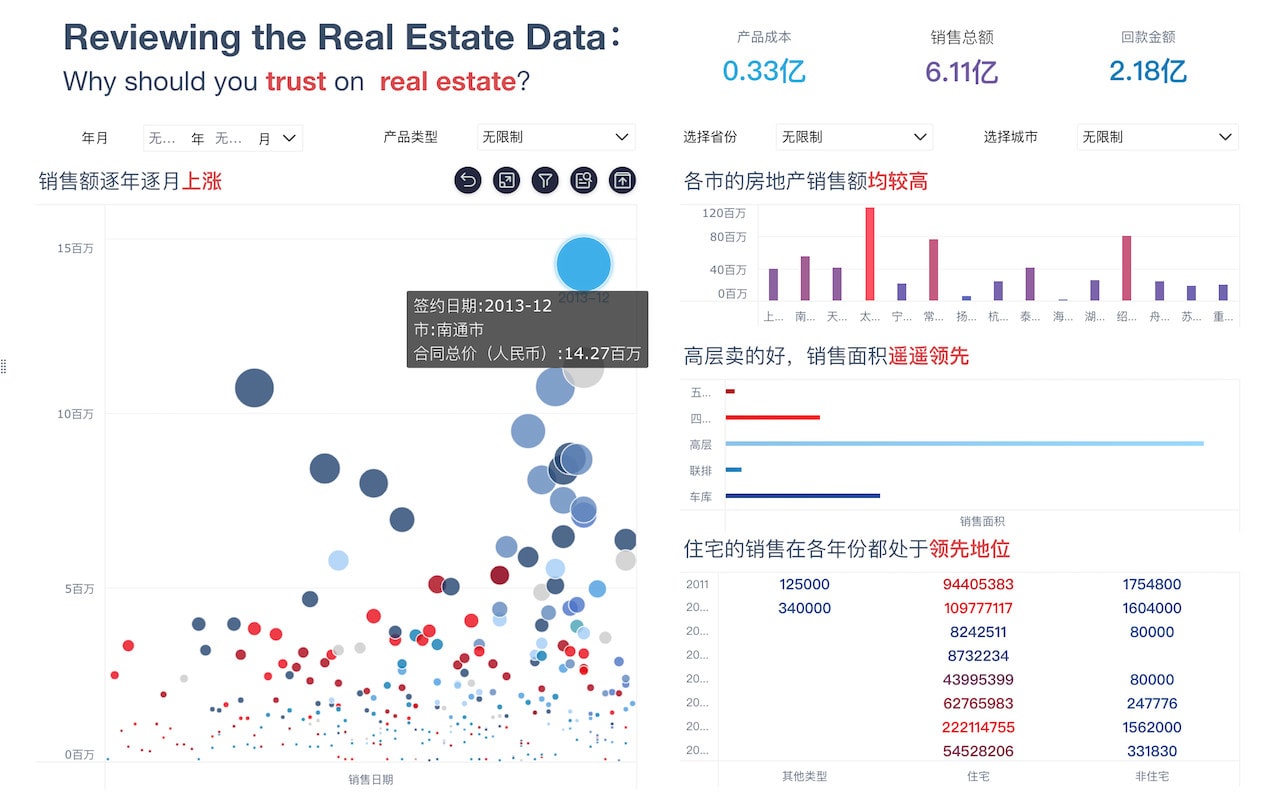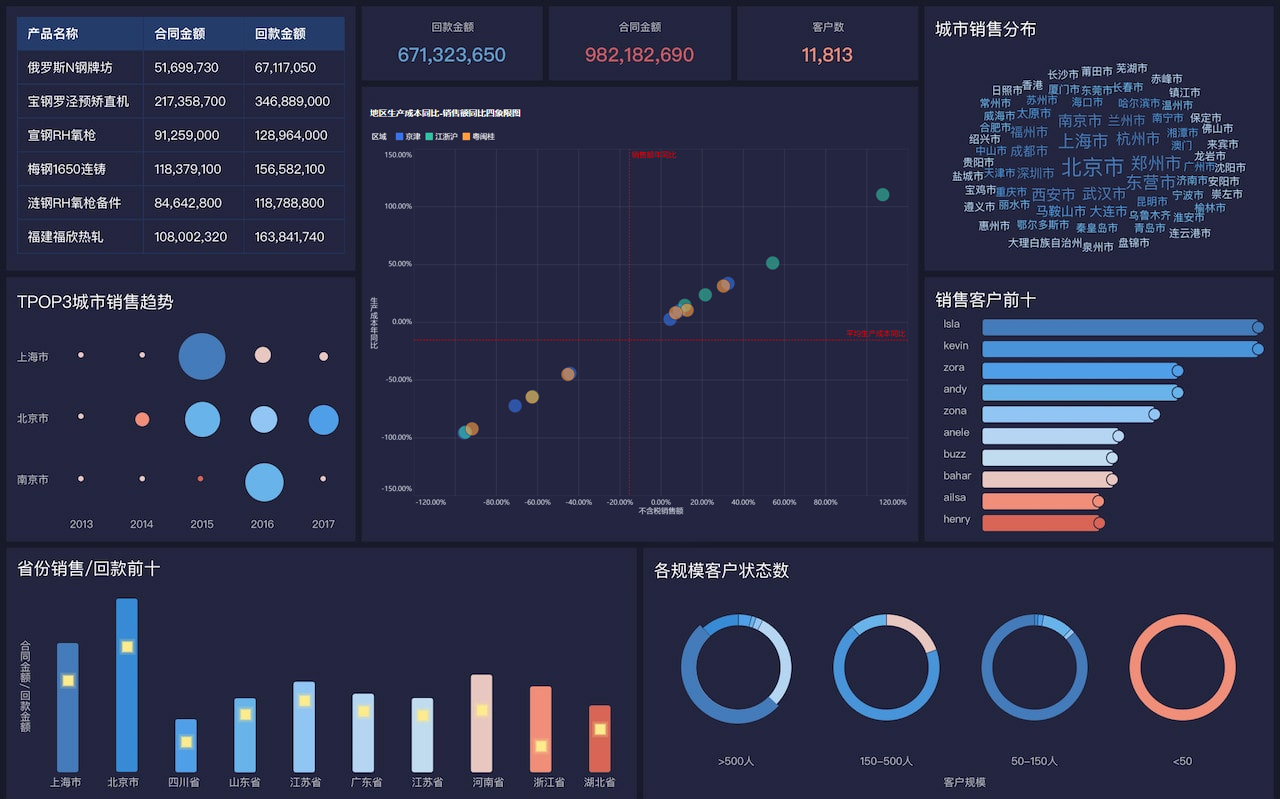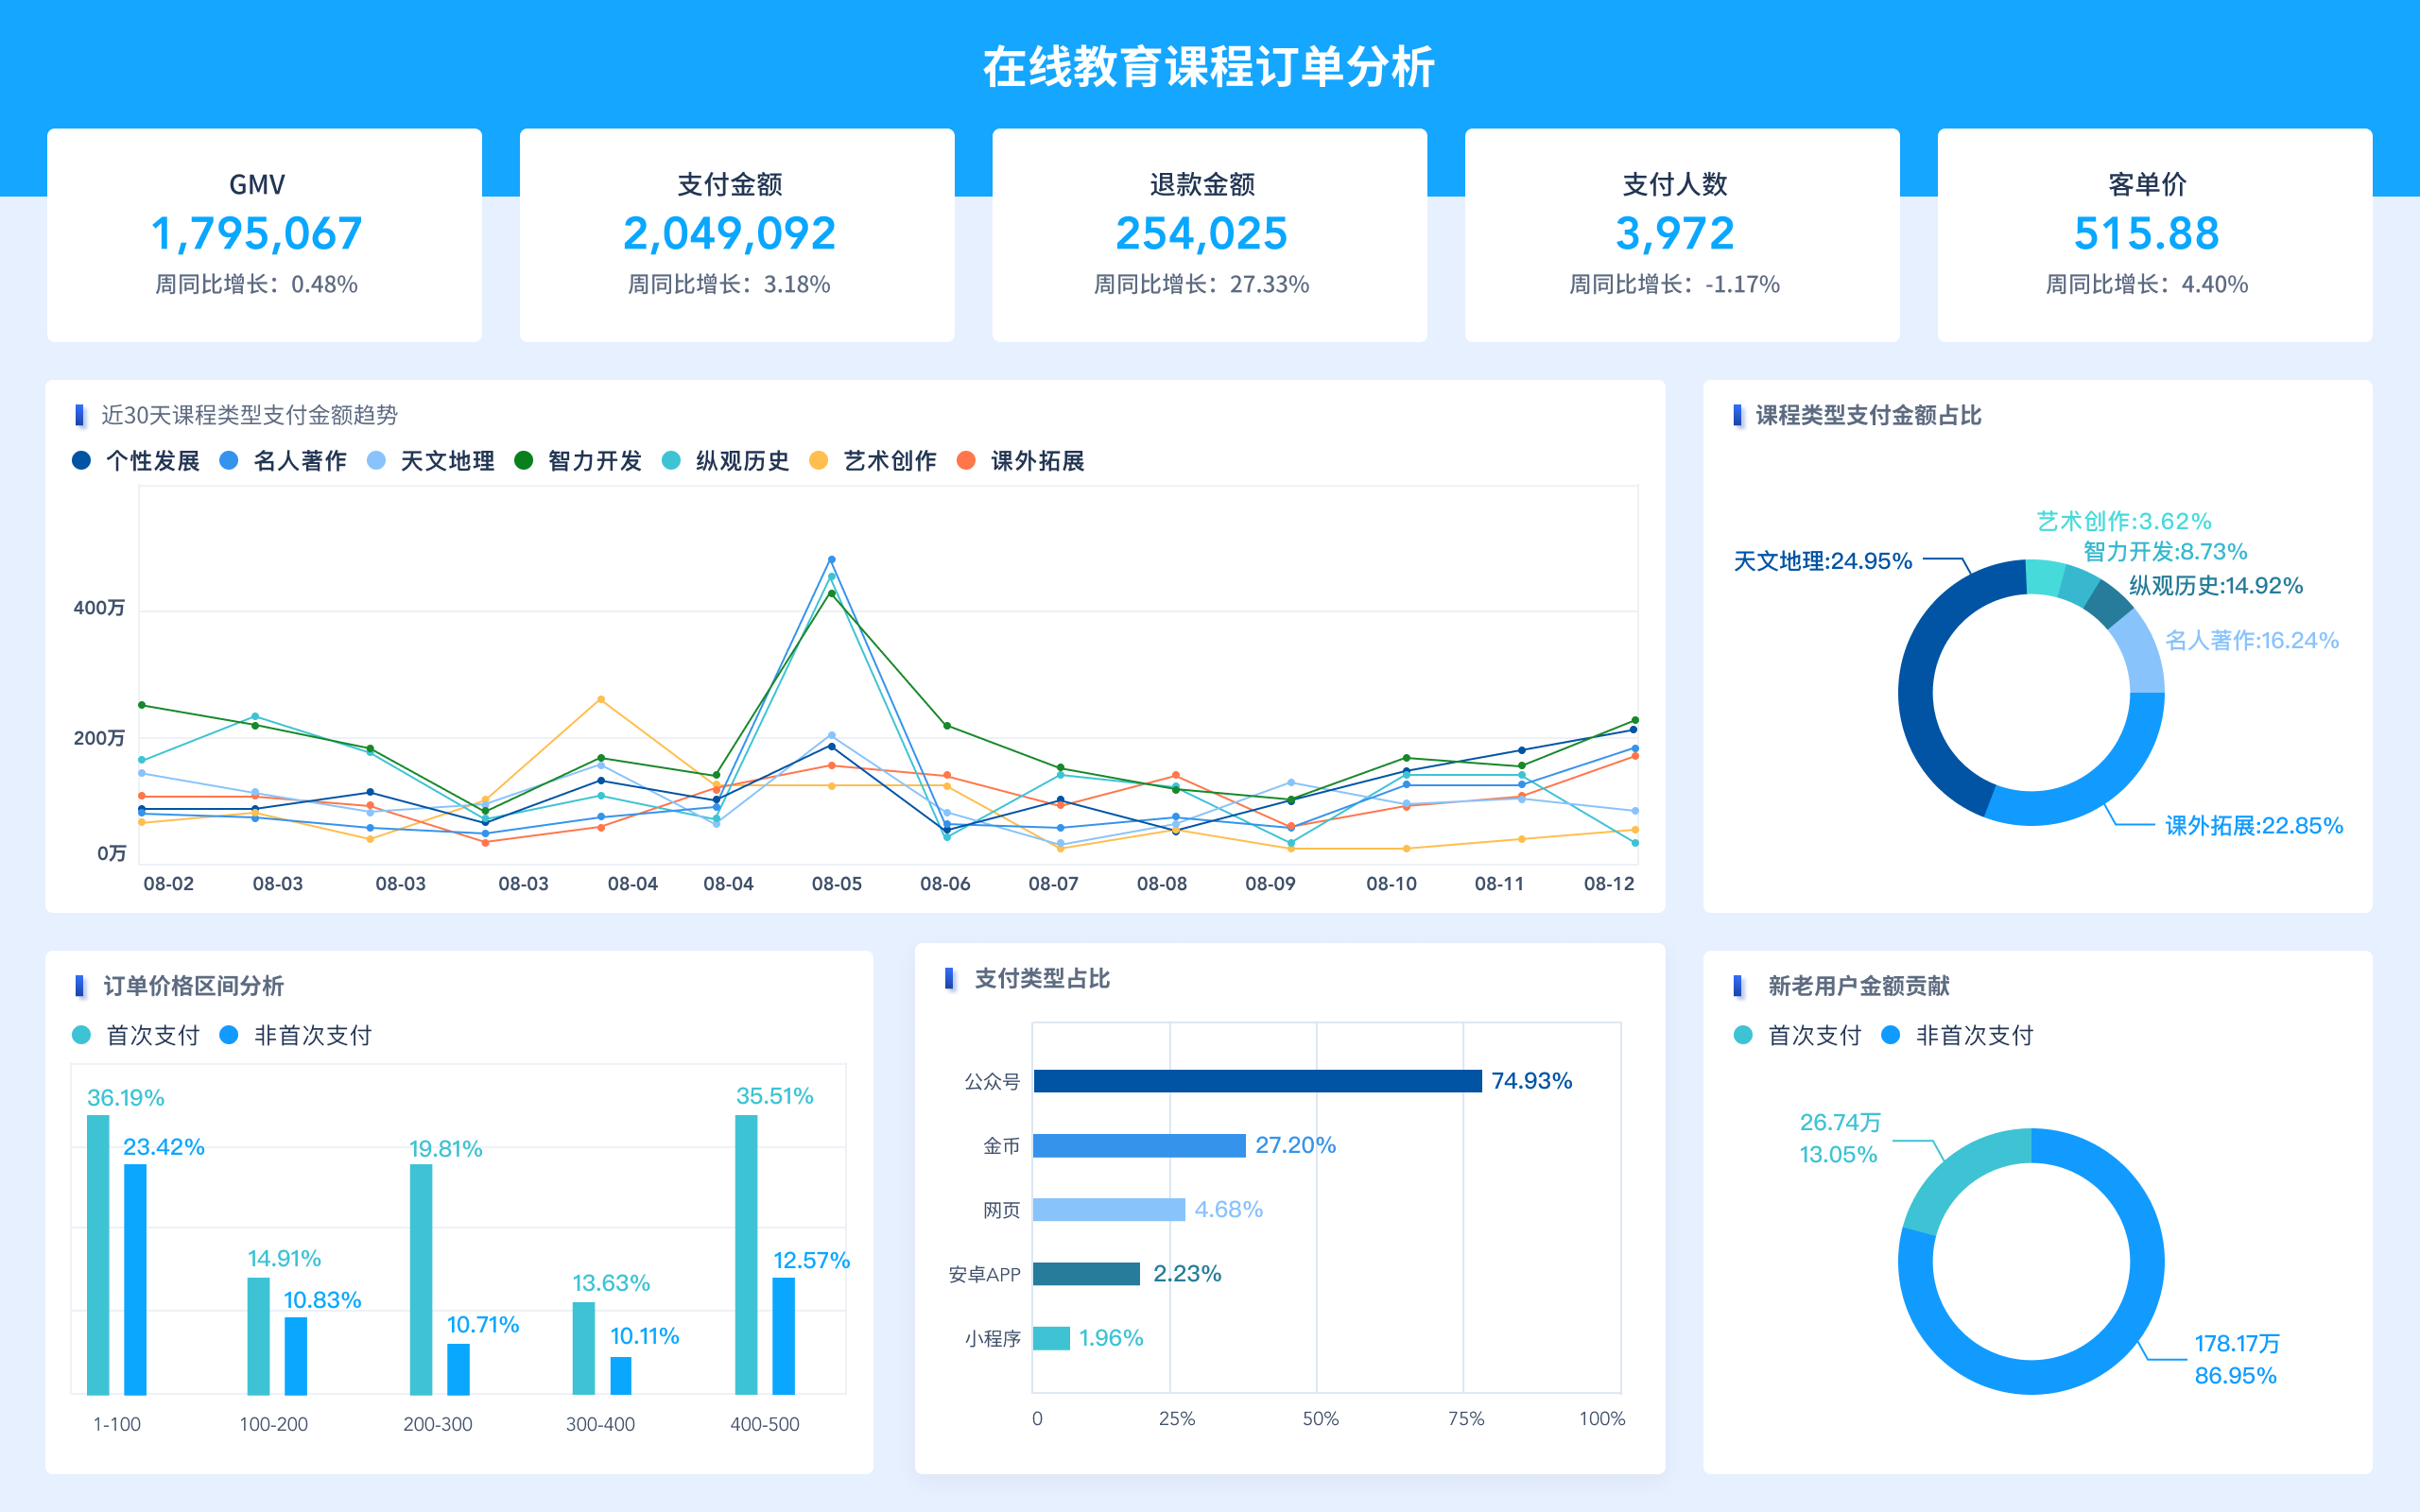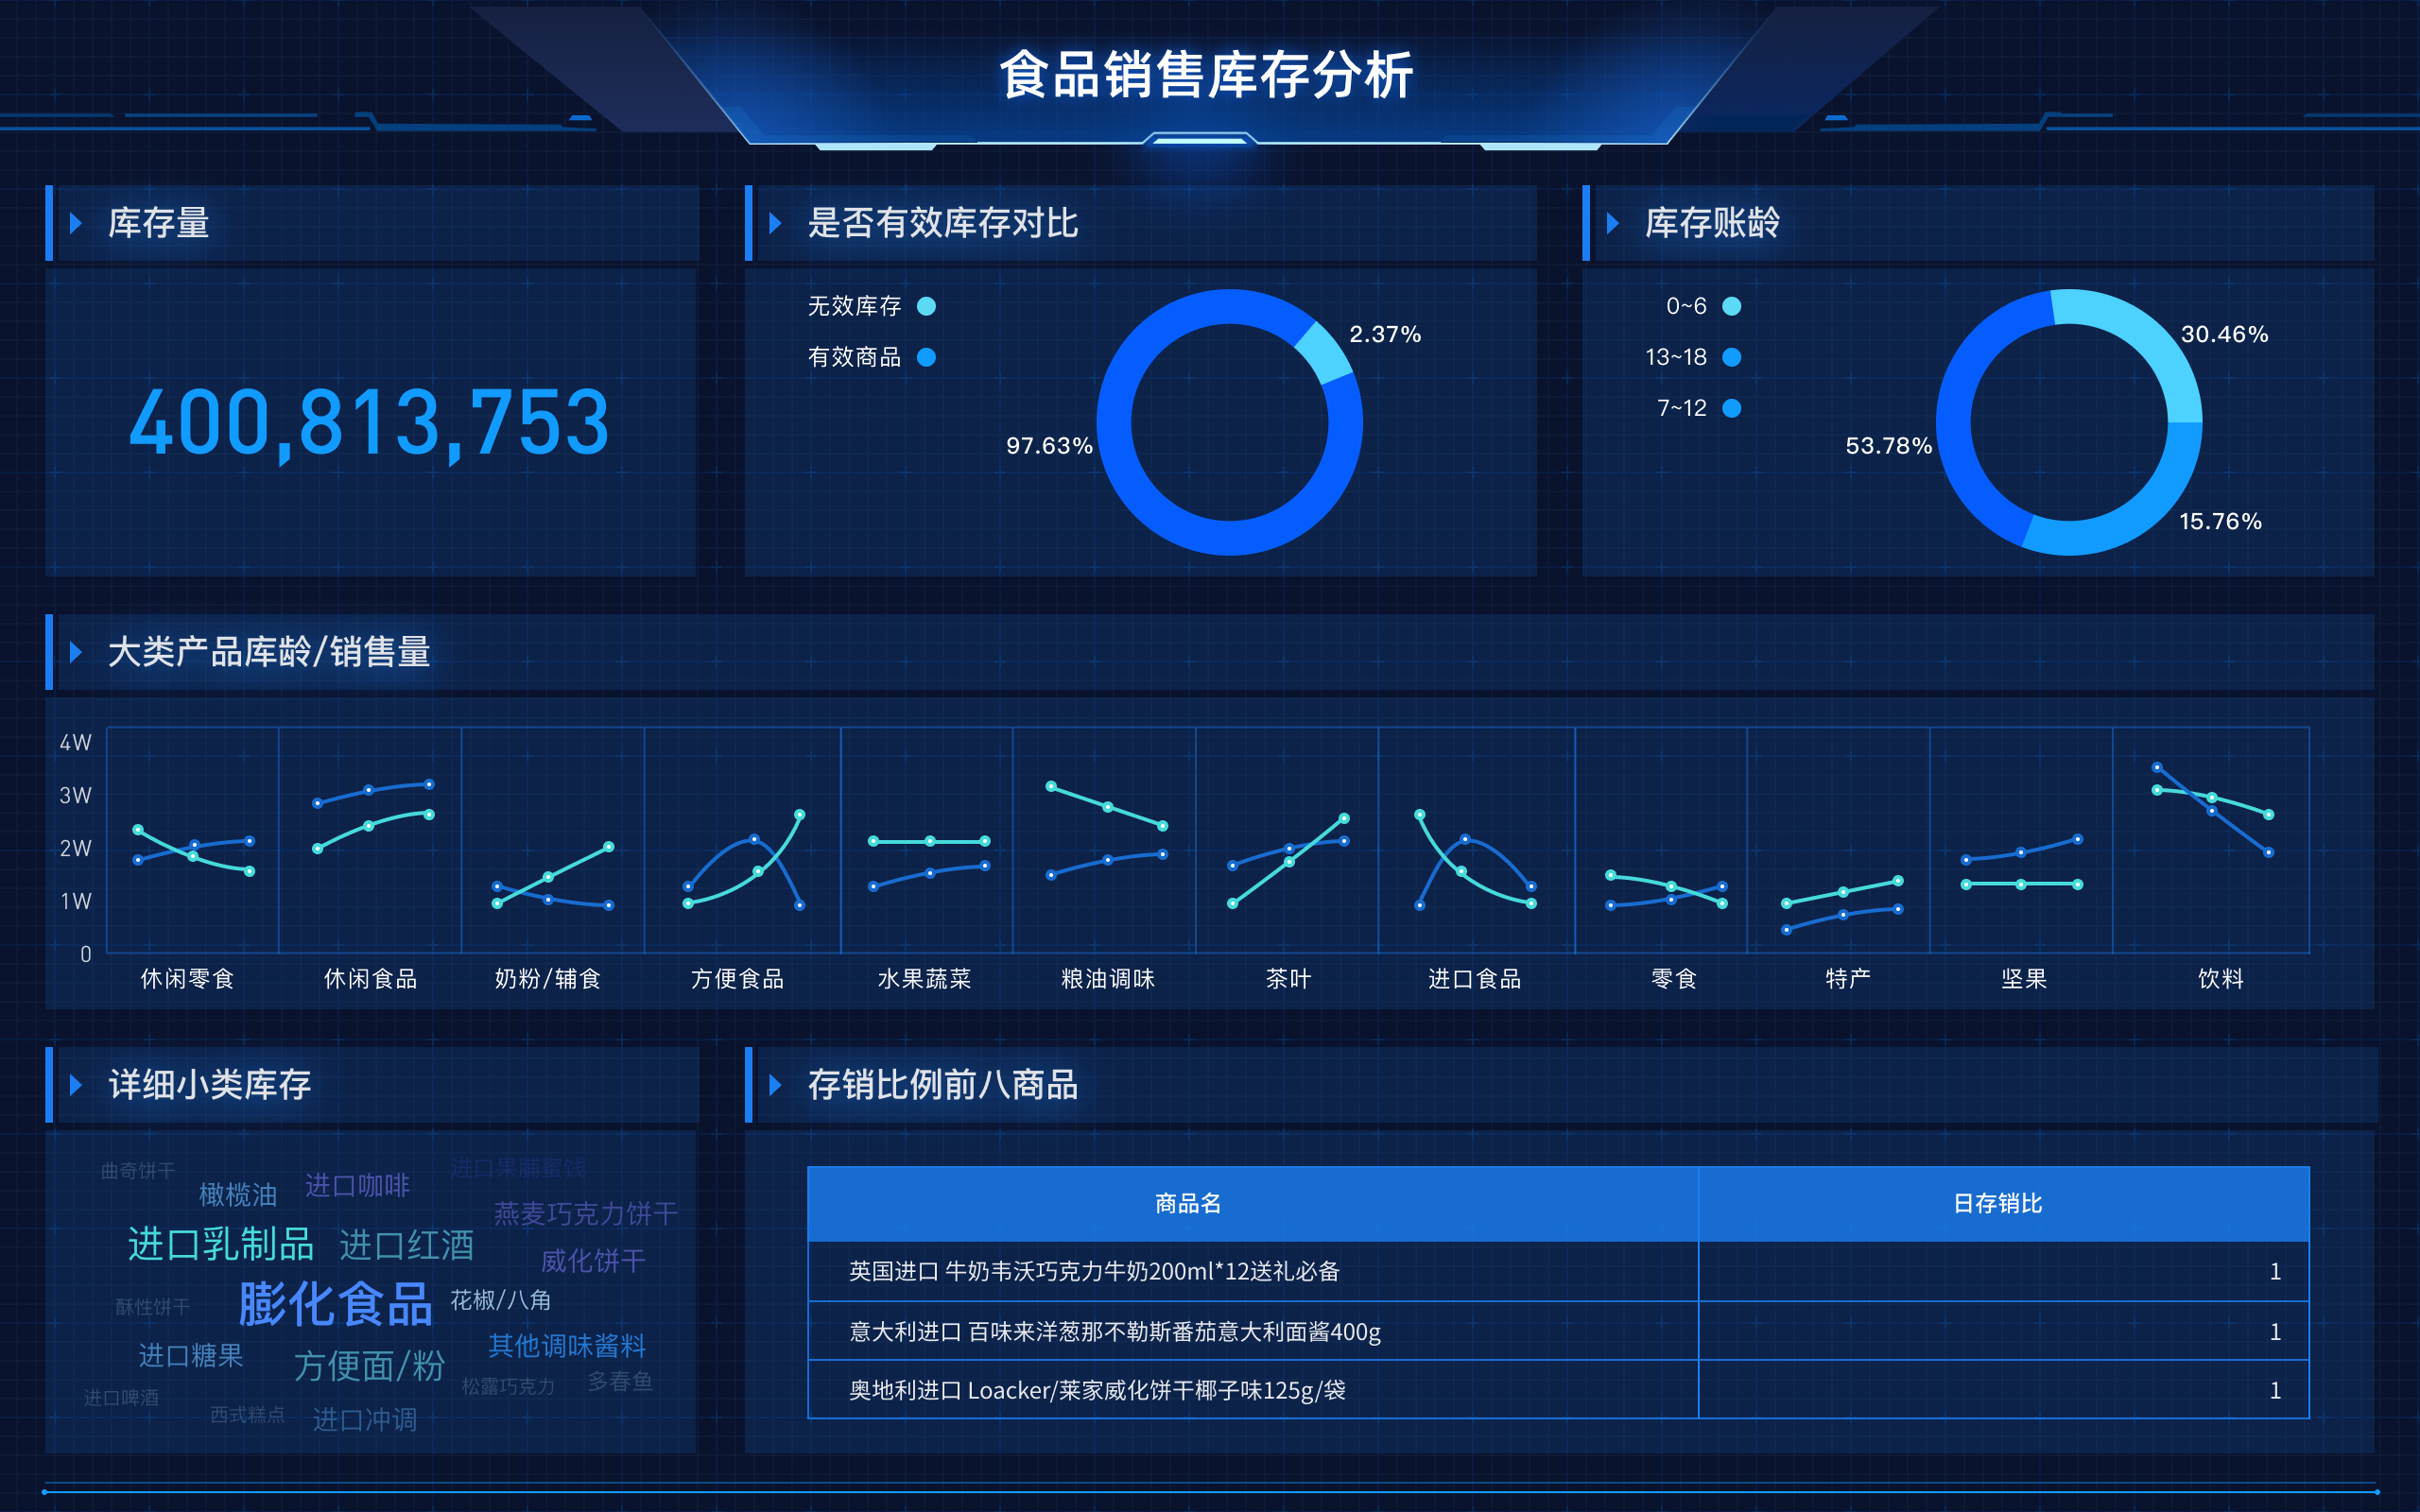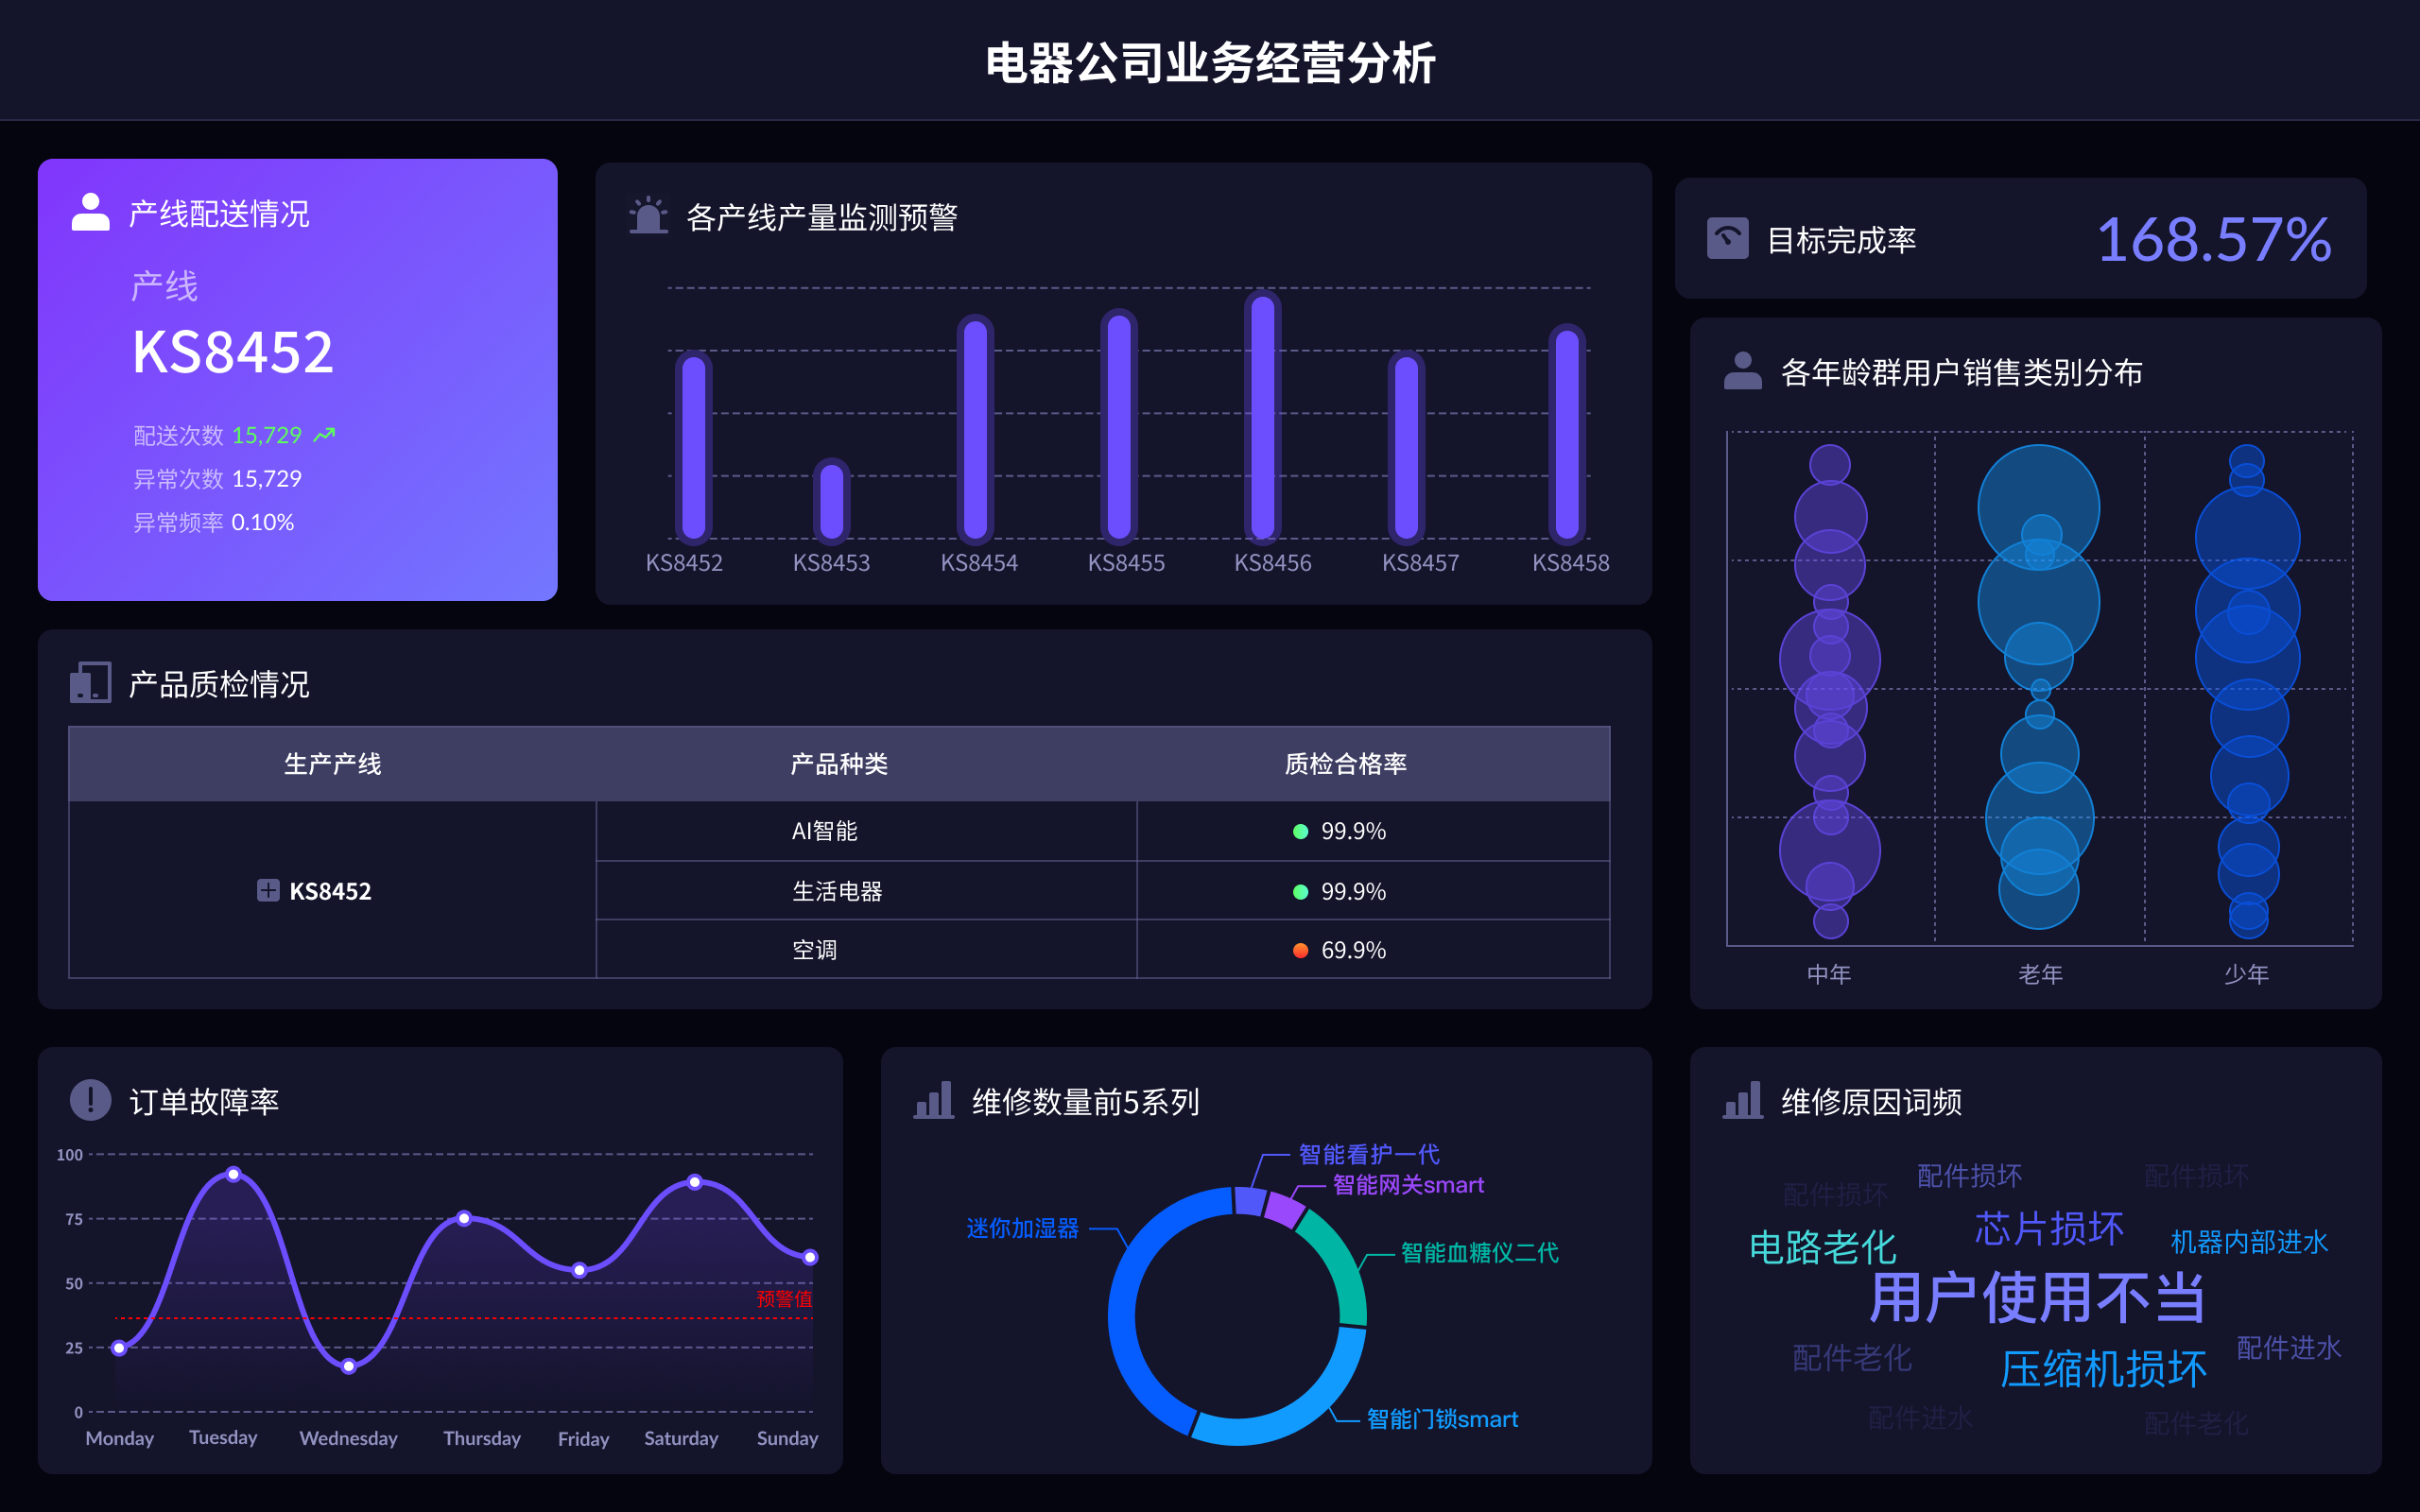
PySide2 中的数据可视化可以通过多种方式实现,包括使用 matplotlib、PyQtGraph、以及帆软的 FineBI、FineReport 和 FineVis。 其中,matplotlib 是最常用的库,它能够创建多种类型的图表,例如折线图、柱状图和散点图;PyQtGraph 是一个优化性能的库,适用于实时图表;而 FineBI、FineReport 和 FineVis 则提供了企业级的数据可视化解决方案。以下详细介绍如何在 PySide2 中集成这些工具进行数据可视化。
一、MATPLOTLIB 集成
安装和设置:要在 PySide2 中使用 matplotlib,首先需要安装 matplotlib 和 PySide2 库。可以使用以下命令进行安装:
pip install matplotlib PySide2
然后,在代码中引入这些库:
import sys
from PySide2.QtWidgets import QApplication, QMainWindow
from matplotlib.backends.backend_qt5agg import FigureCanvasQTAgg as FigureCanvas
from matplotlib.figure import Figure
创建基本图表:以下是一个简单的示例,展示如何在 PySide2 窗口中嵌入 matplotlib 图表:
class MplCanvas(FigureCanvas):
    def __init__(self, parent=None, width=5, height=4, dpi=100):
        fig = Figure(figsize=(width, height), dpi=dpi)
        self.axes = fig.add_subplot(111)
        super(MplCanvas, self).__init__(fig)
class MainWindow(QMainWindow):
    def __init__(self):
        super(MainWindow, self).__init__()
        self.canvas = MplCanvas(self, width=5, height=4, dpi=100)
        self.setCentralWidget(self.canvas)
        self.plot()
    def plot(self):
        self.canvas.axes.plot([0,1,2,3,4], [10,1,20,3,40])
        self.canvas.draw()
app = QApplication(sys.argv)
window = MainWindow()
window.show()
app.exec_()
这个代码创建了一个基本的 PySide2 窗口,并在其中嵌入了一个 matplotlib 图表。MplCanvas 类继承了 FigureCanvas,而 MainWindow 类则创建并显示该图表。
二、PYQTGRAPH 集成
安装和设置:PyQtGraph 是另一个强大的图表库,适合实时数据更新。使用以下命令安装:
pip install pyqtgraph PySide2
然后,在代码中引入这些库:
import sys
from PySide2.QtWidgets import QApplication, QMainWindow
import pyqtgraph as pg
创建实时图表:以下示例展示了如何使用 PyQtGraph 创建一个简单的实时更新图表:
class MainWindow(QMainWindow):
    def __init__(self):
        super(MainWindow, self).__init__()
        self.plotWidget = pg.PlotWidget()
        self.setCentralWidget(self.plotWidget)
        self.data = [0]
        self.plotData()
    def plotData(self):
        self.plotWidget.plot(self.data, pen=pg.mkPen('r', width=2))
        self.data.append(self.data[-1] + 1)
        QTimer.singleShot(1000, self.plotData)
app = QApplication(sys.argv)
window = MainWindow()
window.show()
app.exec_()
这个代码在 PySide2 窗口中嵌入了一个 PyQtGraph 图表,并每秒更新一次数据。
三、FINEBI、FINEREPORT 和 FINEVIS 集成
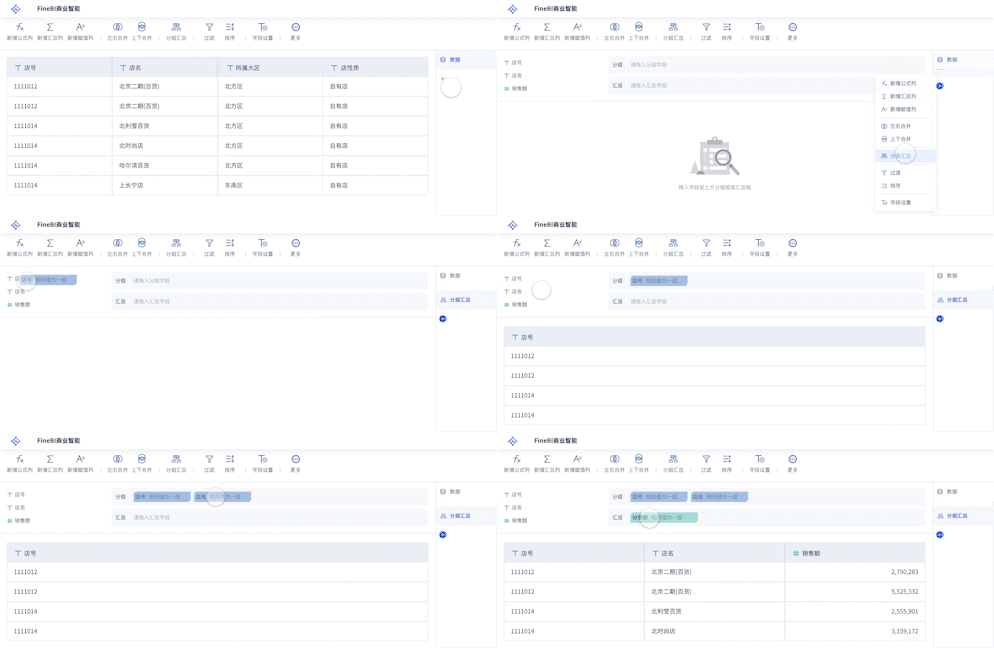
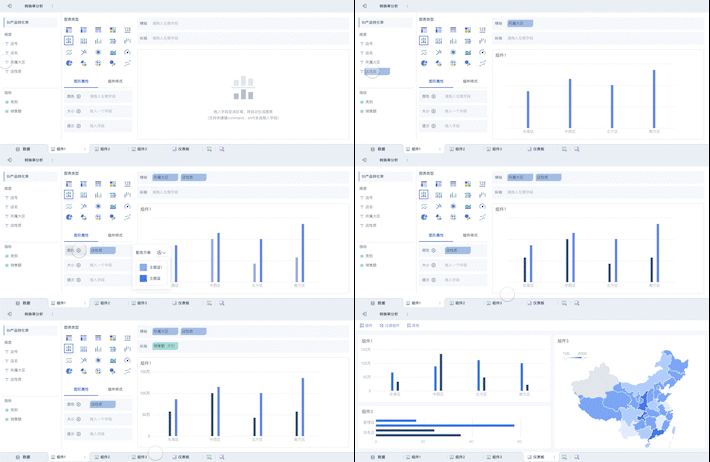
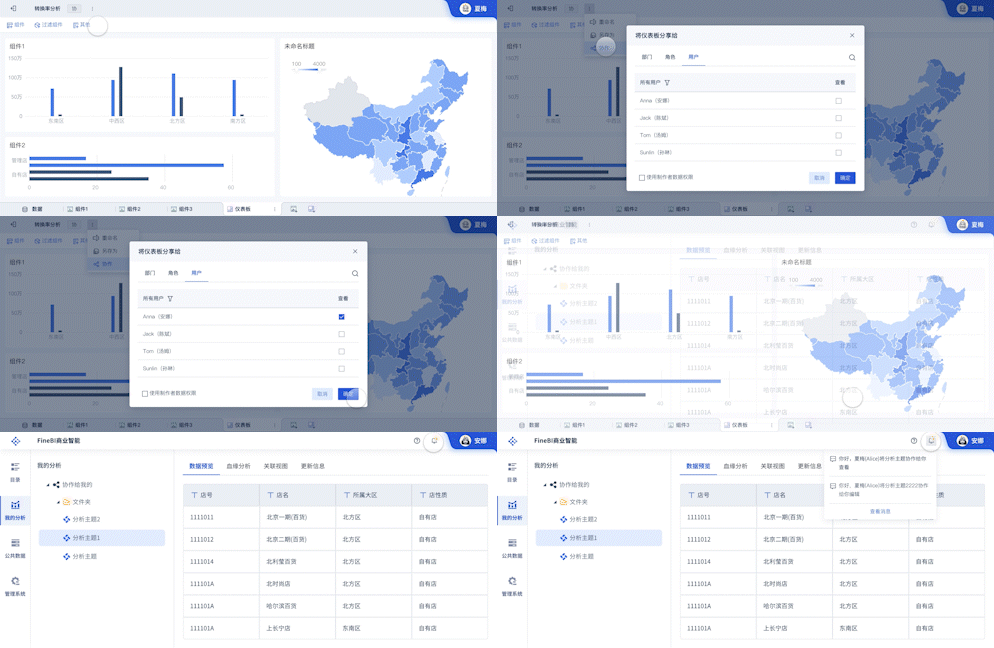
企业级数据可视化工具:FineBI、FineReport 和 FineVis 是帆软旗下的三款数据可视化工具,适用于企业级应用。以下是它们的官网链接:
- FineBI官网:FineBI
- FineReport官网:FineReport
- FineVis官网:FineVis
使用方法:这些工具提供了丰富的图表和报表设计功能,可以通过 API 集成到 PySide2 应用中。以下是一个集成 FineReport 的示例:
import requests
def get_report_data(report_id):
    url = f"https://s.fanruan.com/api/report/{report_id}"
    response = requests.get(url)
    return response.json()
class ReportWindow(QMainWindow):
    def __init__(self, report_id):
        super(ReportWindow, self).__init__()
        self.report_data = get_report_data(report_id)
        self.display_report()
    def display_report(self):
        # 处理并显示报告数据
        pass
app = QApplication(sys.argv)
window = ReportWindow("your_report_id")
window.show()
app.exec_()
这个代码通过 API 获取 FineReport 的数据,并在 PySide2 窗口中显示。
四、总结与优化
选择合适的工具:在选择数据可视化工具时,需根据具体需求做出决策。Matplotlib 适用于静态图表,PyQtGraph 适合实时数据更新,FineBI、FineReport 和 FineVis 提供了企业级的数据分析和报表功能。
优化性能:对于实时图表,优化性能至关重要。PyQtGraph 提供了高效的数据处理和绘图能力,可以满足大多数实时更新的需求。
扩展功能:除了基本的图表绘制,还可以通过自定义插件或扩展库来增强功能。例如,可以使用 Seaborn 创建更美观的统计图表,或者使用 Plotly 创建交互式图表。
通过以上方法,开发者可以在 PySide2 中实现丰富多样的数据可视化功能,满足不同场景的需求。
相关问答FAQs:
在 PySide2 中实现数据可视化是一个强大且灵活的过程,这能够帮助用户将数据以图形化的方式呈现,从而更容易进行分析和理解。以下是有关 PySide2 数据可视化的常见问题及其详细回答:
1. PySide2 中如何实现基本的数据可视化?
在 PySide2 中实现数据可视化通常涉及使用 Qt 的绘图功能或者集成第三方绘图库。PySide2 是 Qt 的 Python 绑定,它提供了一系列工具来绘制图形和显示数据。为了实现基本的数据可视化,你可以使用 QWidget 和 QPainter 类,这样你可以直接在窗口上绘制图形。
例如,以下是一个简单的例子,展示如何使用 QWidget 和 QPainter 绘制一个折线图:
import sys
from PySide2.QtWidgets import QApplication, QWidget
from PySide2.QtGui import QPainter, QColor, QPen
from PySide2.QtCore import Qt

class PlotWidget(QWidget):
    def __init__(self, parent=None):
        super(PlotWidget, self).__init__(parent)
        self.setWindowTitle('Simple Line Plot')
        self.setGeometry(100, 100, 400, 300)

    def paintEvent(self, event):
        painter = QPainter(self)
        painter.setPen(QPen(QColor('blue'), 2))

        data_points = [(10, 20), (30, 50), (50, 80), (70, 30)]

        if data_points:
            for i in range(len(data_points) - 1):
                x1, y1 = data_points[i]
                x2, y2 = data_points[i + 1]
                painter.drawLine(x1, y1, x2, y2)

if __name__ == '__main__':
    app = QApplication(sys.argv)
    widget = PlotWidget()
    widget.show()
    sys.exit(app.exec_())
在上述代码中,我们创建了一个继承自 QWidget 的自定义窗口类,并重写了 paintEvent 方法以绘制折线图。QPainter 用于在窗口上绘制图形,数据点用线条连接。
2. 如何在 PySide2 中使用 Matplotlib 进行数据可视化?
Matplotlib 是一个流行的 Python 绘图库,它可以轻松地与 PySide2 集成来实现数据可视化。要在 PySide2 中使用 Matplotlib,你需要使用 FigureCanvasQTAgg 类,它是 Matplotlib 与 Qt 的桥梁。
以下是一个示例,展示了如何将 Matplotlib 图表嵌入到 PySide2 窗口中:
import sys
from PySide2.QtWidgets import QApplication, QMainWindow, QVBoxLayout, QWidget
from matplotlib.figure import Figure
from matplotlib.backends.backend_qt5agg import FigureCanvasQTAgg

class MatplotlibWidget(QWidget):
    def __init__(self, parent=None):
        super(MatplotlibWidget, self).__init__(parent)

        layout = QVBoxLayout()
        self.setLayout(layout)

        # Create a matplotlib figure
        self.figure = Figure()
        self.canvas = FigureCanvasQTAgg(self.figure)
        layout.addWidget(self.canvas)

        self.plot()

    def plot(self):
        ax = self.figure.add_subplot(111)
        ax.plot([1, 2, 3, 4], [10, 20, 25, 30], 'r-')
        ax.set_title('Matplotlib Plot in PySide2')
        ax.set_xlabel('X-axis')
        ax.set_ylabel('Y-axis')

        self.canvas.draw()

class MainWindow(QMainWindow):
    def __init__(self):
        super(MainWindow, self).__init__()
        self.setWindowTitle('Matplotlib with PySide2')
        self.setGeometry(100, 100, 600, 400)

        self.central_widget = MatplotlibWidget()
        self.setCentralWidget(self.central_widget)

if __name__ == '__main__':
    app = QApplication(sys.argv)
    mainWin = MainWindow()
    mainWin.show()
    sys.exit(app.exec_())
在这段代码中,我们创建了一个 MatplotlibWidget 类,其中包含了一个 Matplotlib 图形对象 (Figure) 和一个用于显示图形的画布 (FigureCanvasQTAgg)。通过将 Matplotlib 图表嵌入到 QWidget 中,我们可以将图表显示在 PySide2 应用程序中。
3. PySide2 中如何处理实时数据可视化?
实时数据可视化是指在数据不断更新的情况下,动态地更新图形展示。实现这一功能通常涉及到周期性地更新图形并重新绘制。
以下是一个使用 PySide2 和 Matplotlib 的例子,演示了如何实现实时数据更新:
import sys
from PySide2.QtWidgets import QApplication, QMainWindow, QVBoxLayout, QWidget
from matplotlib.figure import Figure
from matplotlib.backends.backend_qt5agg import FigureCanvasQTAgg
from matplotlib.animation import FuncAnimation
import numpy as np

class RealTimePlotWidget(QWidget):
    def __init__(self, parent=None):
        super(RealTimePlotWidget, self).__init__(parent)

        layout = QVBoxLayout()
        self.setLayout(layout)

        self.figure = Figure()
        self.canvas = FigureCanvasQTAgg(self.figure)
        layout.addWidget(self.canvas)

        self.ax = self.figure.add_subplot(111)
        self.xdata, self.ydata = [], []
        self.line, = self.ax.plot([], [], 'r-')
        self.ax.set_xlim(0, 10)
        self.ax.set_ylim(0, 1)

        self.ani = FuncAnimation(self.figure, self.update_plot, self.data_gen, blit=True, interval=100)

    def data_gen(self):
        t = 0
        while True:
            yield t, np.sin(t)
            t += 0.1

    def update_plot(self, data):
        t, y = data
        self.xdata.append(t)
        self.ydata.append(y)
        self.line.set_data(self.xdata, self.ydata)

        self.ax.relim()
        self.ax.autoscale_view()
        return self.line,

class MainWindow(QMainWindow):
    def __init__(self):
        super(MainWindow, self).__init__()
        self.setWindowTitle('Real-time Data Visualization')
        self.setGeometry(100, 100, 800, 600)

        self.central_widget = RealTimePlotWidget()
        self.setCentralWidget(self.central_widget)

if __name__ == '__main__':
    app = QApplication(sys.argv)
    mainWin = MainWindow()
    mainWin.show()
    sys.exit(app.exec_())
在这个示例中,FuncAnimation 被用来定期更新 Matplotlib 图表。data_gen 方法生成模拟数据,而 update_plot 方法更新图形数据。interval 参数定义了更新的时间间隔,确保图形实时更新。
这些示例展示了 PySide2 在不同数据可视化需求中的应用,从基本绘图到集成第三方绘图库以及实时更新数据。通过这些技术,你可以创建丰富多彩、交互性强的数据可视化应用程序。
本文内容通过AI工具匹配关键字智能整合而成,仅供参考,帆软不对内容的真实、准确或完整作任何形式的承诺。具体产品功能请以帆软官方帮助文档为准,或联系您的对接销售进行咨询。如有其他问题,您可以通过联系blog@fanruan.com进行反馈,帆软收到您的反馈后将及时答复和处理。


