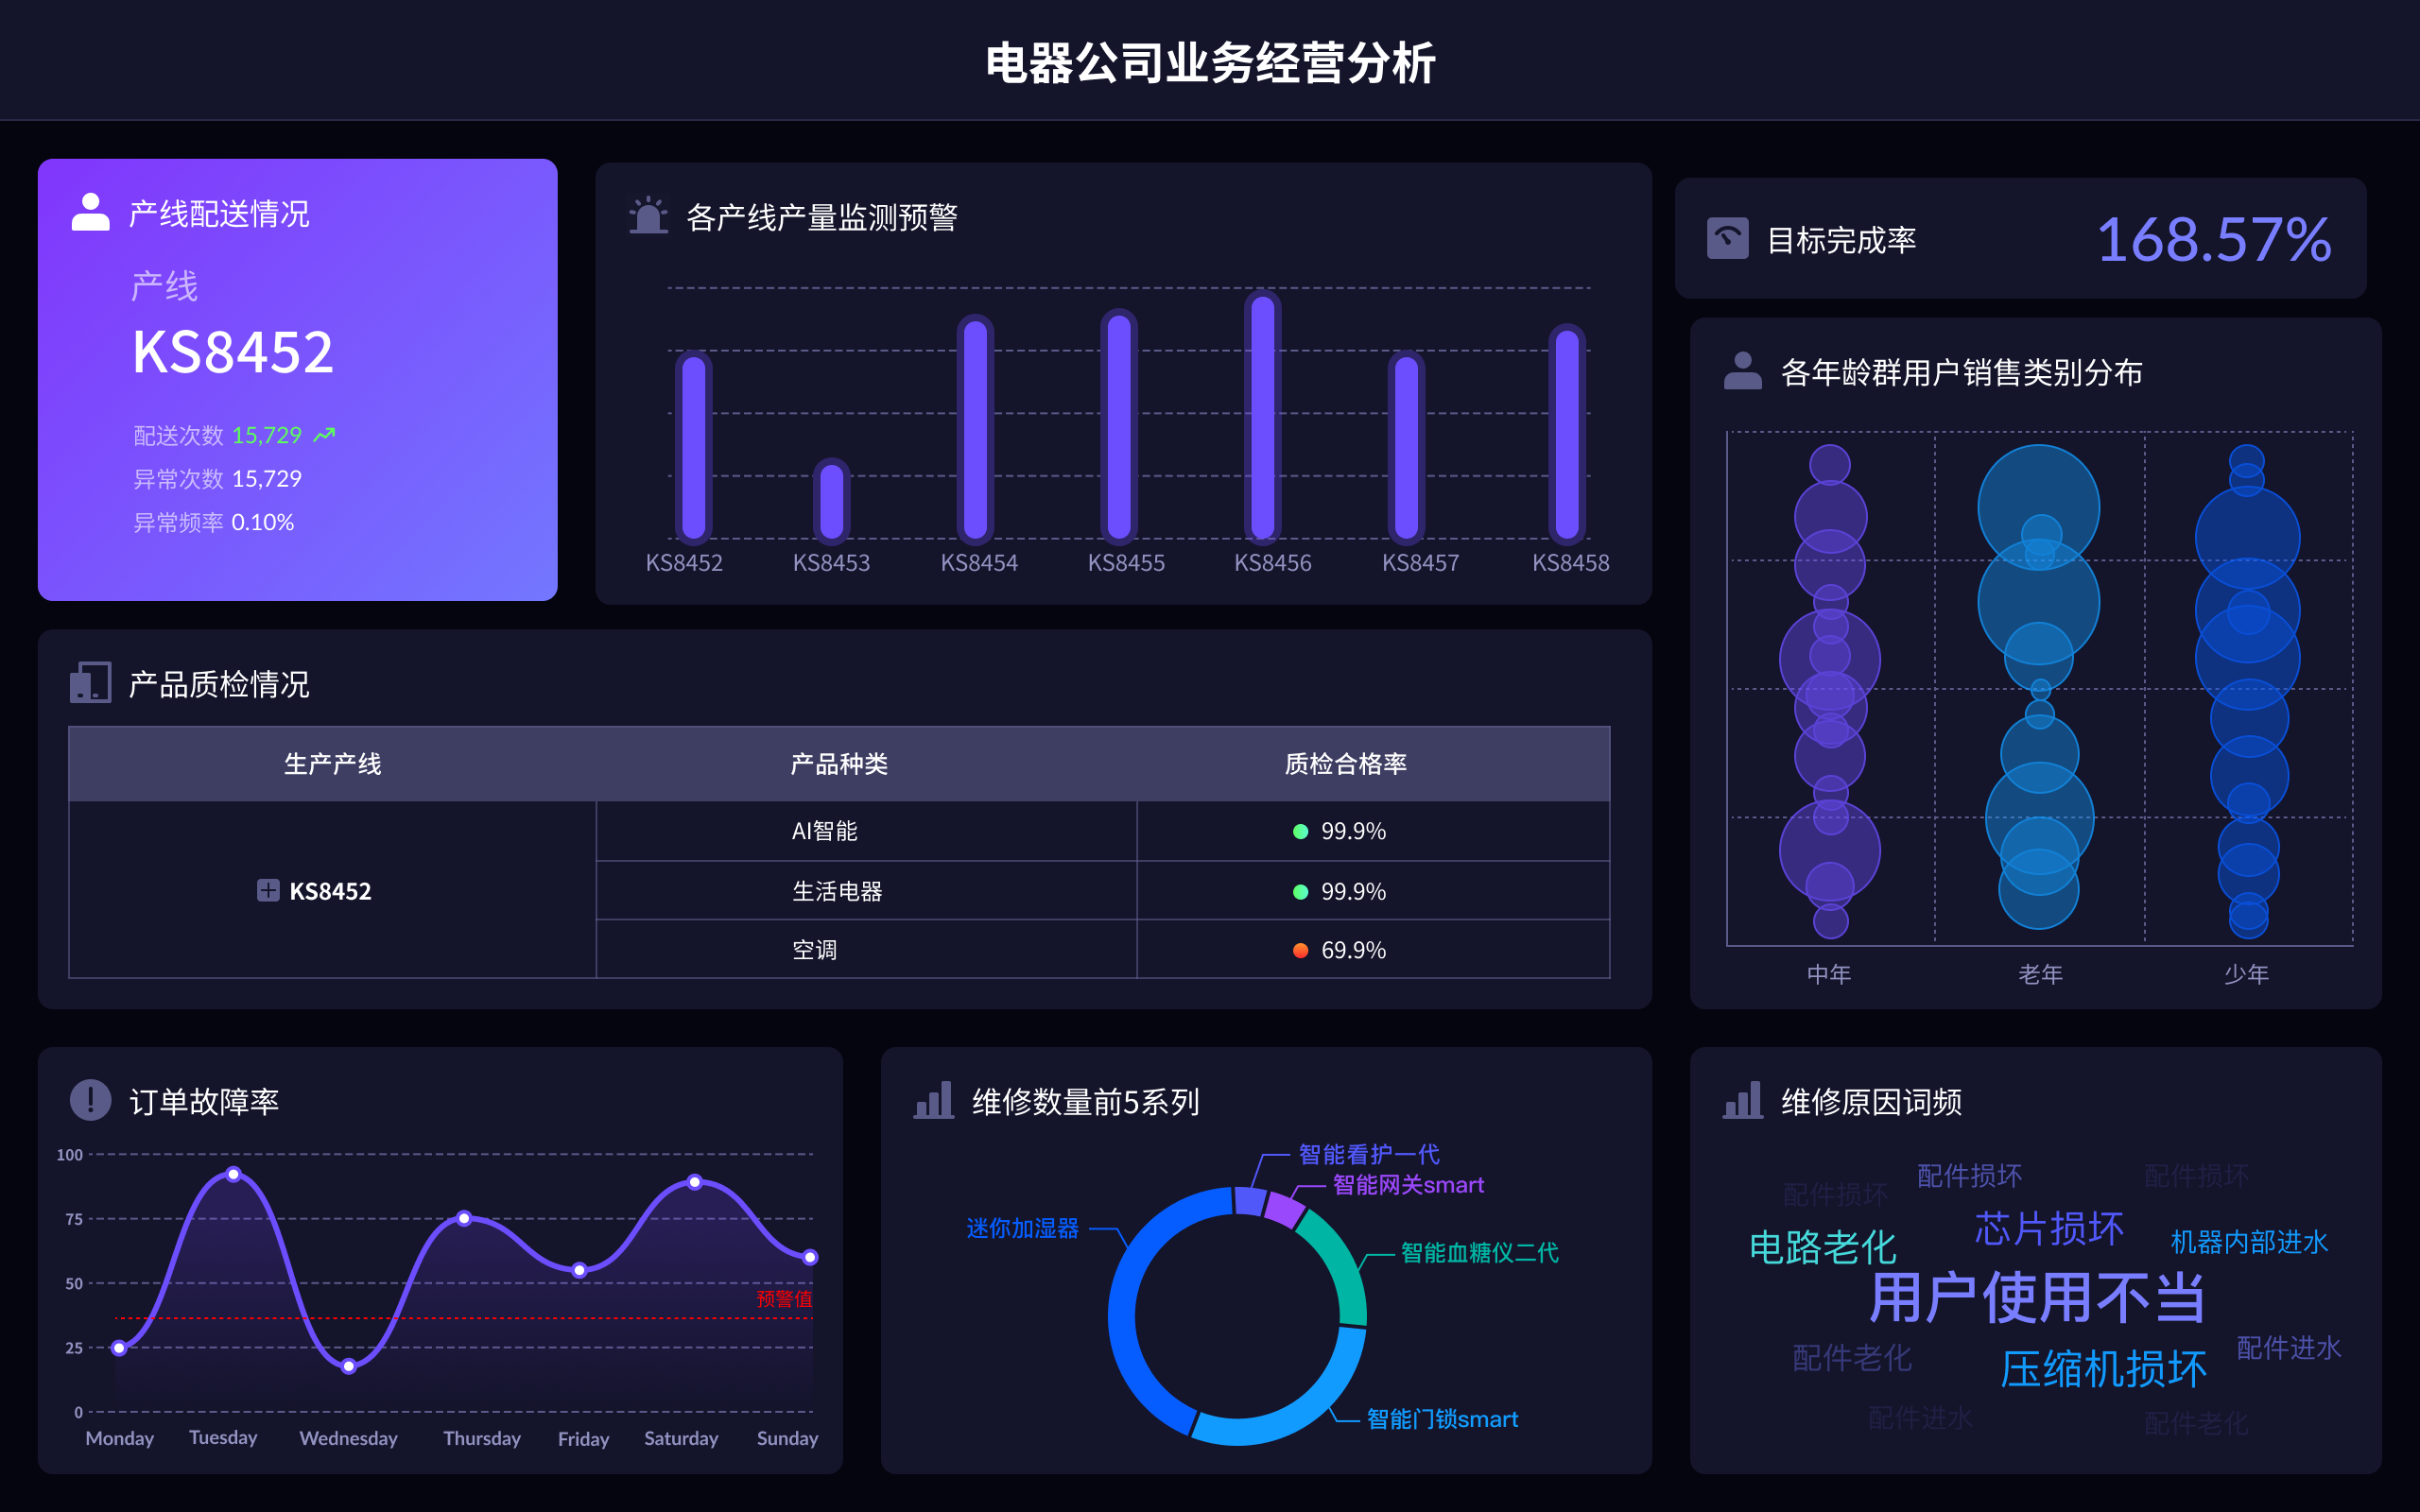
MATLAB数据可视化非常强大且广泛应用于多个领域,其核心优势包括:丰富的内置函数、强大的自定义功能、与其他工具的良好集成、用户友好的界面。其中,丰富的内置函数使得用户能够方便地创建各种类型的图表和图形,包括2D和3D图、热图、散点图等。例如,通过简单的命令就能生成专业的图表,极大地方便了数据分析和结果展示。此外,MATLAB提供了丰富的图形属性设置,使得用户可以对图形进行精细化调整,从而满足不同的展示需求。
一、丰富的内置函数
MATLAB的内置函数涵盖了几乎所有常见的数据可视化需求。用户可以通过简单的命令创建各种图表,例如:
x = 0:0.1:10;
y = sin(x);
plot(x, y);
上述代码生成了一张简单的正弦波图。除此之外,MATLAB还支持更复杂的图形,比如3D图、热图、散点图等。内置函数不仅种类丰富,而且使用简便,极大地方便了数据科学家和工程师的工作。
二、强大的自定义功能
MATLAB允许用户对图形进行高度自定义,从颜色、线型到标记、轴刻度等,都可以根据需要进行调整。例如,可以通过以下代码自定义图表的外观:
plot(x, y, 'r--o', 'LineWidth', 2, 'MarkerSize', 10);
title('正弦波');
xlabel('时间');
ylabel('振幅');
grid on;
这样,用户不仅可以快速生成图表,还可以使其符合特定的格式和风格要求。这种高度的灵活性使得MATLAB在科学研究、工程应用和教育等领域得到了广泛应用。
三、与其他工具的良好集成
MATLAB不仅自身功能强大,还可以与其他工具无缝集成。例如,可以将MATLAB的图表嵌入到Microsoft Word、Excel等办公软件中,或导出为PDF、JPEG等格式供其他软件使用。此外,MATLAB还支持与数据库、其他编程语言(如Python、R)的数据交换,使得数据处理和可视化过程更加高效和便捷。
四、用户友好的界面
MATLAB提供了直观的用户界面,方便用户进行数据可视化操作。通过“Figure”窗口,用户可以交互式地编辑图形,调整图形属性,添加注释等。MATLAB还提供了丰富的帮助文档和示例代码,帮助用户快速上手并解决实际问题。
五、应用案例
MATLAB的数据可视化功能在多个领域有着广泛的应用。例如:
- 工程领域:在控制系统设计中,工程师可以使用MATLAB绘制系统的时域响应和频域响应图,方便对系统性能进行分析和调整。
- 金融领域:金融分析师可以使用MATLAB绘制股票价格走势、收益率分布等图表,帮助进行投资决策。
- 医学领域:研究人员可以使用MATLAB处理和可视化医学图像数据,如MRI、CT扫描结果,为医学诊断提供支持。
六、与Fine系列产品的比较
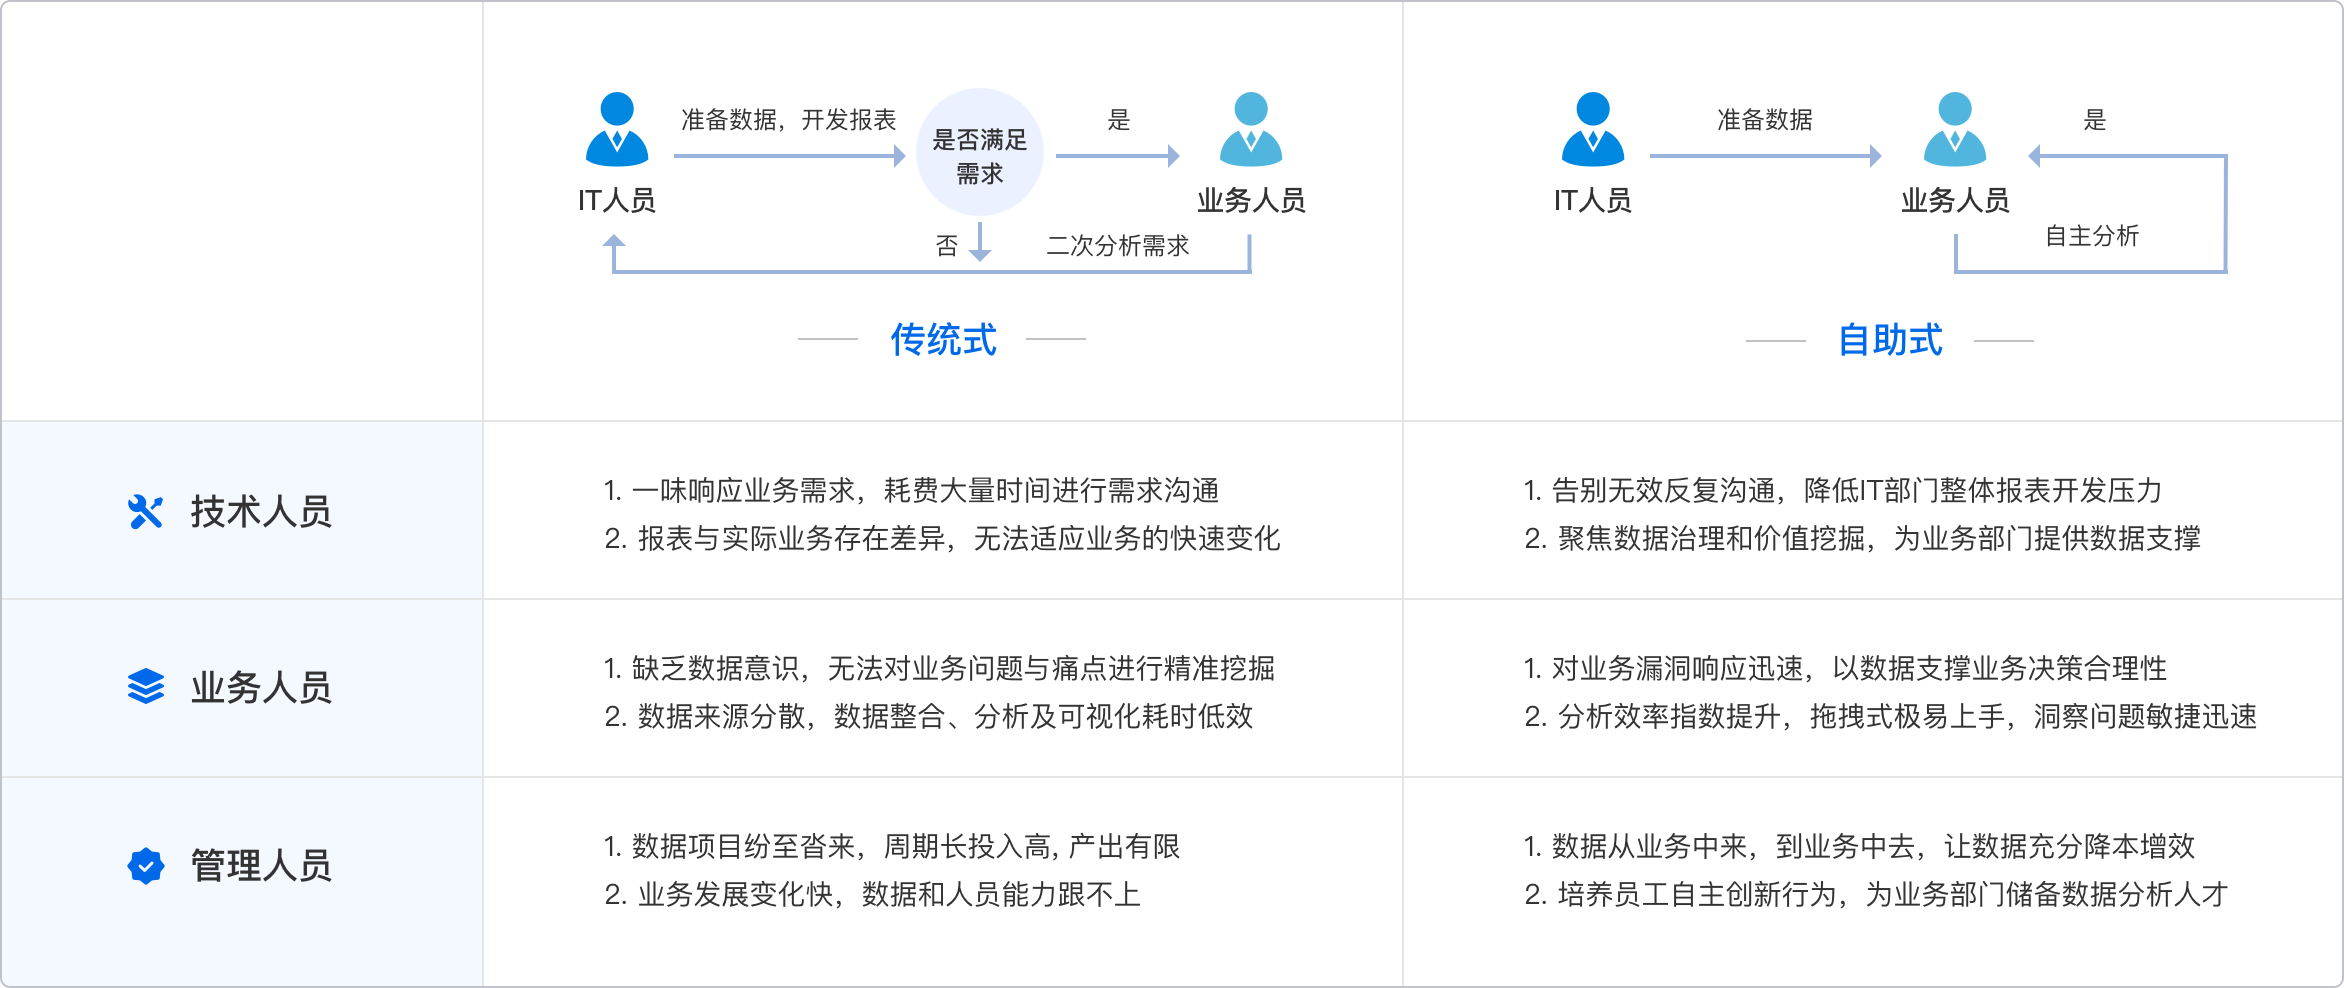
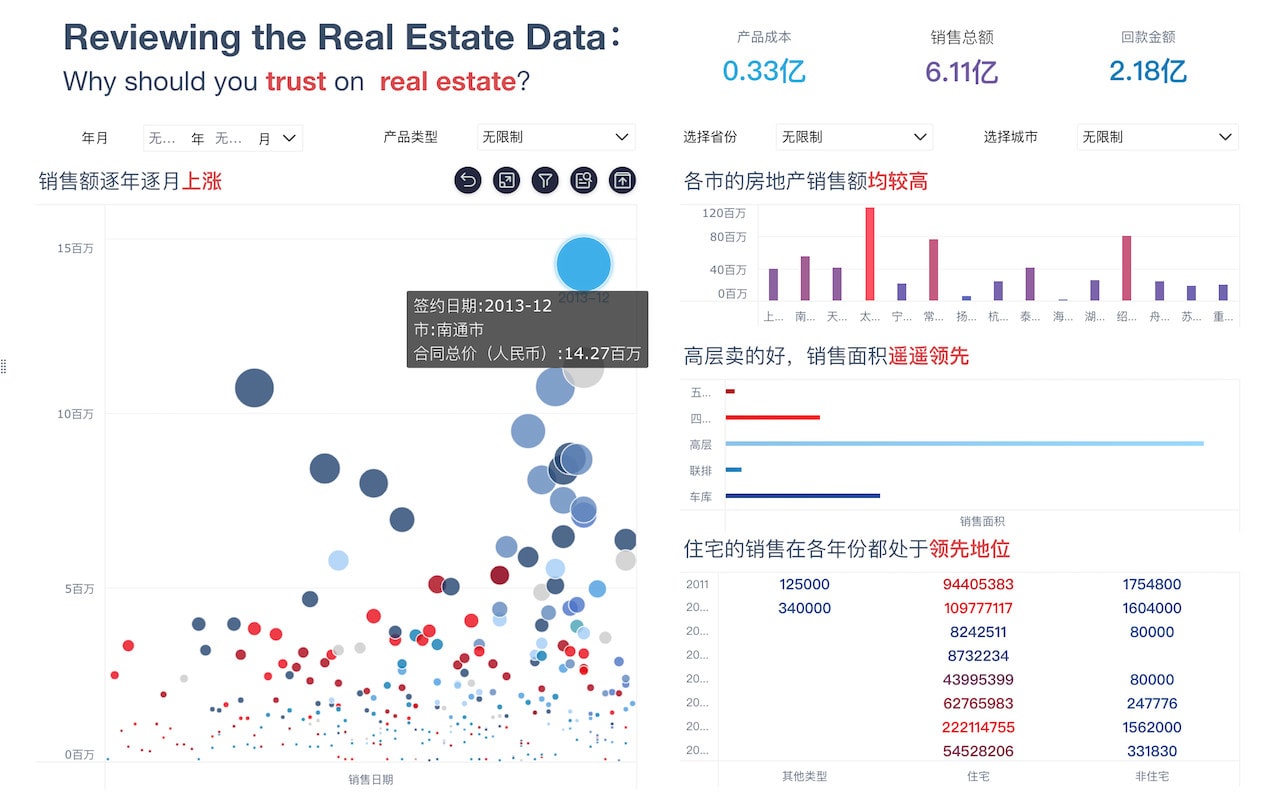
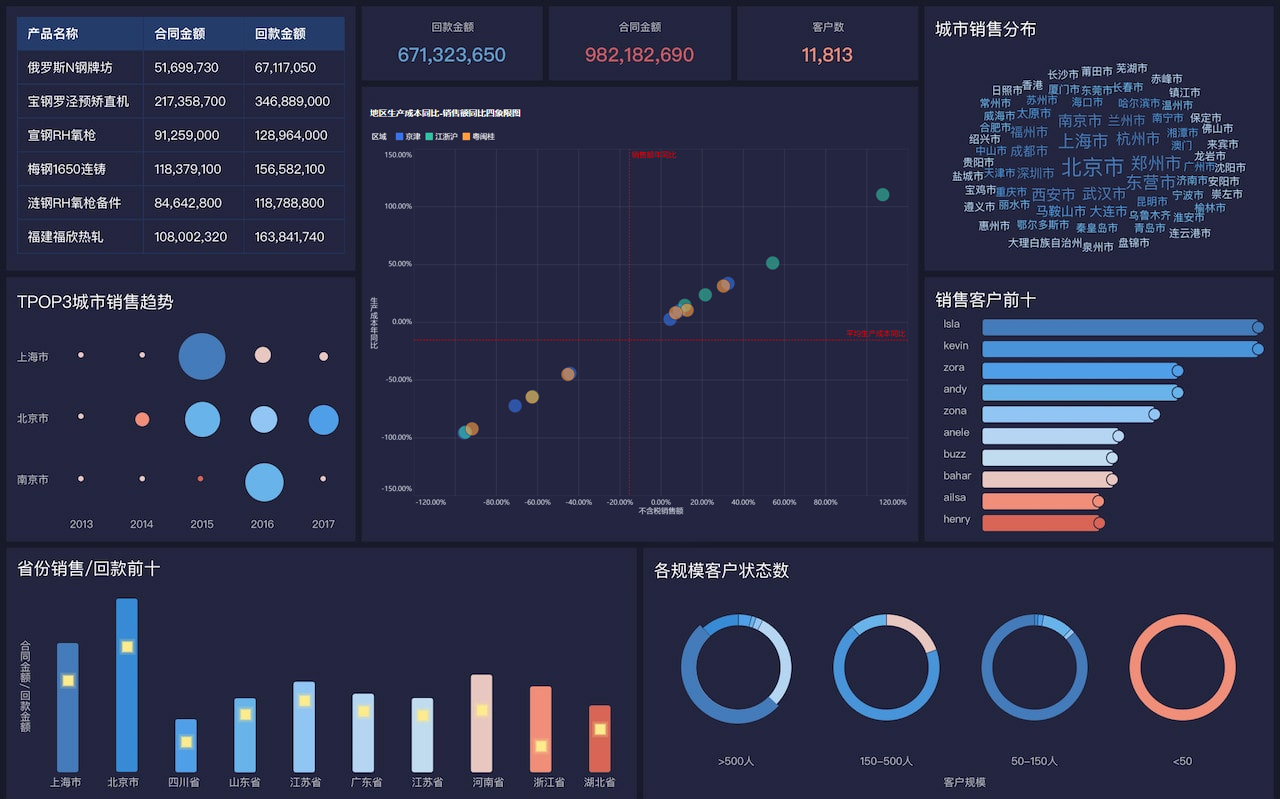
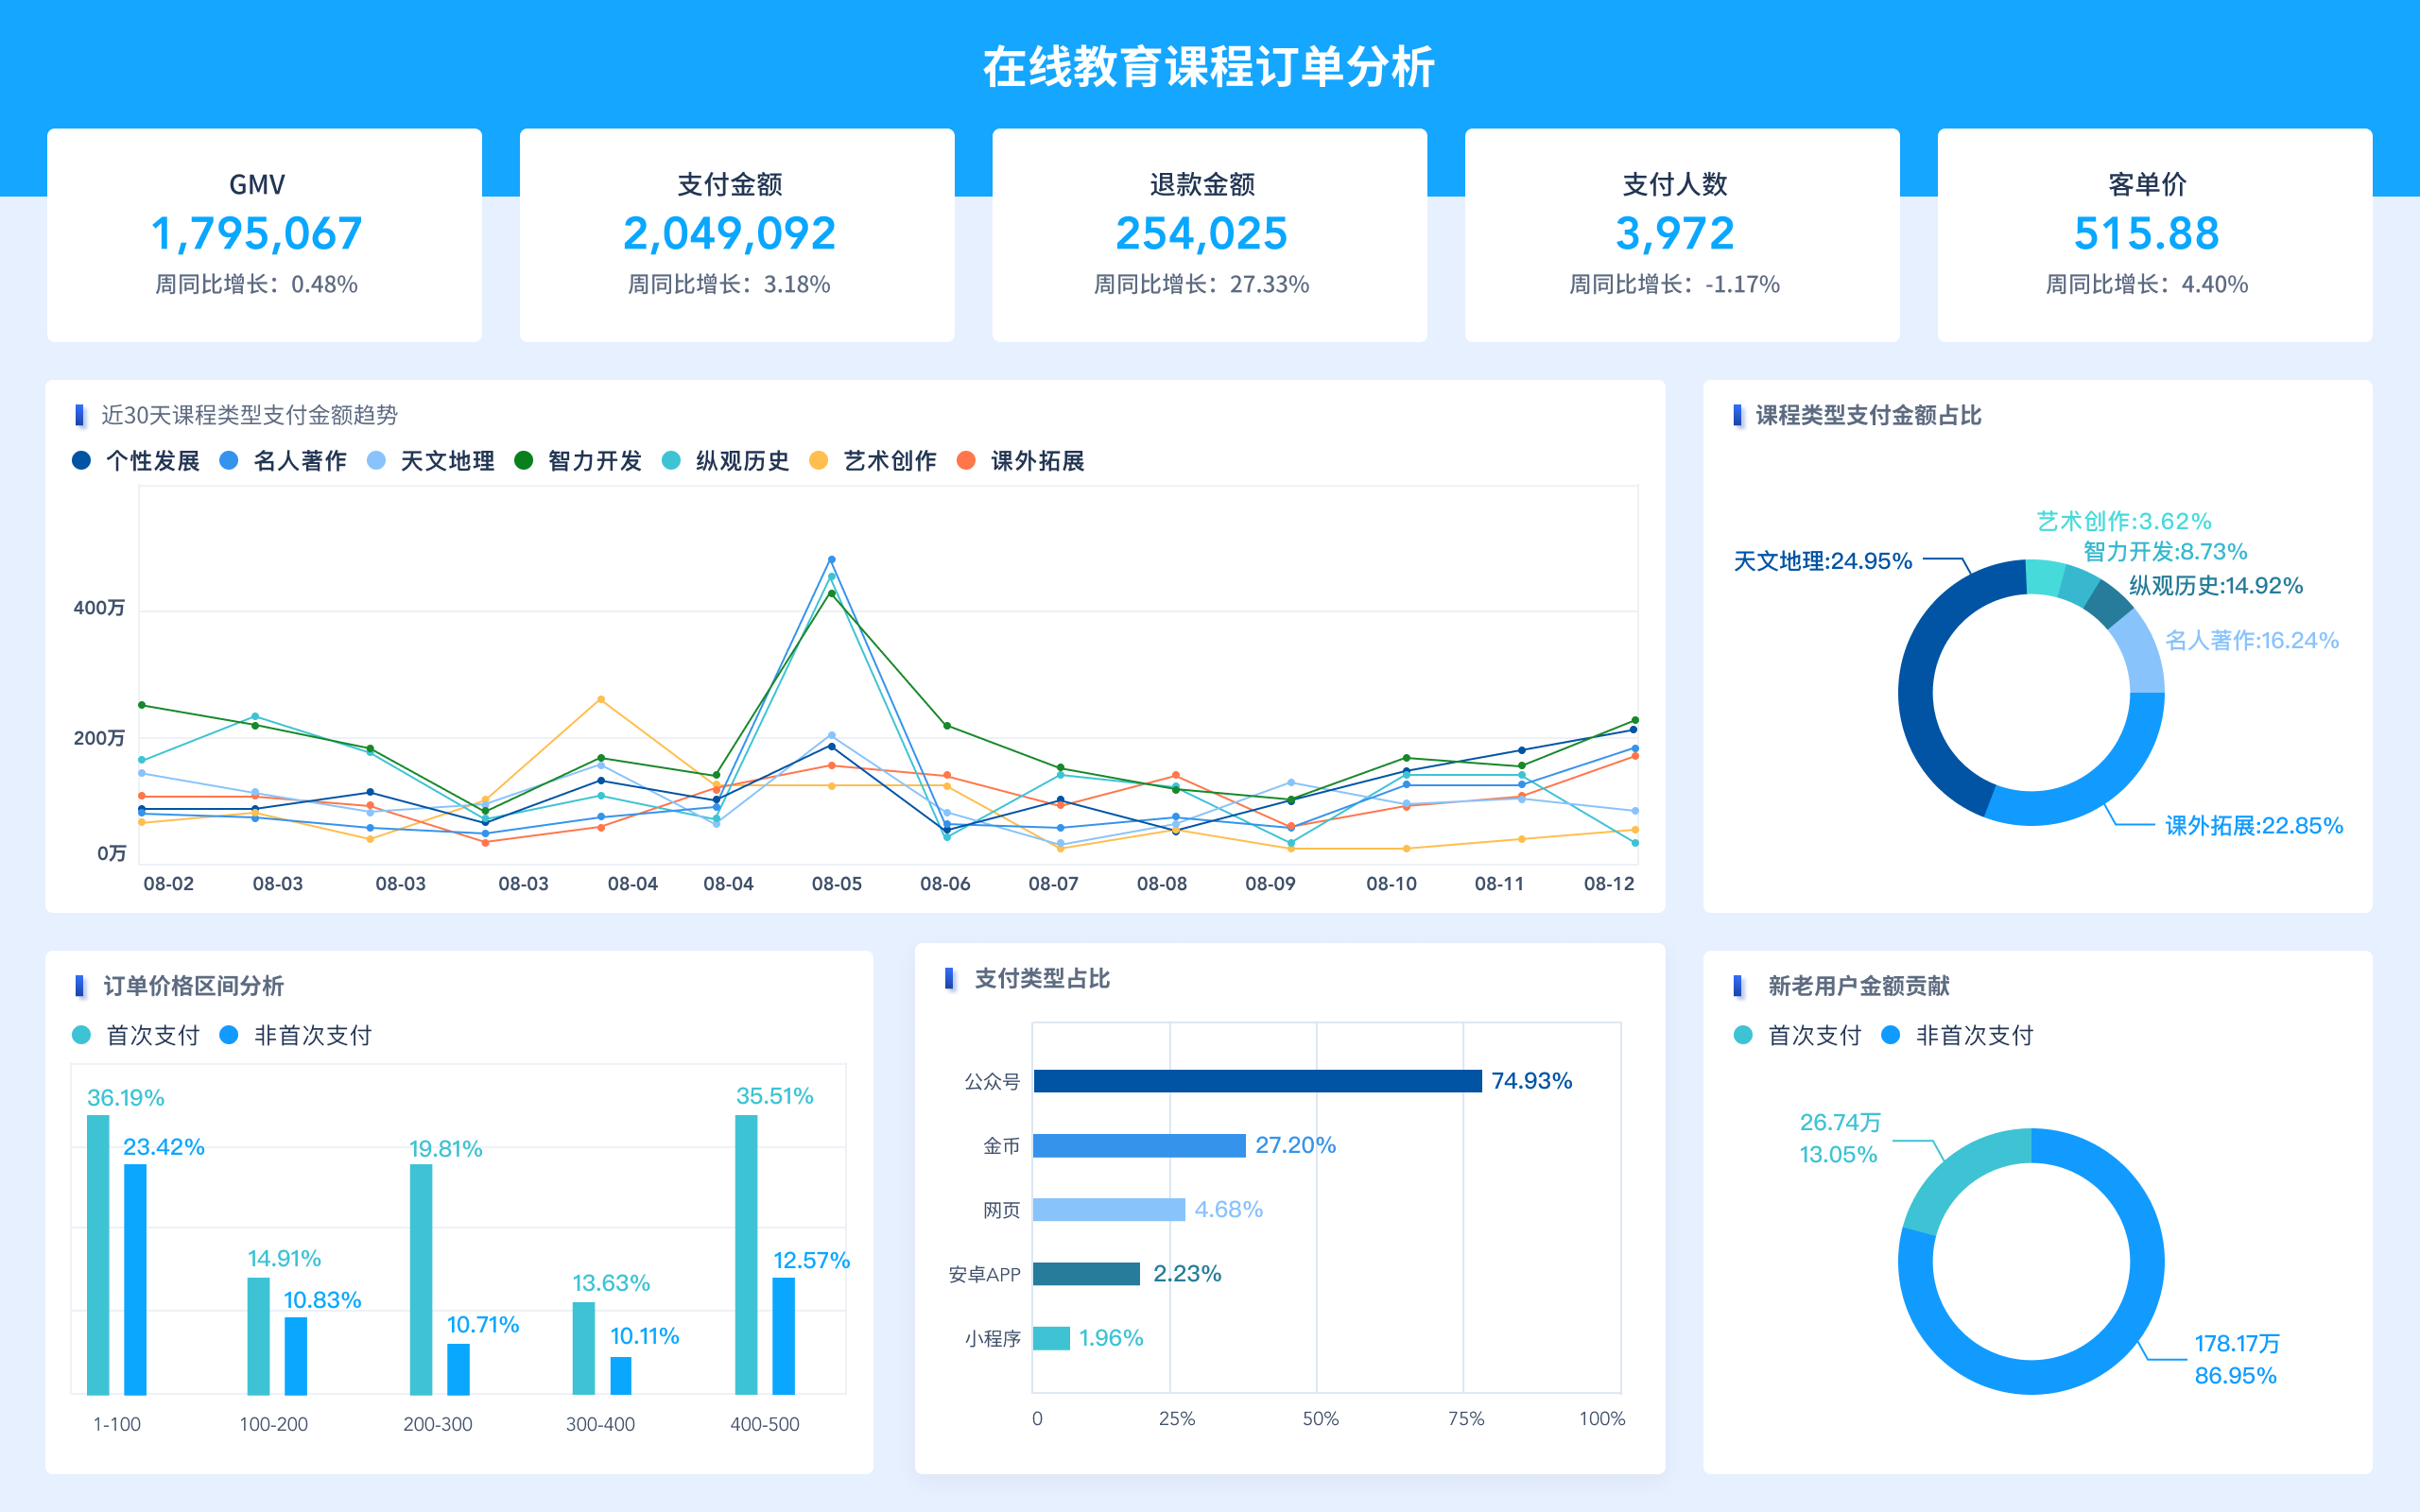
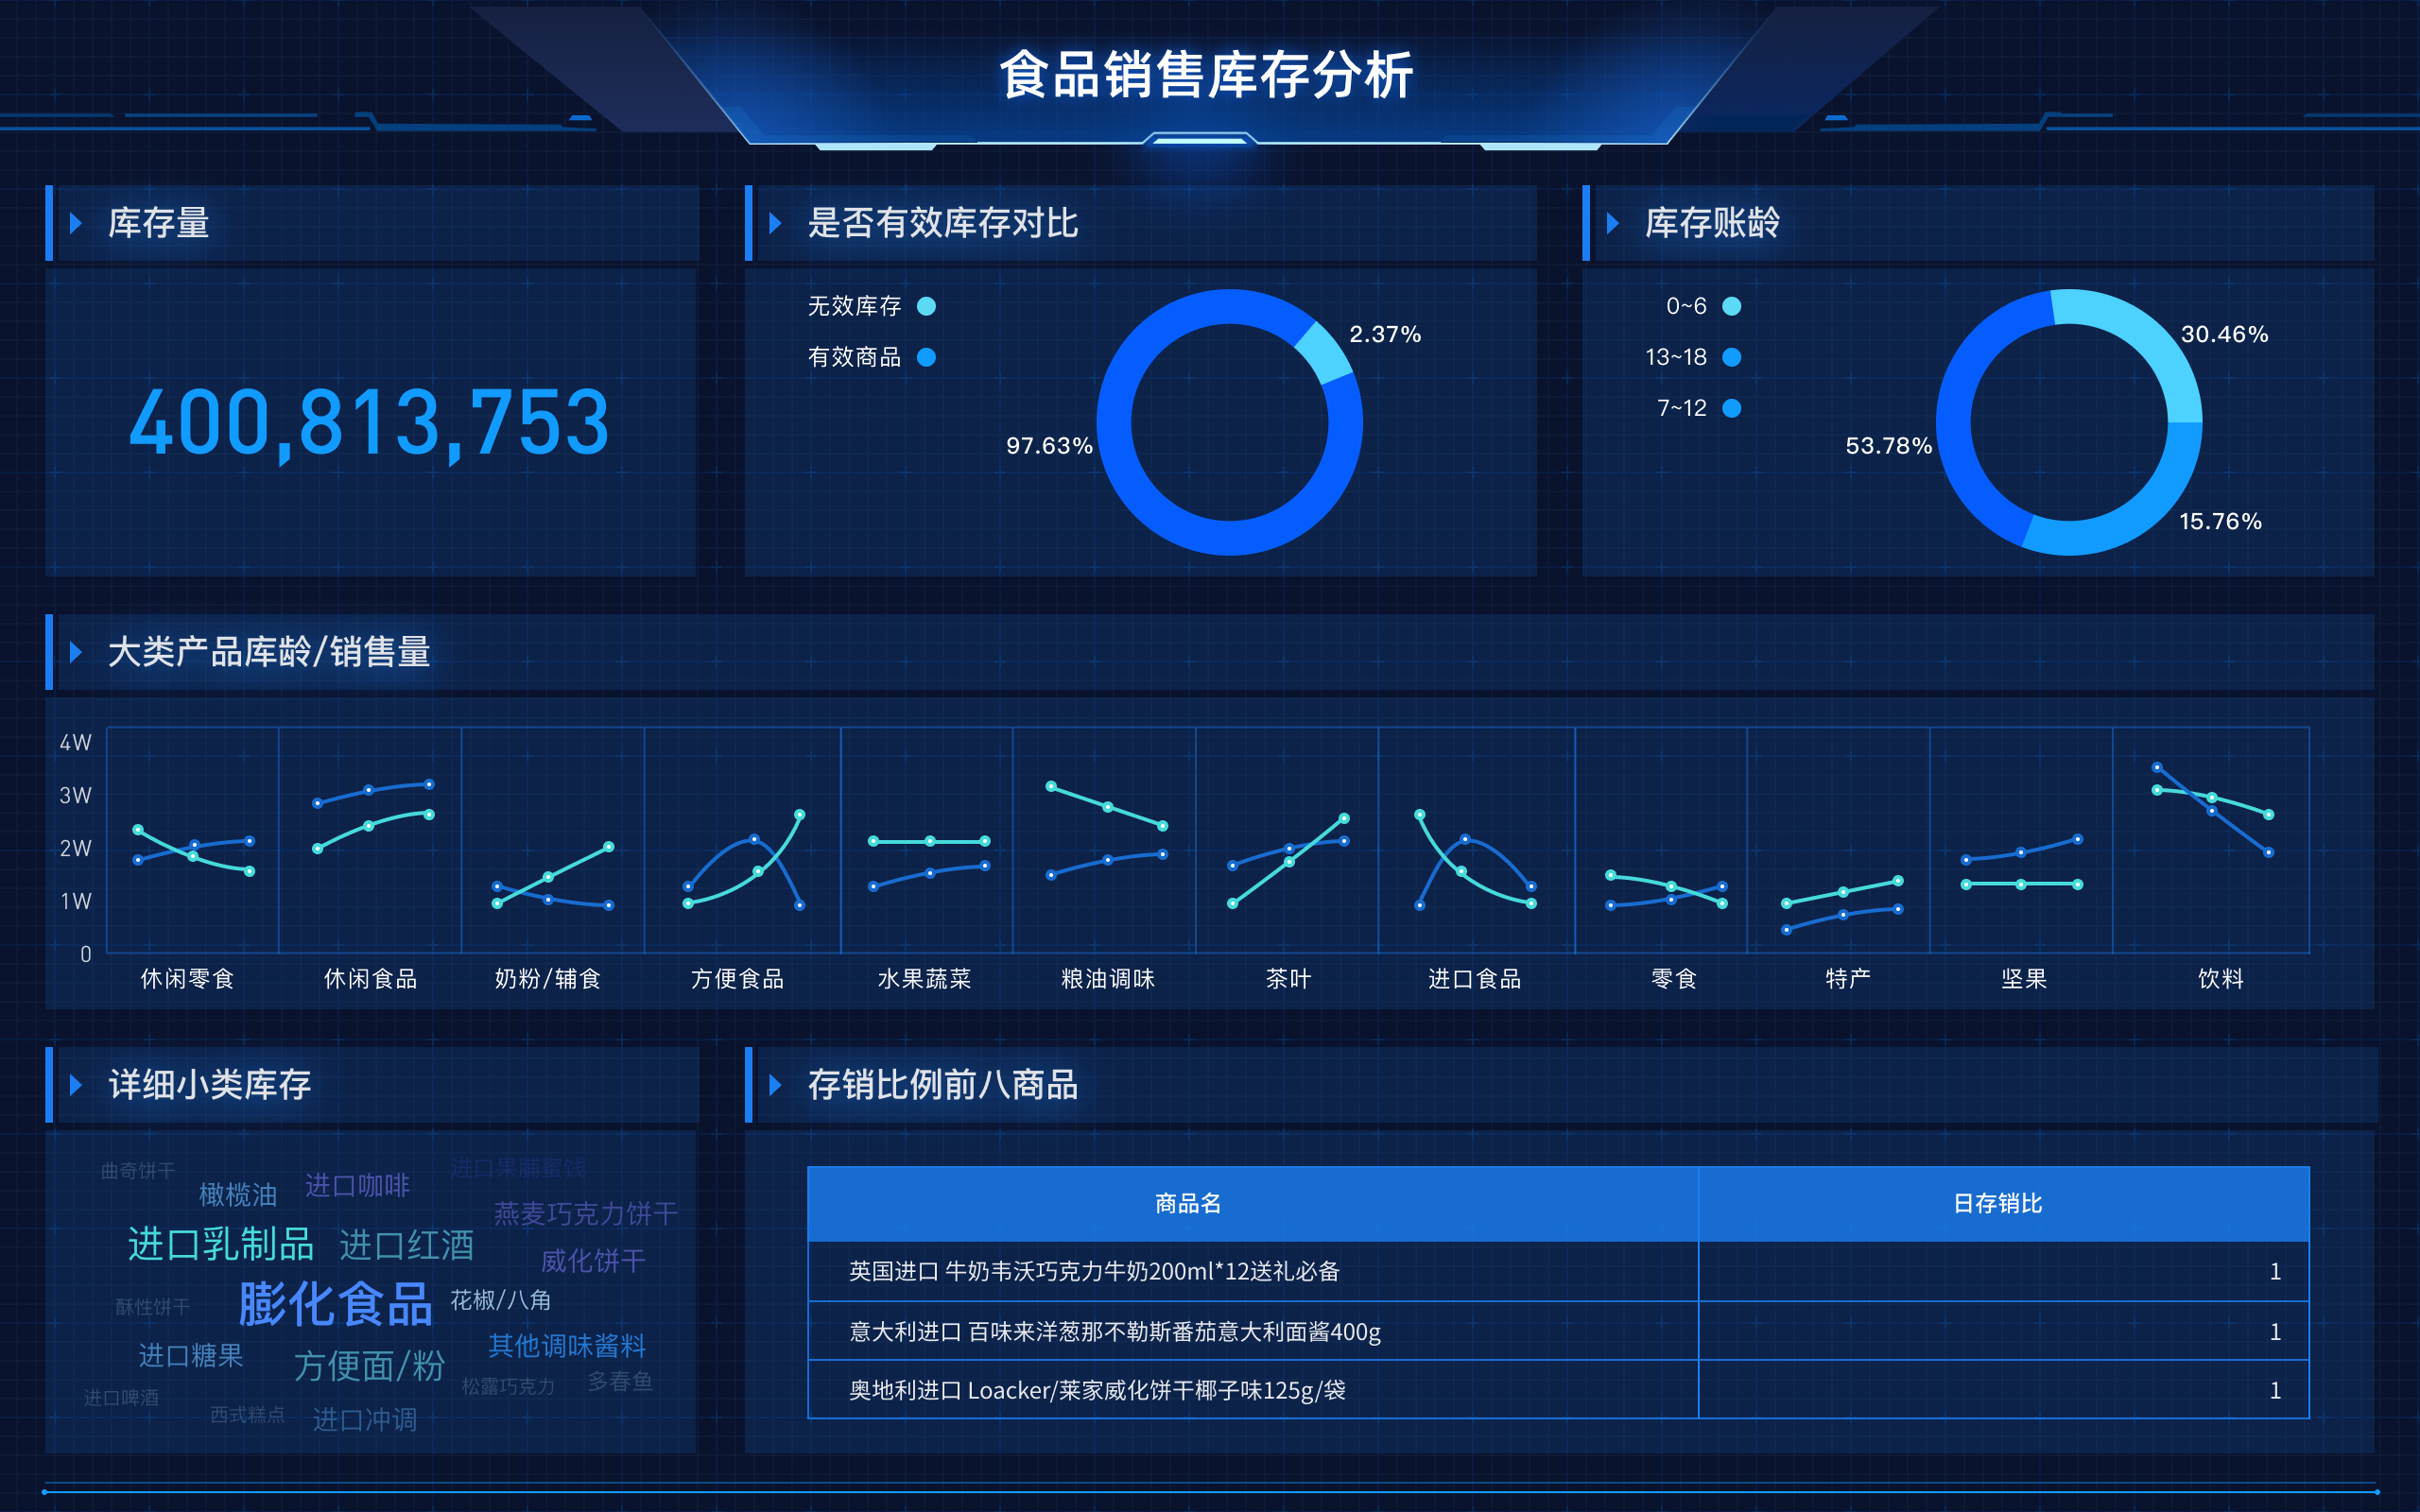
除了MATLAB,市场上还有其他强大的数据可视化工具,例如FineBI、FineReport、FineVis。这些工具同样具有丰富的功能和良好的用户体验:
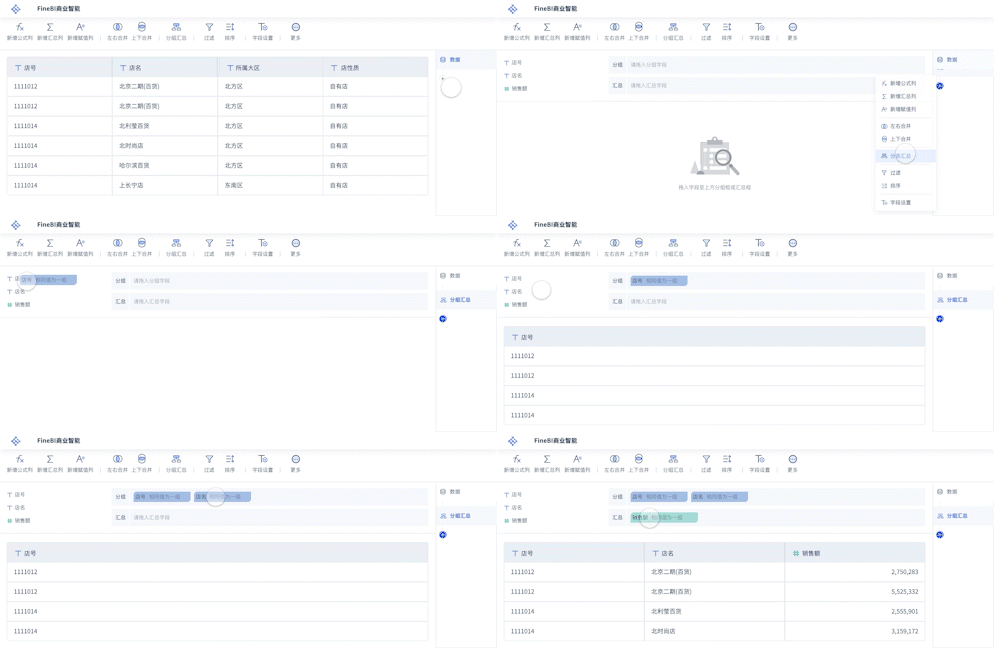
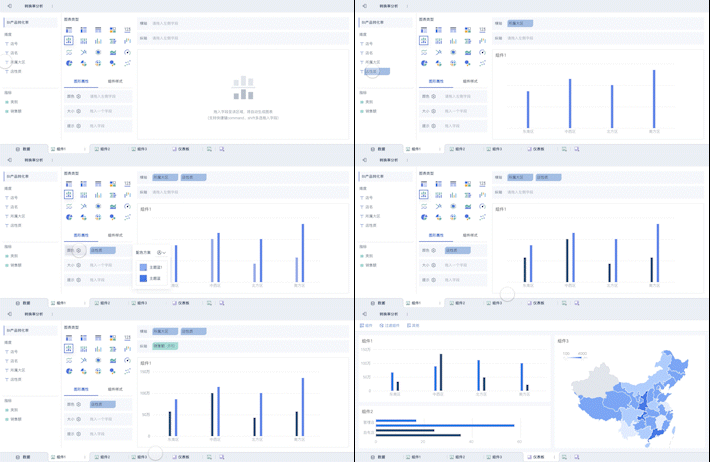
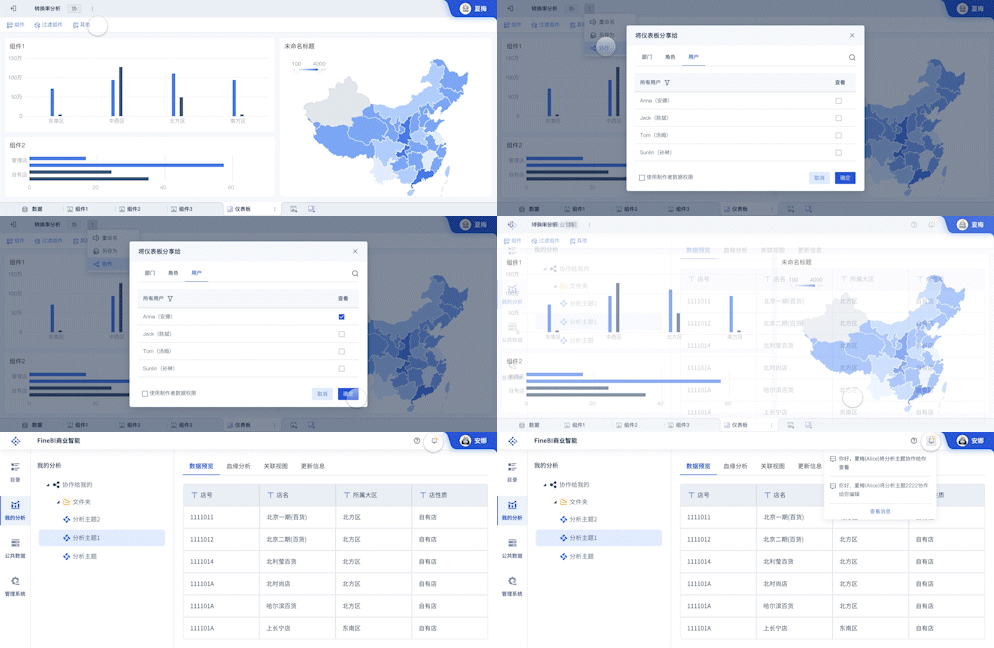
- FineBI:专注于商业智能分析,提供丰富的图表类型和数据分析功能。官网地址: FineBI官网
- FineReport:专注于报表设计和数据展示,支持多种数据源和复杂报表设计。官网地址: FineReport官网
- FineVis:专注于数据可视化,提供丰富的图表和交互功能,适用于大数据分析。官网地址: FineVis官网
这些工具各有优势,用户可以根据具体需求选择合适的工具进行数据可视化。
总之,MATLAB数据可视化功能强大,适用范围广泛,不论是简单的图表还是复杂的3D图形,都能通过简单的命令实现,并且提供了高度的自定义功能,用户友好的界面和与其他工具的良好集成,使得MATLAB成为数据可视化的有力工具。结合Fine系列产品,用户可以根据具体需求选择最合适的工具进行数据分析和展示。
相关问答FAQs:
FAQs about Data Visualization in MATLAB
1. What are the key features of MATLAB for data visualization?
MATLAB is renowned for its robust data visualization capabilities, providing a range of tools that cater to both simple and complex visualization needs. Its key features include:
-
Comprehensive Plot Types: MATLAB supports a wide variety of plot types such as 2D plots, 3D plots, scatter plots, bar charts, histograms, and pie charts. This diversity allows users to represent data in the most effective way possible depending on the nature of the data and the desired insights.
-
Customization and Styling: Users can customize every aspect of their plots, including colors, line styles, markers, and axes properties. MATLAB’s advanced graphics editing tools enable users to create visually appealing and publication-ready figures.
-
Interactive Tools: MATLAB offers interactive plotting tools that allow users to explore data dynamically. Features such as zooming, panning, and rotating 3D plots enhance the data analysis experience and help in gaining deeper insights.
-
Built-in Functions: MATLAB includes a variety of built-in functions for statistical analysis, curve fitting, and data aggregation. These functions integrate seamlessly with visualization tools, allowing for comprehensive data exploration and presentation.
-
Integration with Apps: MATLAB’s integration with apps like MATLAB App Designer allows users to build custom interactive applications. These applications can incorporate advanced data visualization components tailored to specific needs.
2. How can MATLAB enhance the quality of data visualization compared to other tools?
MATLAB stands out in data visualization due to its:
-
High-Resolution Graphics: MATLAB generates high-resolution graphics that are suitable for both on-screen presentations and printed publications. The precision in rendering helps in producing clear and detailed visualizations.
-
Advanced Data Analysis Capabilities: Unlike many basic visualization tools, MATLAB provides advanced data analysis functions that can be applied directly to visualizations. This includes capabilities for machine learning, statistical modeling, and signal processing, which can be visualized in real time.
-
Customizable User Experience: MATLAB’s extensive customization options allow users to fine-tune visualizations to their exact specifications. This includes modifying the appearance of plots, adjusting the layout of figures, and integrating multiple data sets into a single visualization.
-
Integration with Other MATLAB Features: The ability to integrate data visualization with other MATLAB features, such as scripting and computational tools, enhances the overall analysis workflow. Users can automate tasks, run simulations, and visualize results seamlessly.
-
Community and Support: MATLAB has a large user community and extensive documentation. This support system provides numerous resources, including code examples, tutorials, and forums where users can seek advice and share best practices.
3. What are some common applications of MATLAB data visualization in research and industry?
MATLAB’s data visualization capabilities are widely utilized across various fields. Some common applications include:
-
Scientific Research: Researchers use MATLAB to visualize experimental data, analyze trends, and present findings in academic papers. The ability to create detailed plots and figures helps in communicating complex scientific results effectively.
-
Engineering: In engineering disciplines, MATLAB is employed to visualize simulation results, design performance metrics, and analyze system behaviors. Engineers use visualizations to validate models, optimize designs, and troubleshoot issues.
-
Finance: Financial analysts use MATLAB to visualize market trends, risk assessments, and investment portfolios. Interactive charts and graphs help in making informed decisions based on historical data and predictive models.
-
Medical Imaging: MATLAB is used in medical imaging to visualize MRI, CT scans, and other medical images. The ability to process and visualize high-dimensional data assists in diagnostics, treatment planning, and research.
-
Machine Learning: In machine learning, MATLAB visualizes data distributions, model performance, and training results. Visualization tools help in understanding the behavior of algorithms and interpreting results.
In summary, MATLAB’s rich feature set for data visualization, combined with its advanced analysis capabilities and extensive customization options, makes it a powerful tool for researchers and professionals across various domains. Its applications are diverse, ranging from scientific research to industry-specific needs, enhancing both the quality and efficiency of data analysis and presentation.
本文内容通过AI工具匹配关键字智能整合而成,仅供参考,帆软不对内容的真实、准确或完整作任何形式的承诺。具体产品功能请以帆软官方帮助文档为准,或联系您的对接销售进行咨询。如有其他问题,您可以通过联系blog@fanruan.com进行反馈,帆软收到您的反馈后将及时答复和处理。


