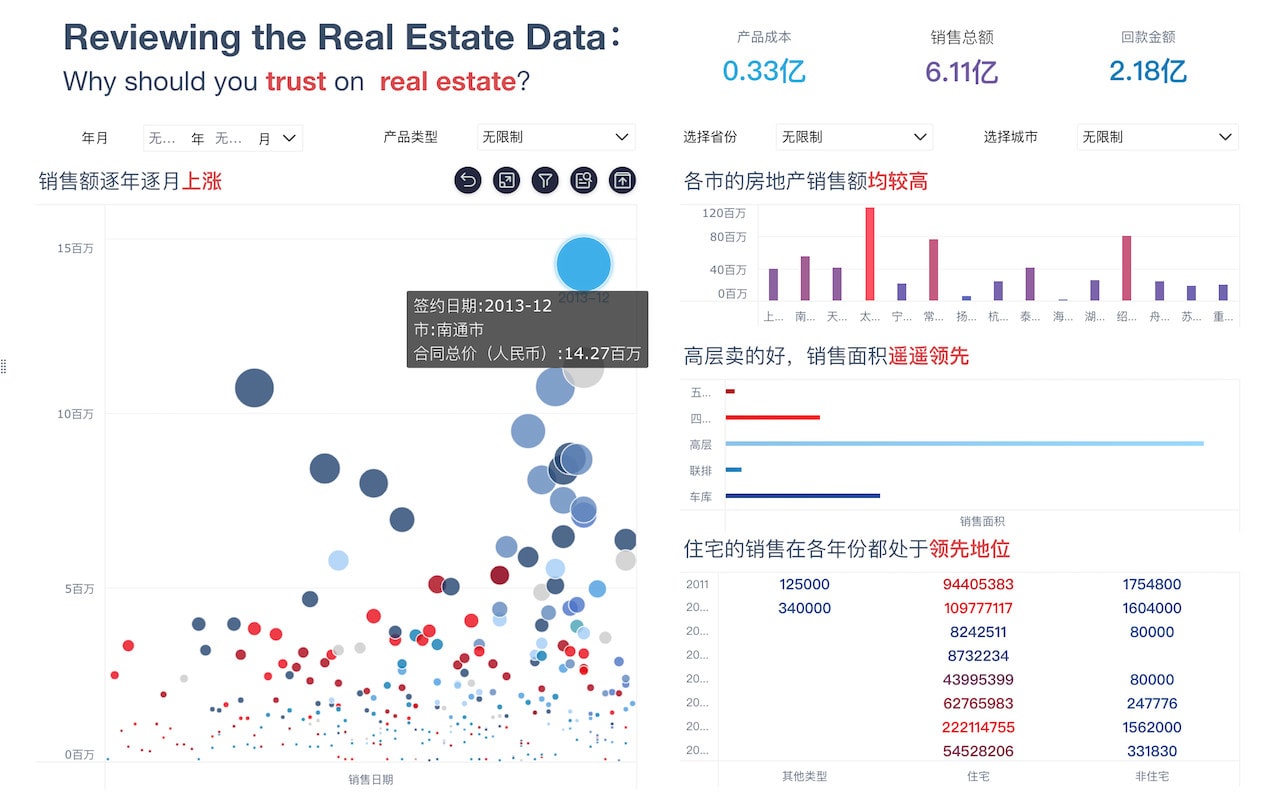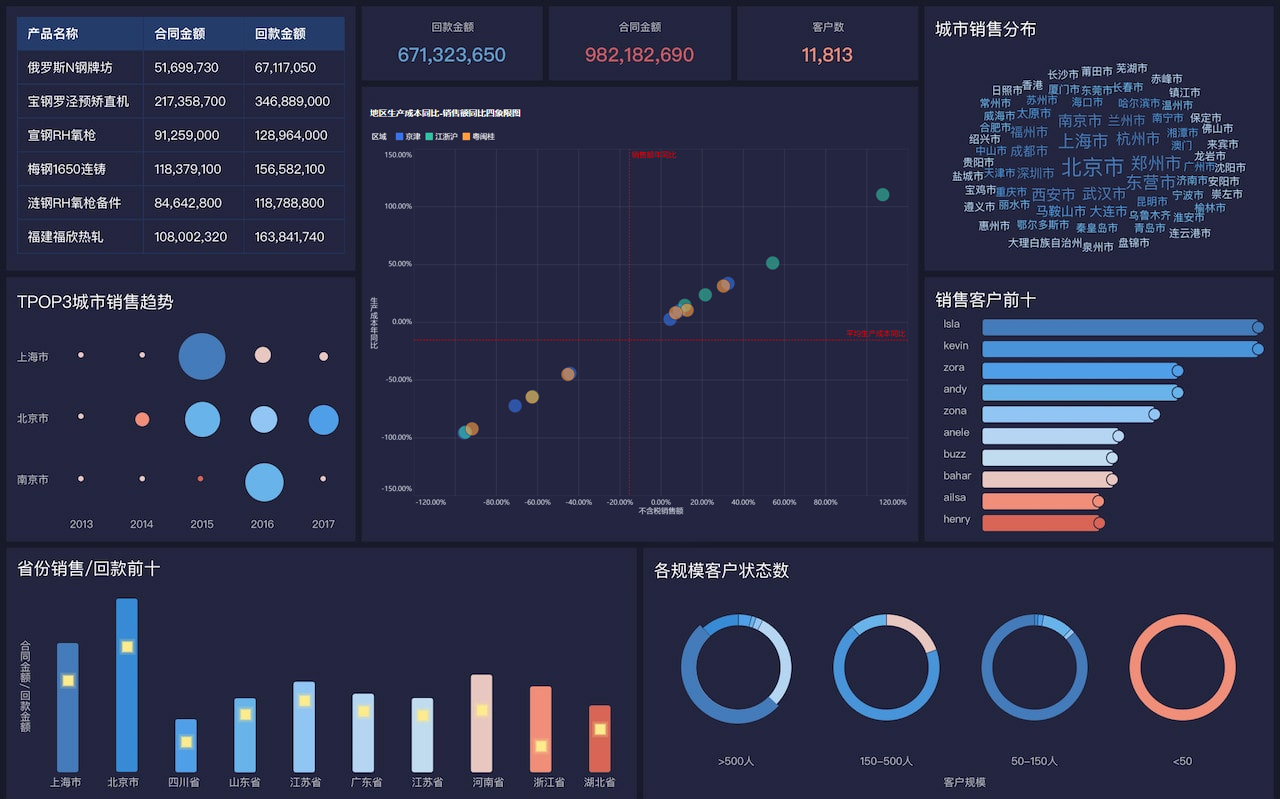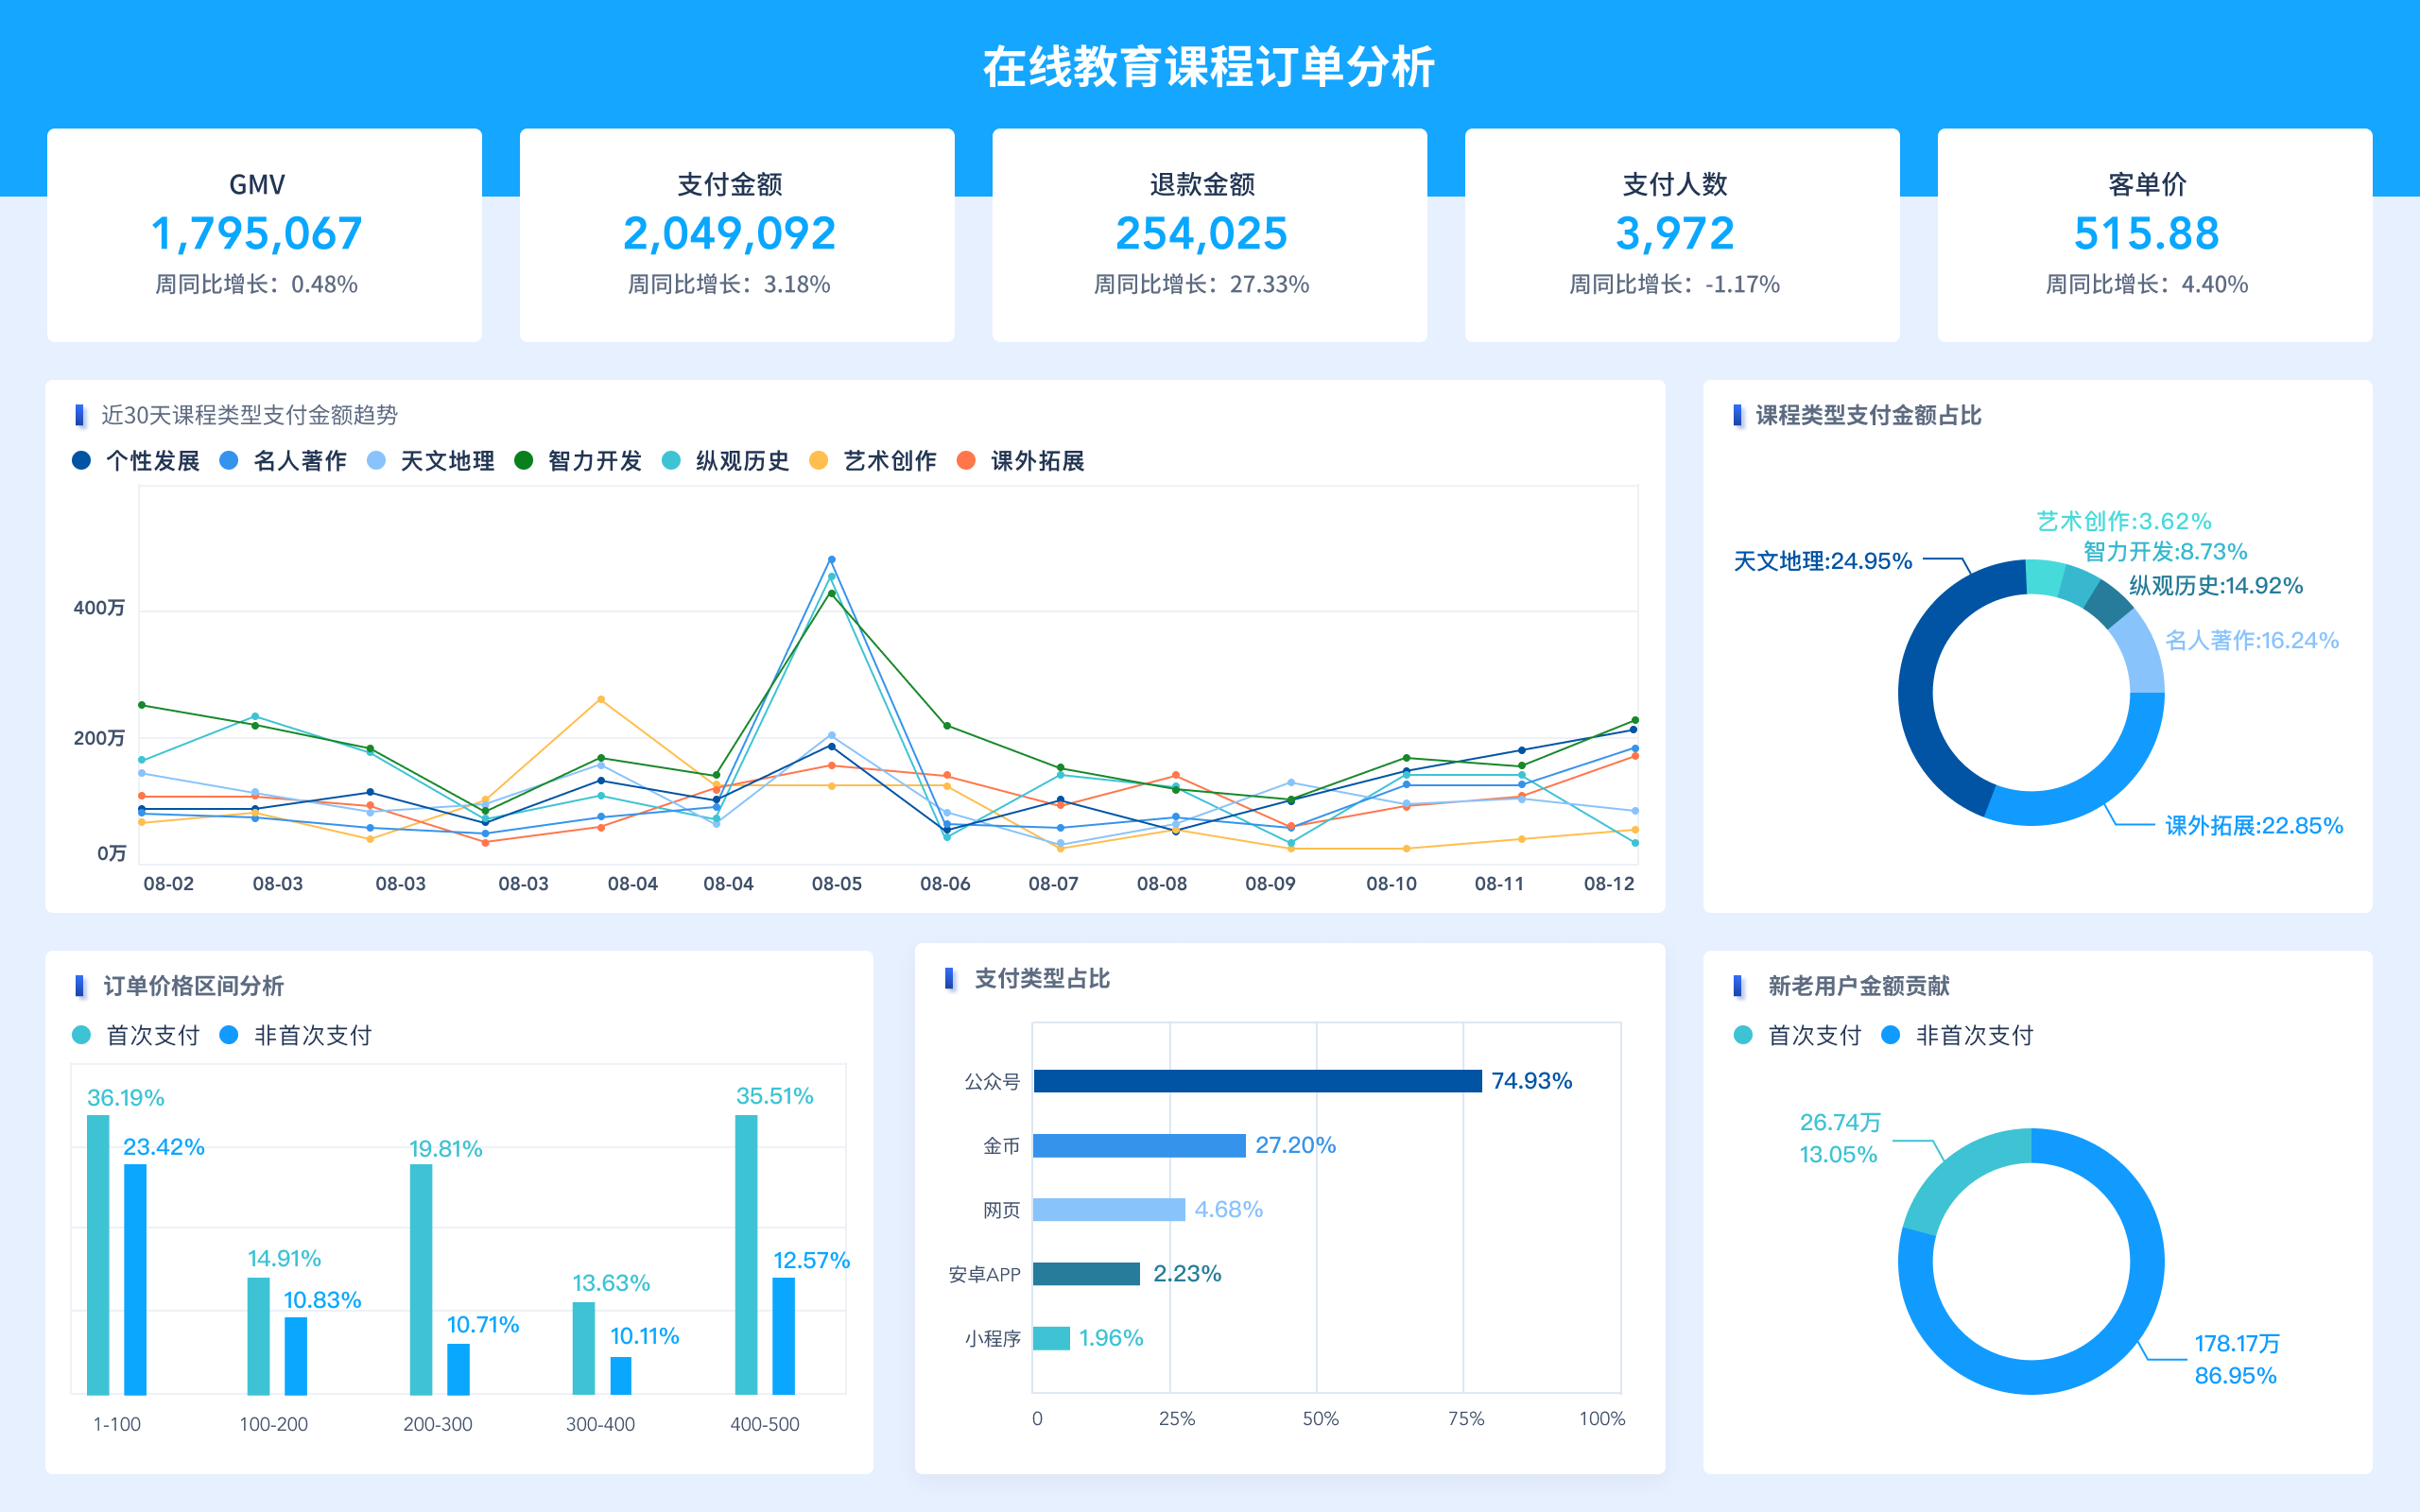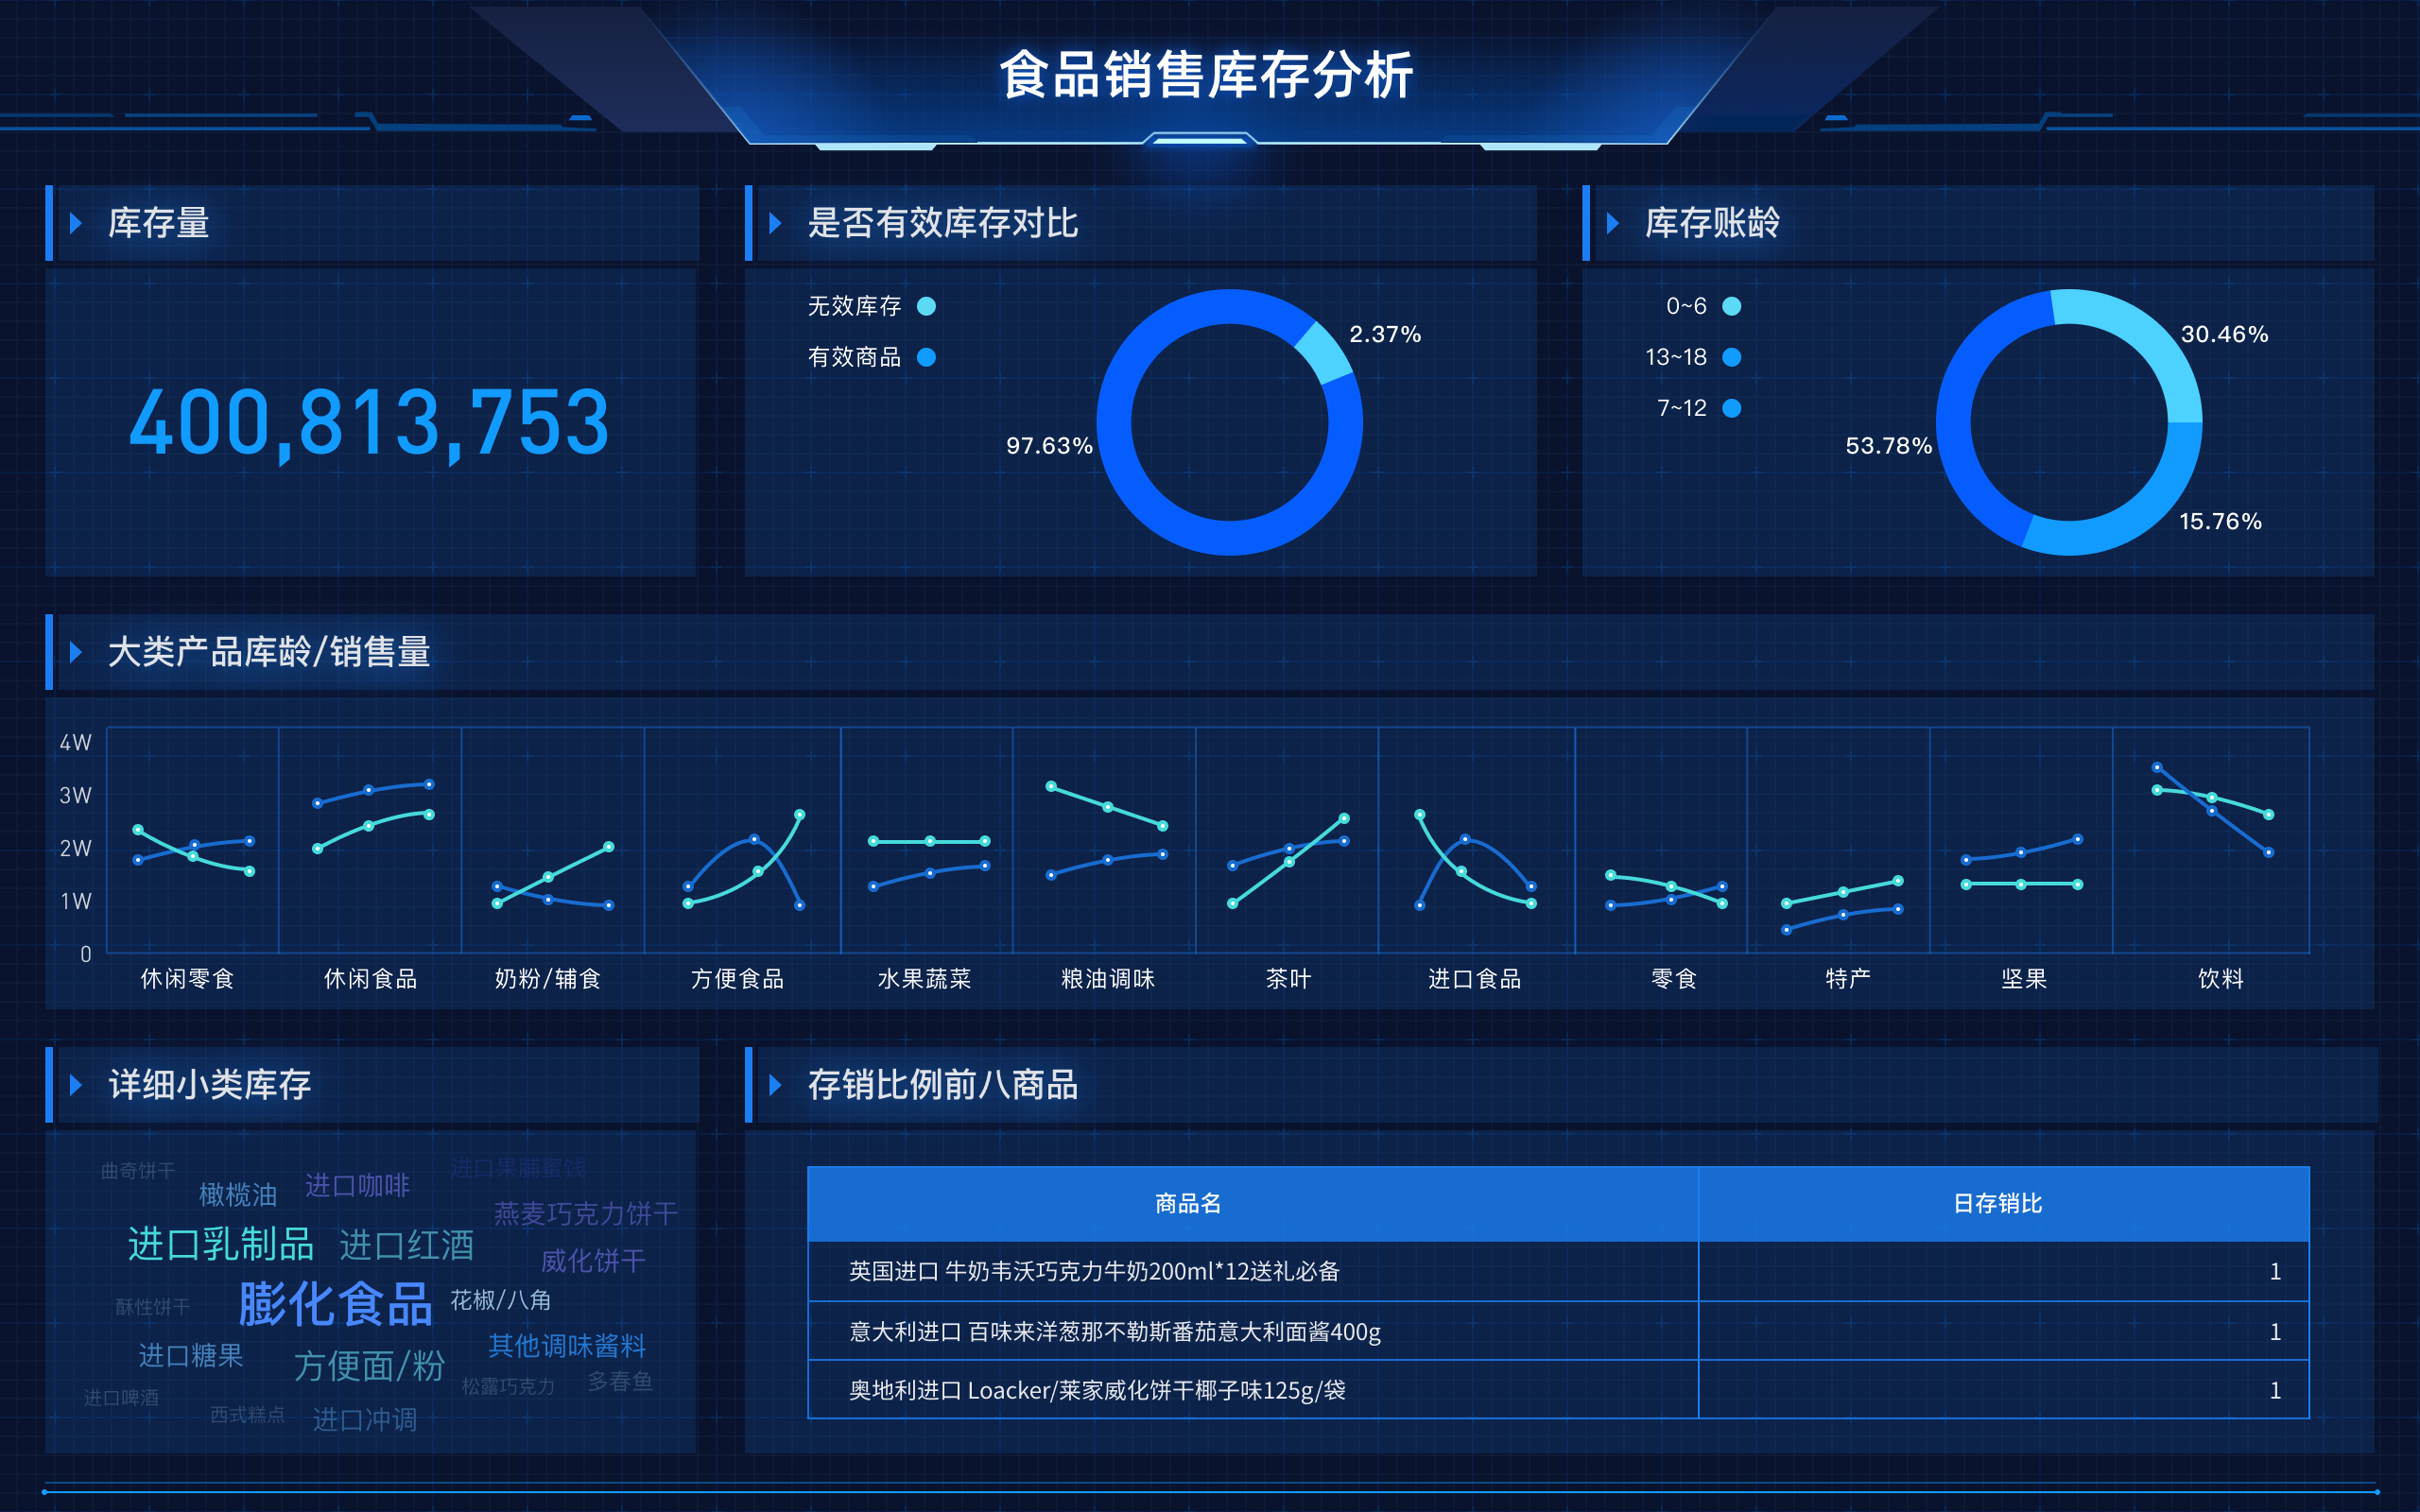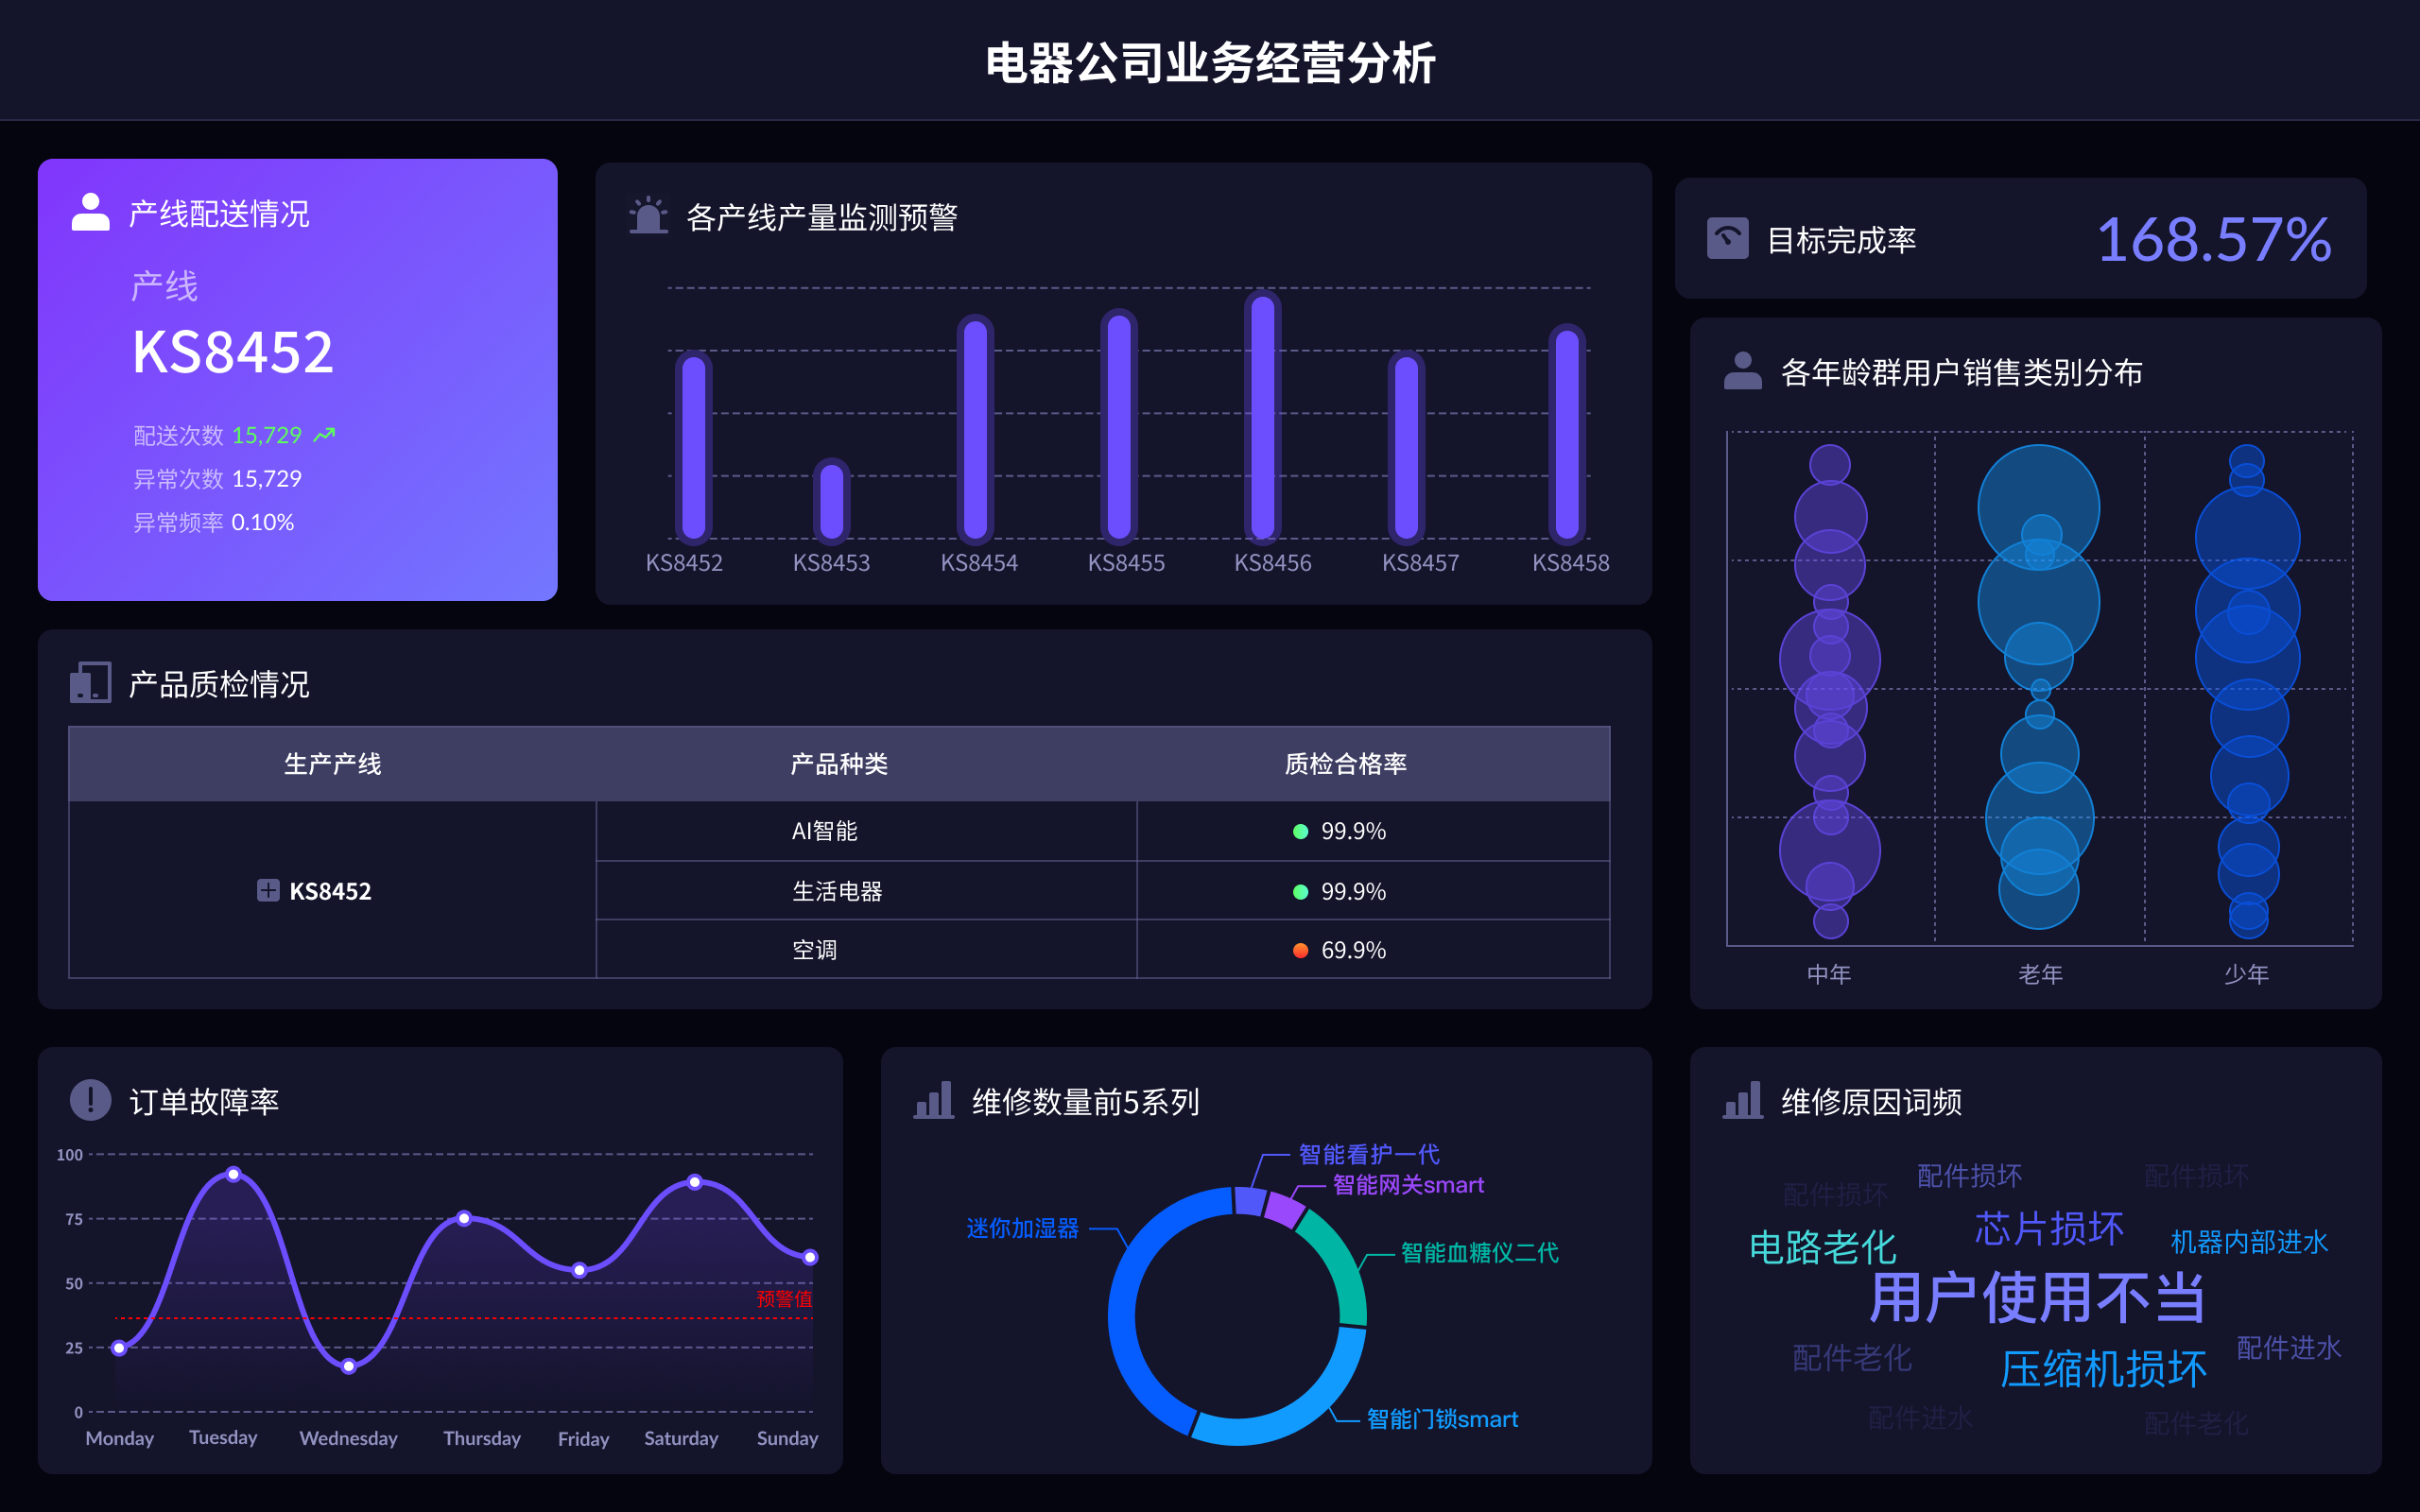
AE制作可视化数据大屏的方法有:使用脚本语言生成动态内容、应用插件或外部工具集成、利用AE内置图表工具进行数据可视化。其中,使用脚本语言生成动态内容是一种灵活且功能强大的方法,它可以让你根据需求编写脚本来自动生成复杂的图形和动画,极大地提高了制作效率和效果。
一、使用脚本语言生成动态内容
使用脚本语言生成动态内容是AE制作可视化数据大屏的一种高效方法。通过编写JavaScript脚本,可以控制AE中的各个元素,实现数据驱动的动画效果。脚本可以读取外部数据源,如CSV文件或API接口的数据,根据数据内容动态生成图形和动画。这种方法不仅提高了制作效率,还能确保数据的实时性和准确性。
1.1、基础知识和工具
掌握基本的JavaScript编程知识是关键,AE提供了强大的ExtendScript编程环境,允许用户通过编写脚本实现自动化操作。还可以借助第三方插件,如Duik、Motion Script等,增强脚本功能。
1.2、数据源读取与处理
将数据源导入AE是实现动态数据可视化的第一步。可以使用CSV文件或通过API接口直接读取实时数据。需要编写脚本来解析数据,并根据数据内容创建相应的图形元素。
1.3、动画效果实现
通过脚本控制AE中的图层属性,可以实现各种动画效果。例如,可以根据数据变化调整图形的大小、颜色、位置等属性,生成动态的柱状图、折线图等。
1.4、优化与调试
在脚本编写完成后,需要进行反复测试和调试,确保动画效果符合预期。优化脚本的执行效率也是一个重要环节,特别是在处理大数据量时,需要避免不必要的计算和操作。
二、应用插件或外部工具集成
应用插件或外部工具集成是另一种高效的方法。AE生态系统中有许多强大的插件和外部工具,可以简化数据可视化的制作过程。这些工具通常提供了丰富的模板和功能,使得即使没有编程经验的用户也能轻松上手。
2.1、常用插件介绍
一些流行的AE插件,如Data-driven Animation、BAO Mask Avenger、plexus等,都提供了强大的数据可视化功能。Data-driven Animation插件允许用户将数据直接导入AE并生成相应的动画效果,而BAO Mask Avenger则专注于面具动画的创建。
2.2、插件使用技巧
选择合适的插件后,需要熟悉其使用方法和技巧。通常,插件会提供详细的用户手册和教程,按照这些指导进行操作,可以快速掌握插件的核心功能。在实际使用中,还可以通过调整参数和设置,定制化实现各种效果。
2.3、外部工具集成
除了插件,外部工具如Tableau、Power BI等也可以与AE集成,生成数据可视化内容。这些工具本身具备强大的数据分析和可视化能力,通过导出图像或视频格式的文件,可以轻松导入AE进行进一步处理和美化。
2.4、实际应用案例
许多实际案例表明,应用插件和外部工具能够极大地提高工作效率和效果。例如,某公司使用Data-driven Animation插件,成功制作了一系列高质量的数据可视化动画,大大提升了其市场宣传的效果和影响力。
三、利用AE内置图表工具进行数据可视化
利用AE内置图表工具进行数据可视化是一种直接而有效的方法。AE自带了一些基本的图表工具,如Shape Layers和Text Layers,可以用于创建简单的图表和数据可视化效果。
3.1、Shape Layers的应用
Shape Layers是AE中非常强大的工具,可以用于创建各种图形和图表。通过调整Shape Layers的属性,如位置、大小、颜色等,可以生成柱状图、折线图、饼图等常见图表。
3.2、Text Layers的使用
Text Layers不仅可以用于文本显示,还可以通过脚本控制实现动态数据展示。例如,可以根据数据变化自动更新文本内容,显示实时数据值或变化趋势。
3.3、关键帧与表达式的结合
在AE中,关键帧和表达式是实现动画效果的两大核心工具。通过设置关键帧,可以控制图形和文本的动画过程,而表达式则可以用来实现复杂的动态效果,如随时间变化的动画或数据驱动的动画。
3.4、实际操作步骤
首先,导入数据并创建相应的Shape Layers和Text Layers;然后,通过设置关键帧和编写表达式,控制这些图层的属性变化,实现动画效果;最后,进行调试和优化,确保动画效果符合预期。
四、FineBI、FineReport、FineVis的使用
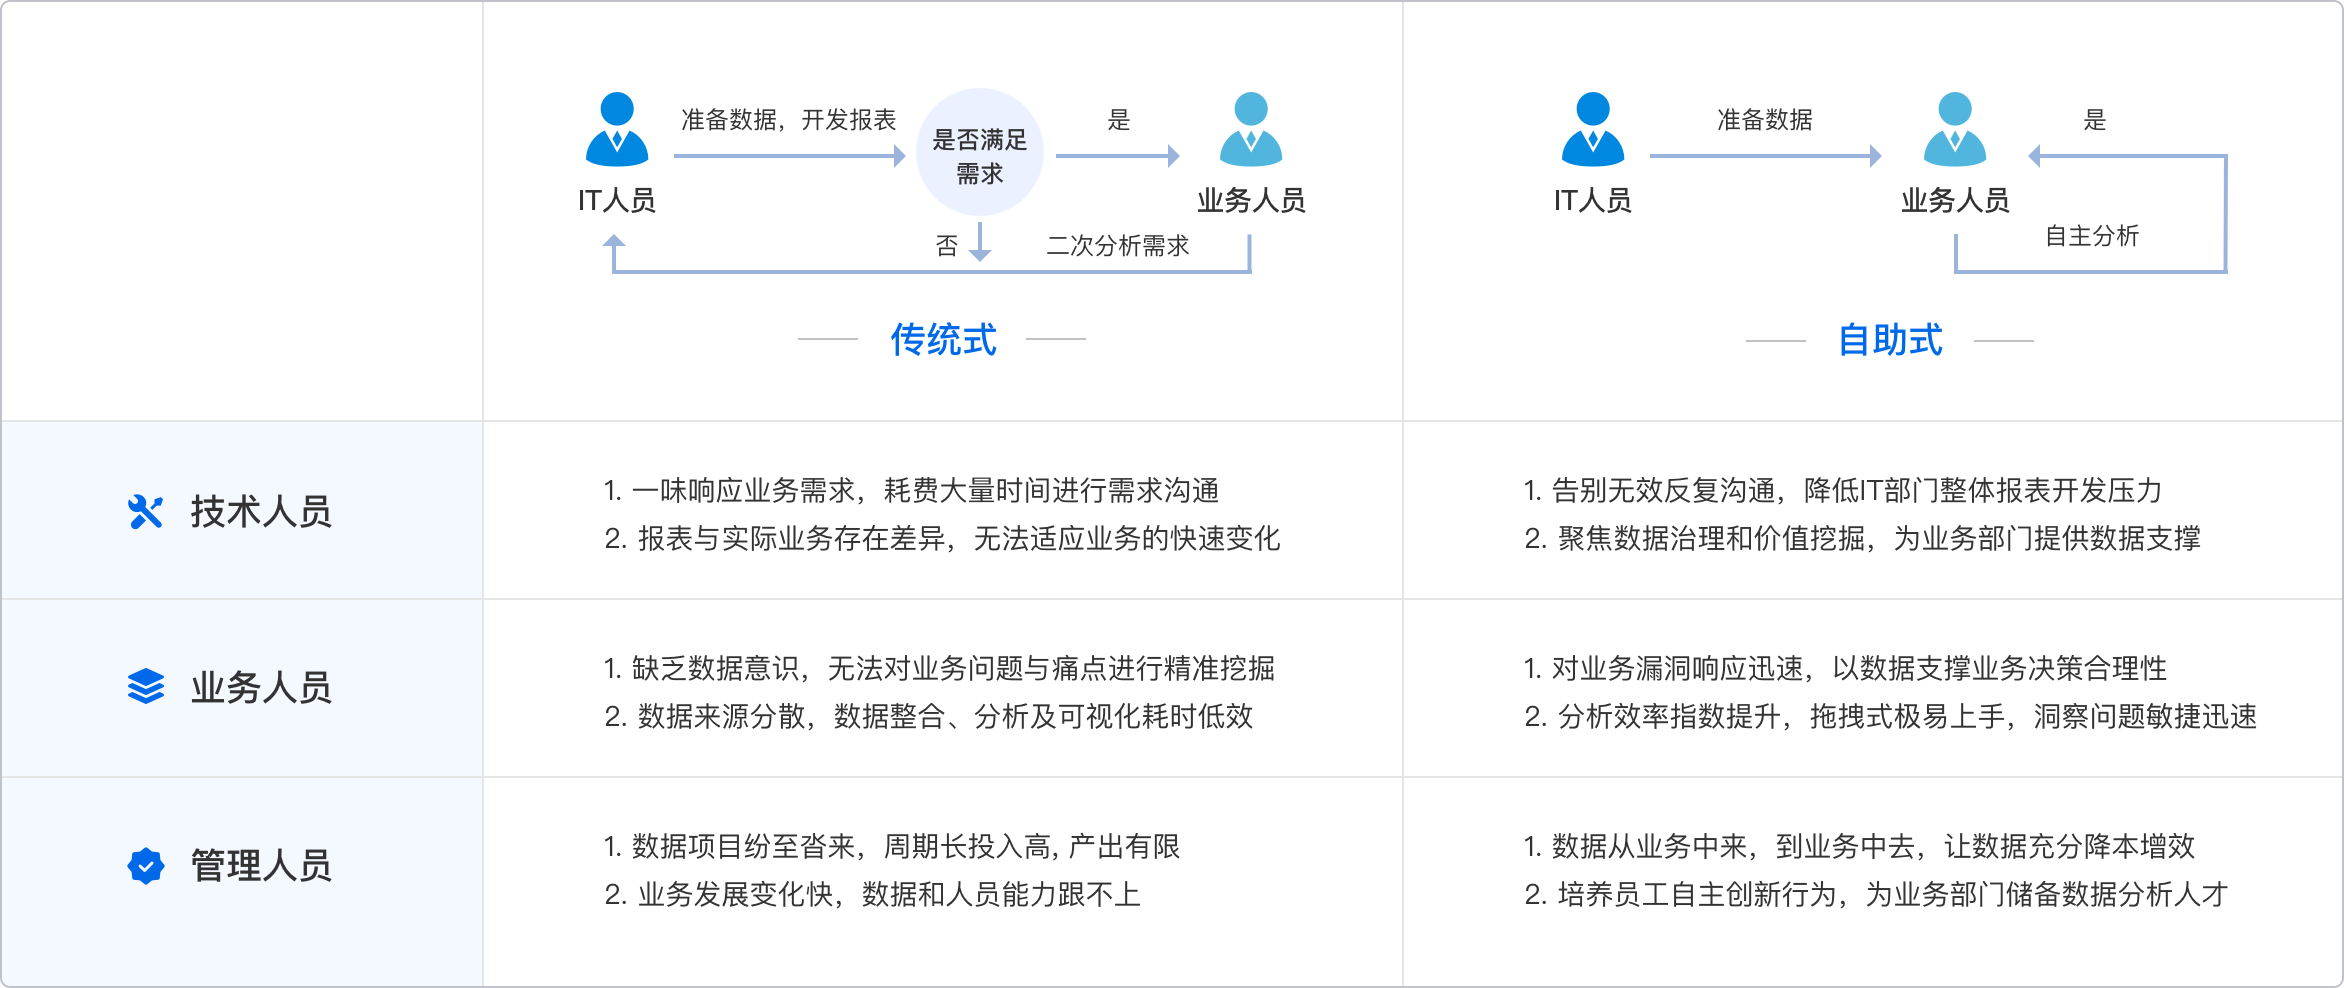
FineBI、FineReport、FineVis是帆软旗下的三款强大数据可视化工具,它们可以极大地简化数据大屏的制作过程,适用于各种应用场景。
4.1、FineBI的功能与应用
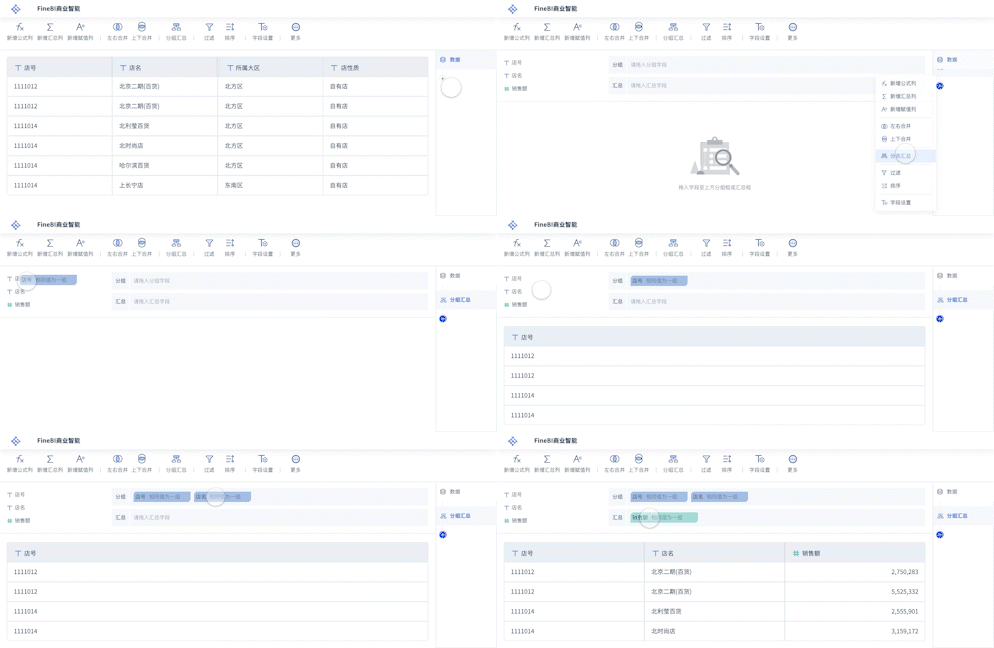
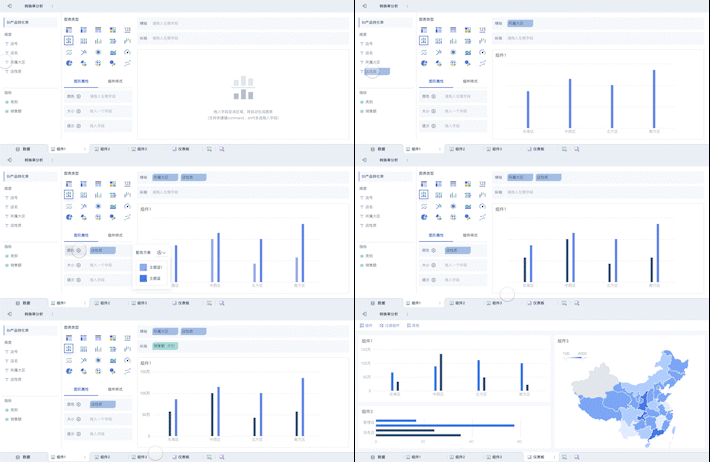
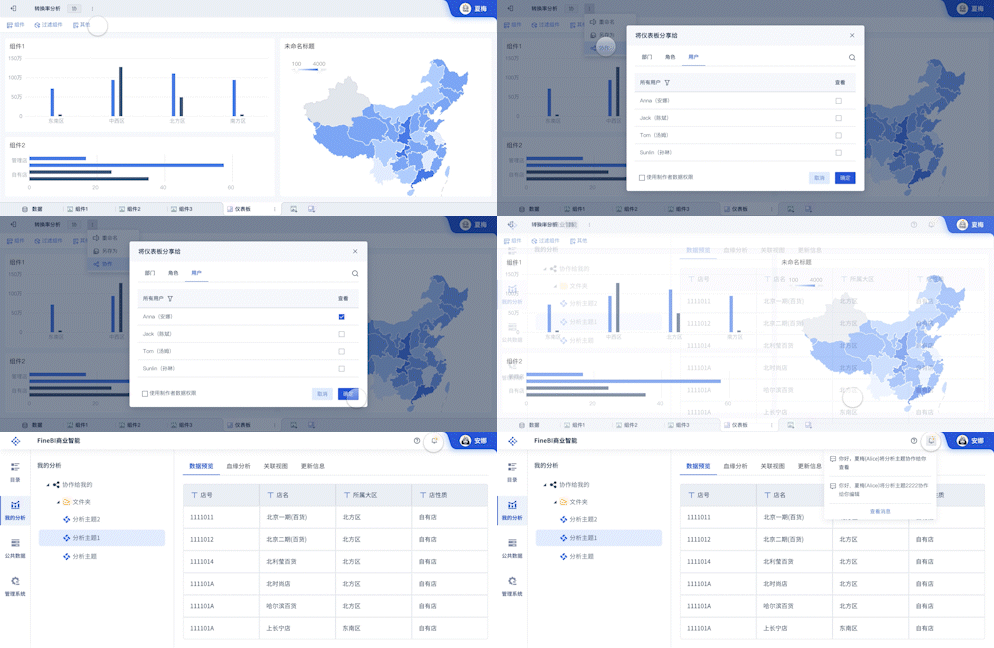
FineBI是一款专业的商业智能工具,提供了丰富的数据可视化功能和强大的数据分析能力。通过其图形化界面,可以轻松创建各种数据大屏,适用于企业级的数据分析和展示需求。详细信息可访问FineBI官网。
4.2、FineReport的特点与使用
FineReport是一款灵活的报表工具,支持复杂的数据处理和多种格式的报表输出。通过其可视化组件,可以快速生成高质量的数据大屏,满足各种业务需求。详细信息可访问FineReport官网。
4.3、FineVis的优势与实践
FineVis是一款专注于数据可视化的工具,提供了丰富的图表和大屏模板,用户可以根据实际需求进行定制化开发。其简便的操作界面和强大的功能,使得数据可视化变得更加轻松和高效。详细信息可访问FineVis官网。
4.4、综合比较与选择
根据具体需求选择合适的工具是关键。FineBI适用于需要深入数据分析的场景,FineReport适合复杂报表需求,而FineVis则专注于数据可视化展示。通过合理选择和应用这些工具,可以极大地提高数据大屏的制作效率和效果。
通过上述方法,结合AE的强大功能和合适的工具集成,可以实现高效且美观的可视化数据大屏制作,满足各种复杂的数据展示需求。
相关问答FAQs:
如何在After Effects中创建可视化数据大屏?
在现代数字化时代,数据可视化是传达复杂信息的关键工具之一。Adobe After Effects(AE)是一款强大的软件,可以用来创建引人入胜的数据可视化大屏。以下是关于如何在AE中制作数据可视化大屏的详细解答。
1. What are the initial steps to set up a data visualization project in After Effects?**
To kickstart a data visualization project in After Effects, begin by gathering and organizing your data. It's crucial to have a clear understanding of the information you want to display, as this will guide your design and animation choices. Here's a breakdown of the initial setup process:
-
Plan Your Visualization: Identify the type of data you need to visualize (e.g., bar charts, pie charts, line graphs) and the story you want to tell with your data. Sketch out your ideas on paper or use wireframing tools to create a rough design layout.
-
Set Up Your Composition: Open After Effects and create a new composition by selecting
Composition>New Compositionfrom the menu. Set the resolution, frame rate, and duration according to your project's needs. For a high-quality data visualization display, opt for a higher resolution like 1920×1080 or 4K. -
Import Your Assets: Bring in all necessary assets, including data sets, graphics, and any background images or videos. You can import files by going to
File>Import>File. Organize these assets in the Project panel to keep everything easily accessible. -
Create Data Layers: Create separate layers for different data elements. For instance, if you're working on a bar chart, create layers for each bar and its corresponding text labels. Use shape layers for graphical elements and text layers for data labels.
2. How can you animate data visualizations in After Effects?**
Animating data visualizations is crucial for making your data engaging and easy to understand. After Effects offers a variety of animation techniques to bring your data to life. Here's how you can animate your visualizations:
-
Keyframing Basics: Utilize keyframes to animate properties like position, scale, opacity, and rotation. Set keyframes by clicking the stopwatch icon next to the property you want to animate and adjust the values at different points in the timeline to create smooth transitions.
-
Graph Editor: Use the Graph Editor to fine-tune your animations. The Graph Editor allows you to adjust the speed and acceleration of your animations, creating more natural and dynamic movements. Access it by clicking on the Graph Editor button in the timeline panel.
-
Expressions and Effects: Leverage After Effects' built-in expressions and effects to automate and enhance your animations. For example, you can use the
Wiggleexpression to add random movement to elements or apply effects likePuppet Toolto deform shapes and create fluid animations. -
Precomposing: Precompose elements that will be animated together to simplify your timeline and make complex animations more manageable. To precompose, select the layers you want to combine, right-click, and choose
Pre-compose. This allows you to apply animations and effects to multiple layers simultaneously. -
Data-Driven Animations: For more advanced animations, consider using third-party plugins or scripts that integrate with After Effects. These tools can help you create data-driven animations that automatically update based on your data inputs.
3. What are some best practices for designing and exporting a data visualization big screen in After Effects?**
To ensure your data visualization big screen looks professional and performs well, follow these best practices:
-
Maintain Clarity and Simplicity: Keep your design clean and avoid clutter. Use contrasting colors and clear fonts to enhance readability. Limit the number of data points displayed at once to avoid overwhelming viewers.
-
Consistent Styling: Use a consistent color scheme and typography throughout your visualization to create a cohesive look. Apply styles and effects uniformly across all elements to maintain a polished appearance.
-
Optimize for Performance: To ensure smooth playback, optimize your After Effects project by reducing the complexity of layers and effects where possible. Pre-render or proxy less critical elements to speed up your workflow.
-
Export Settings: When exporting your final project, choose settings that balance quality and file size. For high-resolution displays, use formats like H.264 or QuickTime with the appropriate bitrate and resolution settings. Ensure that your export settings match the requirements of the display medium.
-
Testing and Review: Before finalizing your project, test the visualization on the intended display to ensure it appears as expected. Check for any alignment issues, resolution problems, or playback glitches and make necessary adjustments.
By following these steps, you can create effective and visually appealing data visualizations in After Effects, enhancing the way data is presented and understood.
本文内容通过AI工具匹配关键字智能整合而成,仅供参考,帆软不对内容的真实、准确或完整作任何形式的承诺。具体产品功能请以帆软官方帮助文档为准,或联系您的对接销售进行咨询。如有其他问题,您可以通过联系blog@fanruan.com进行反馈,帆软收到您的反馈后将及时答复和处理。


