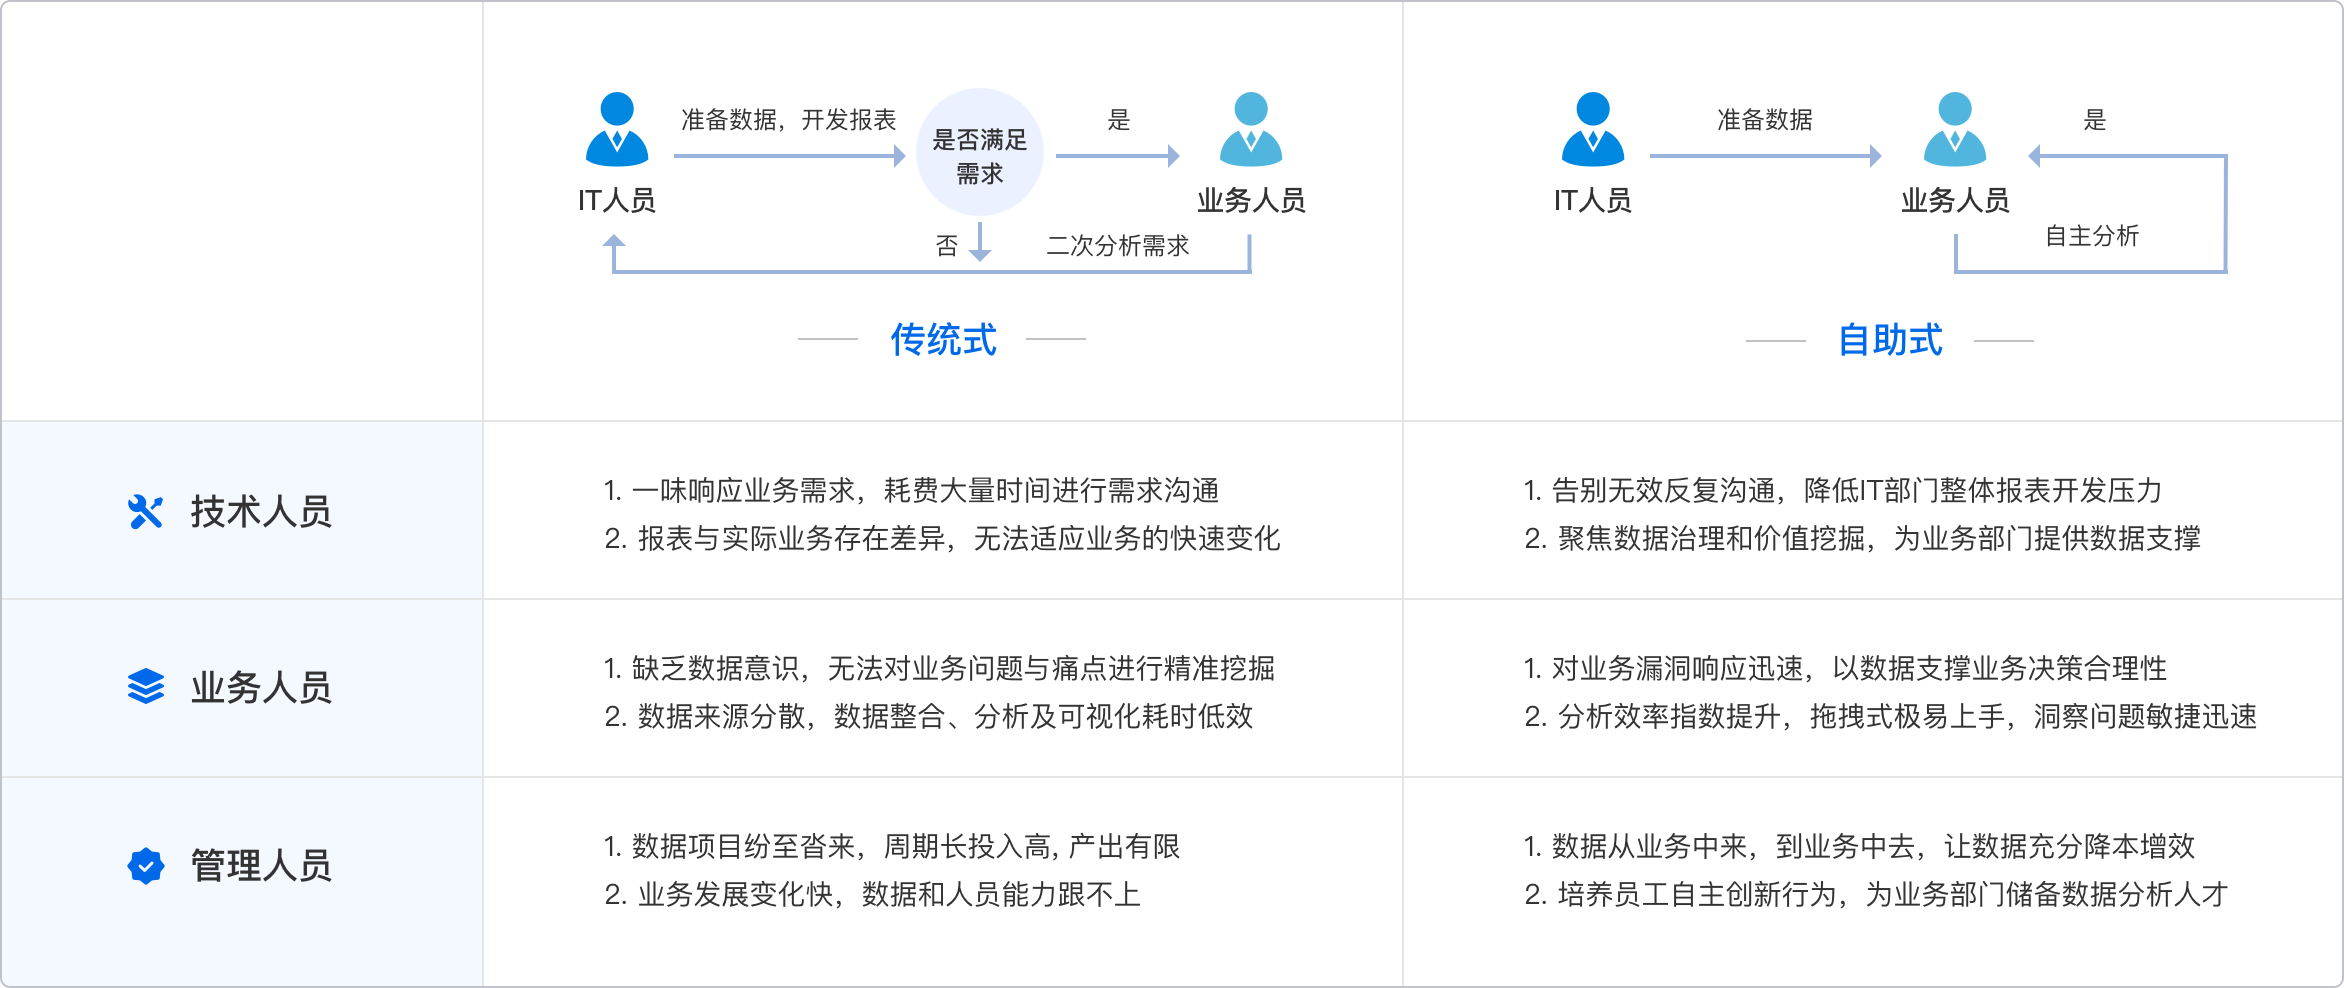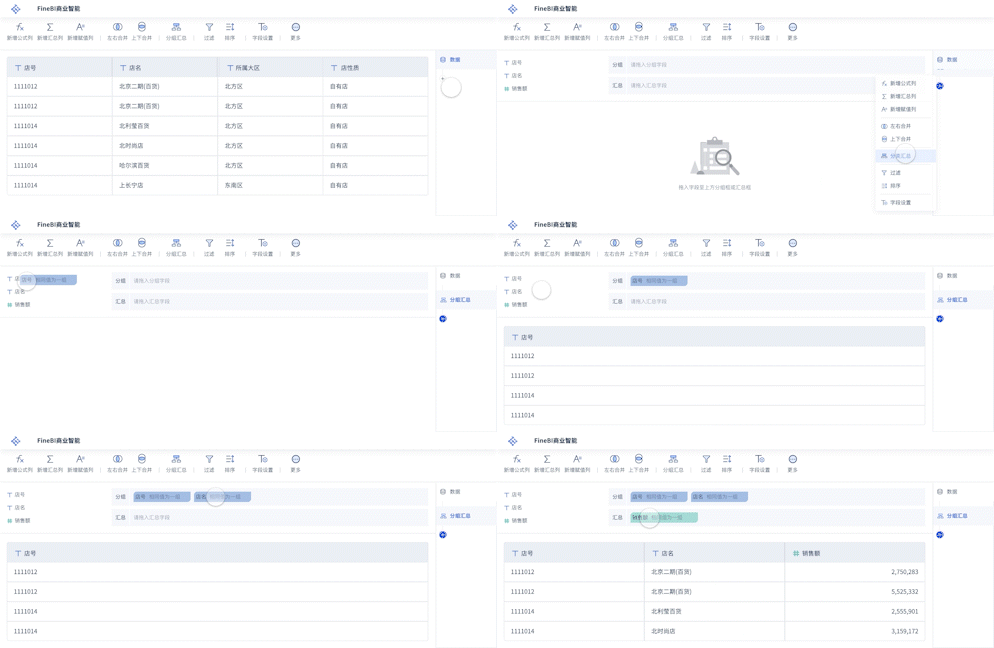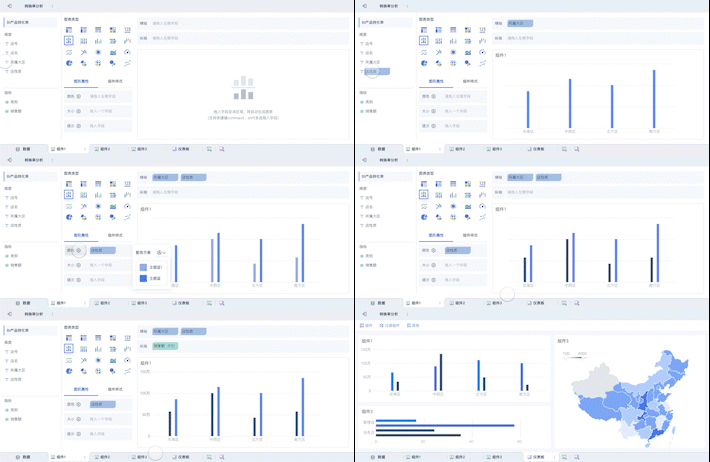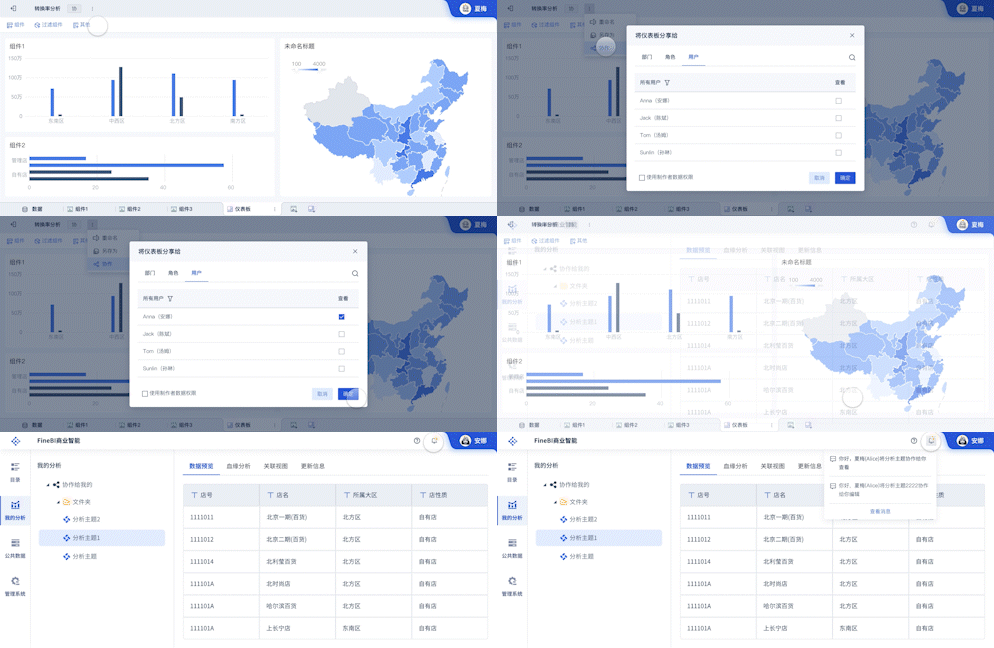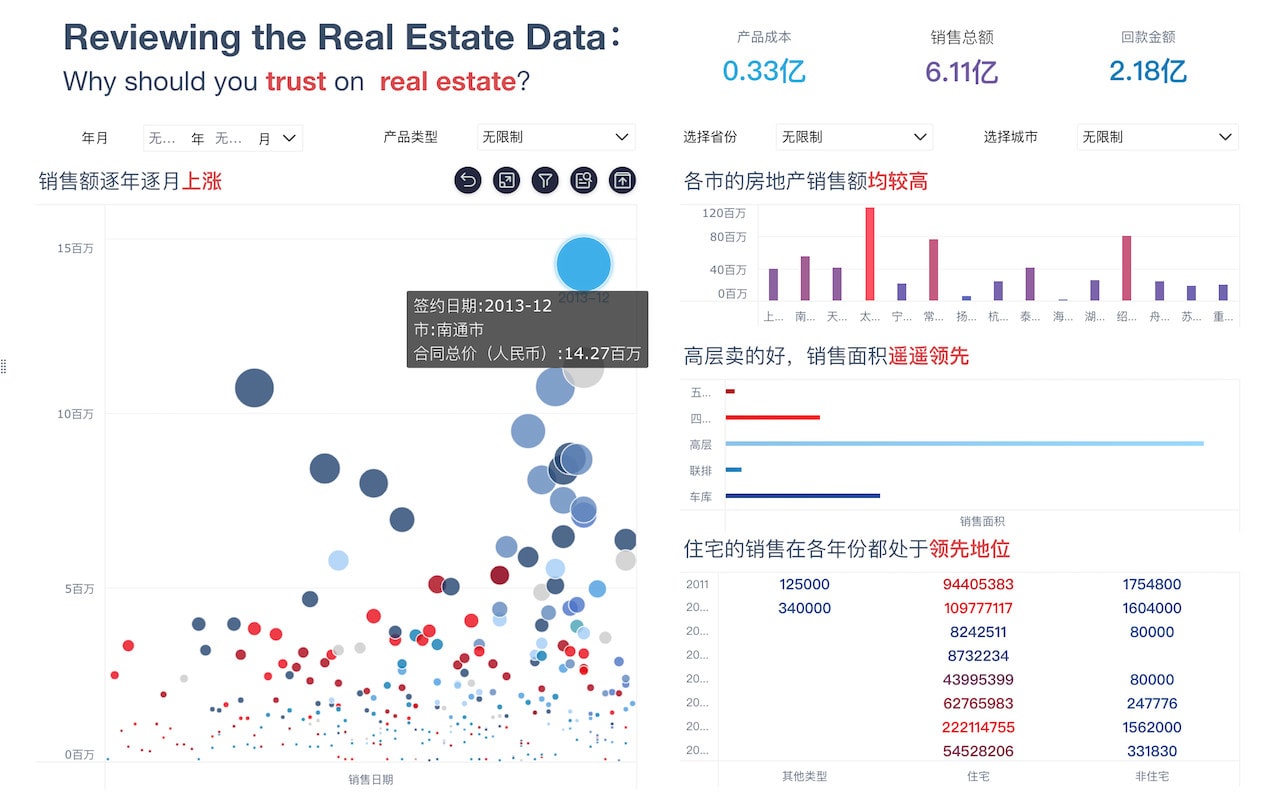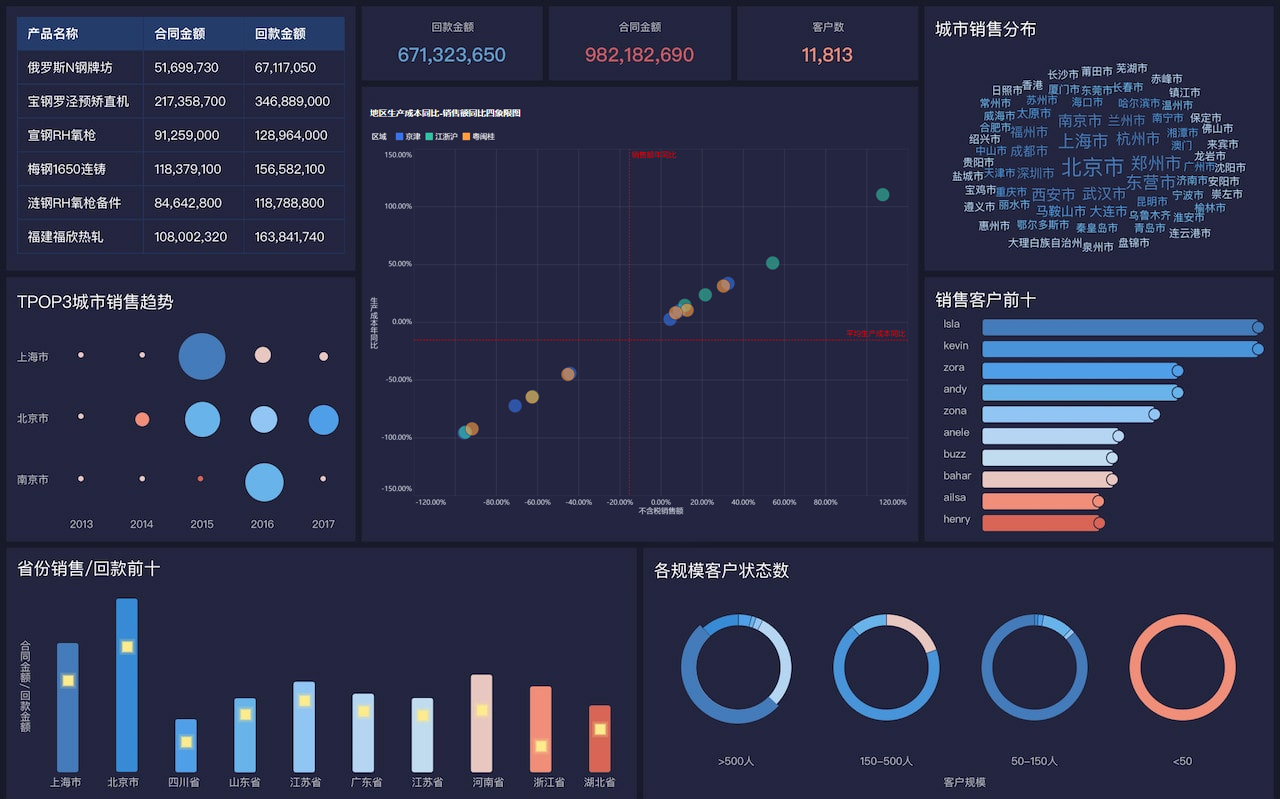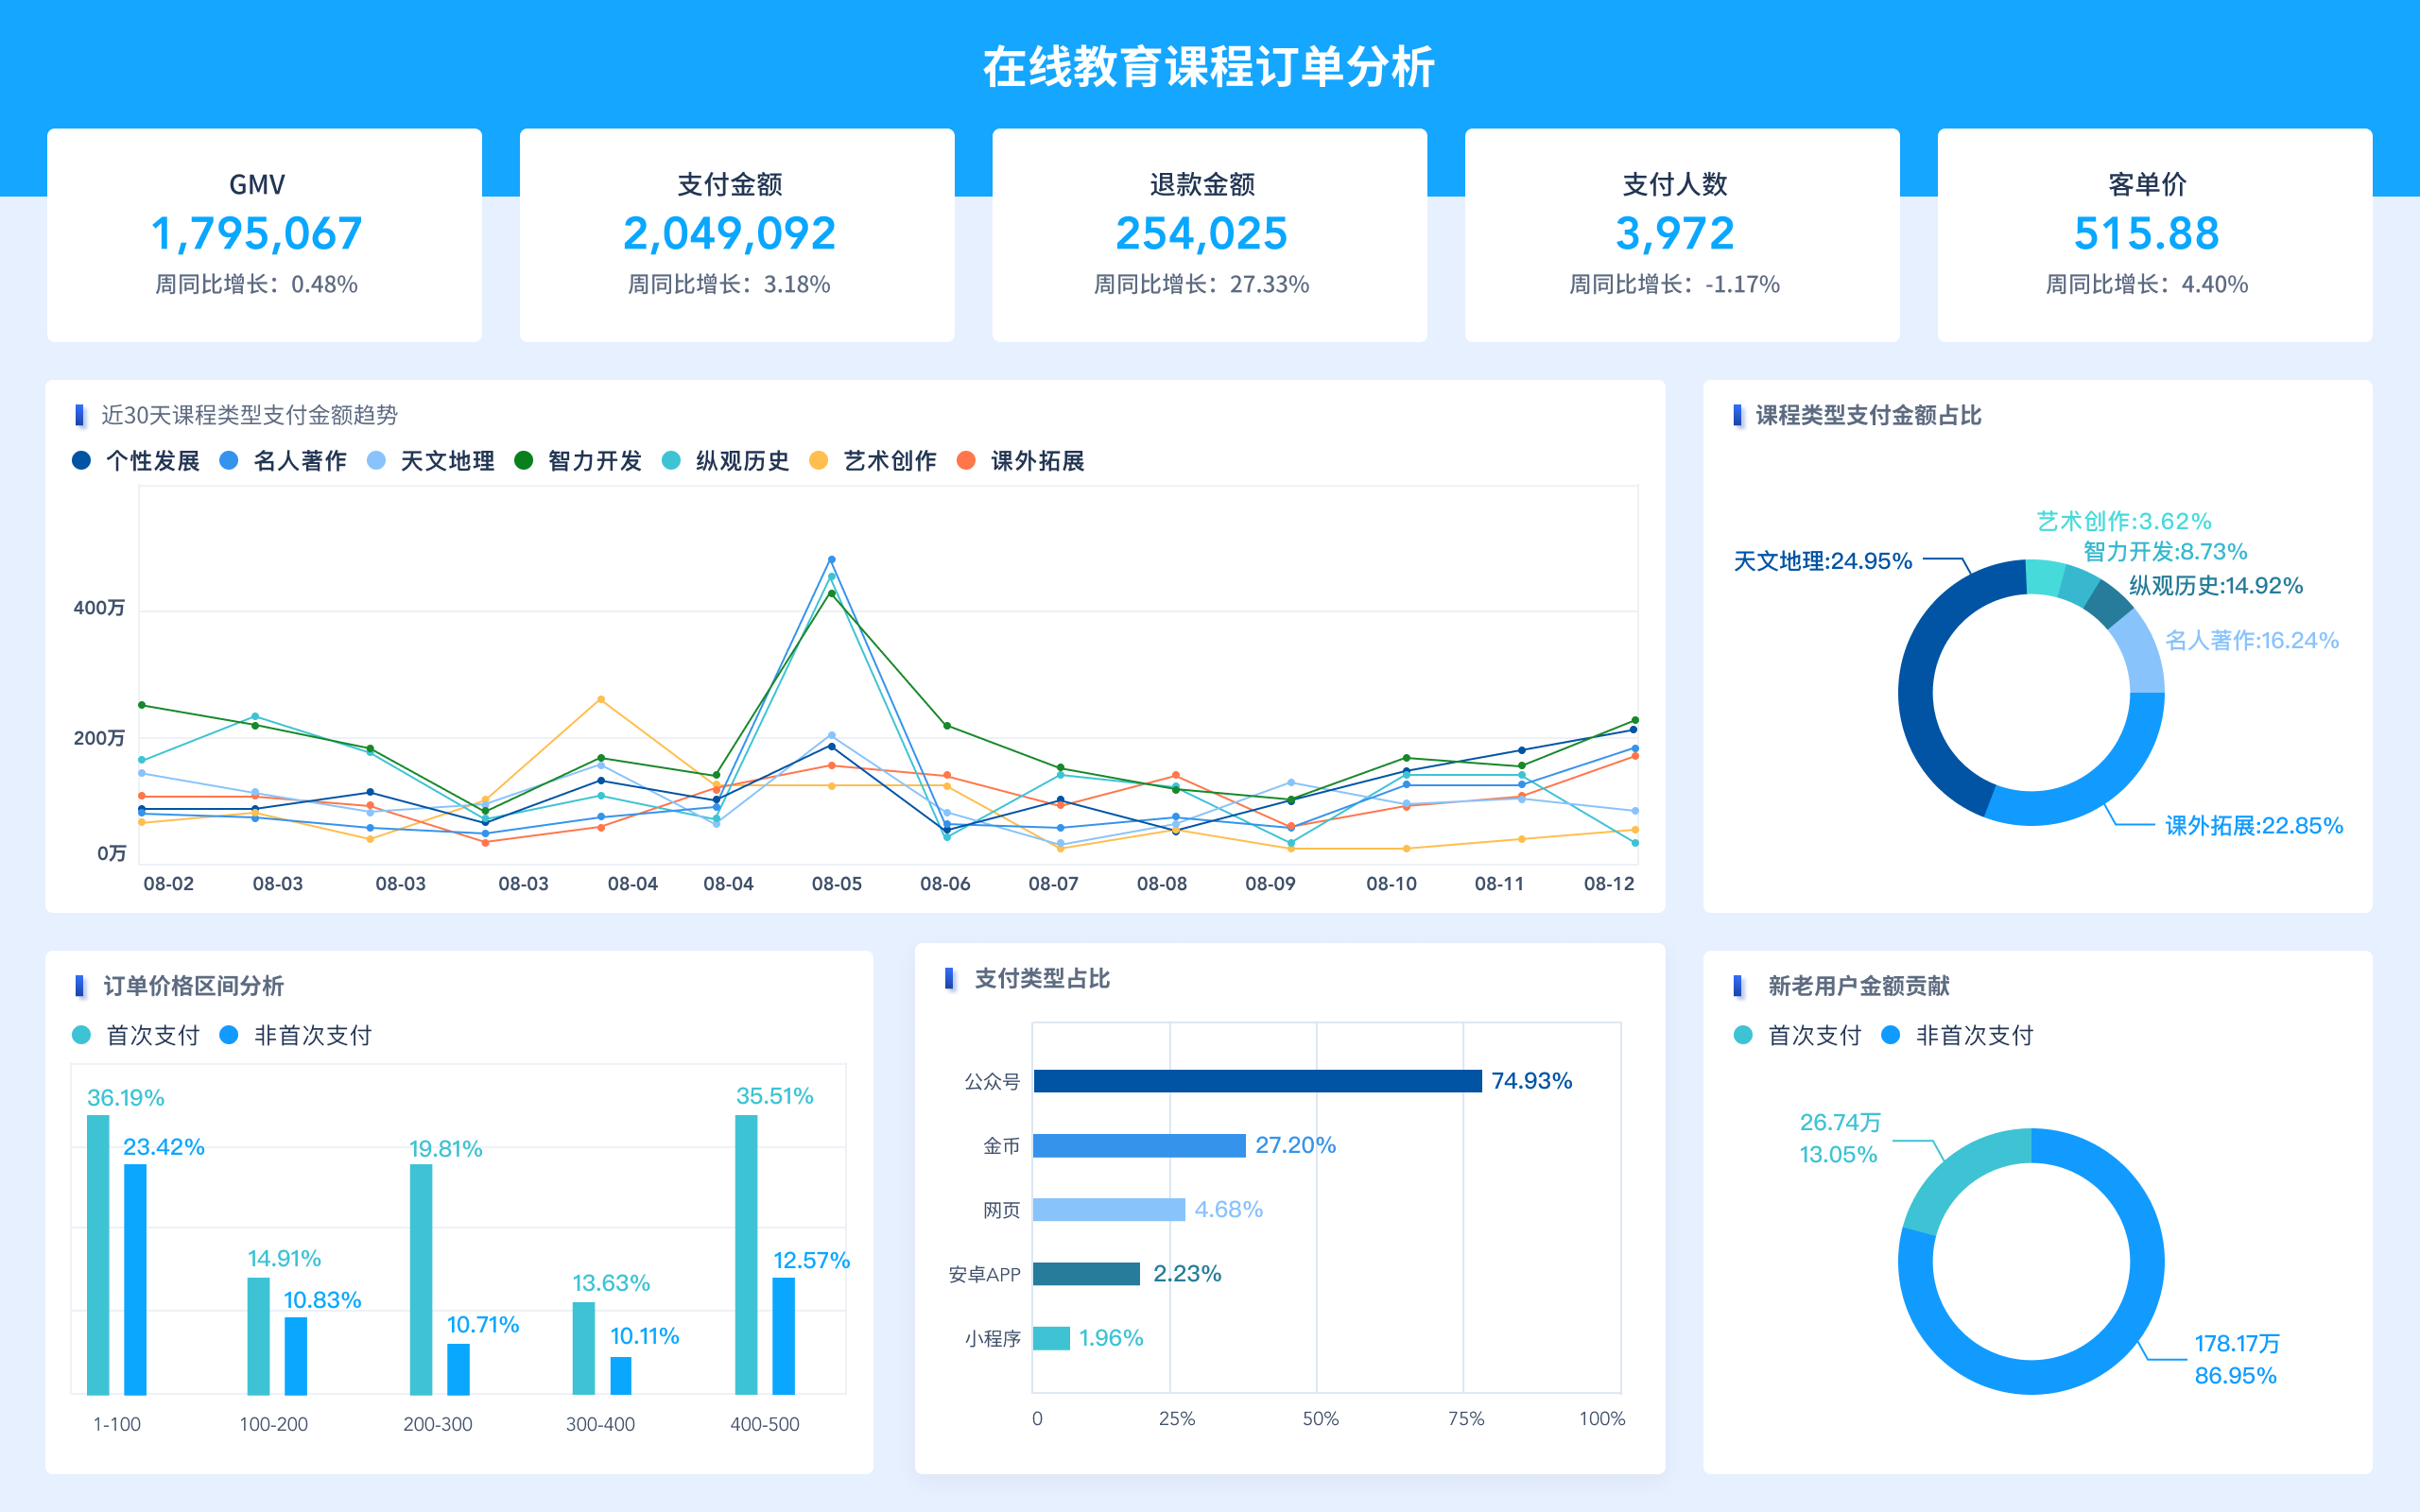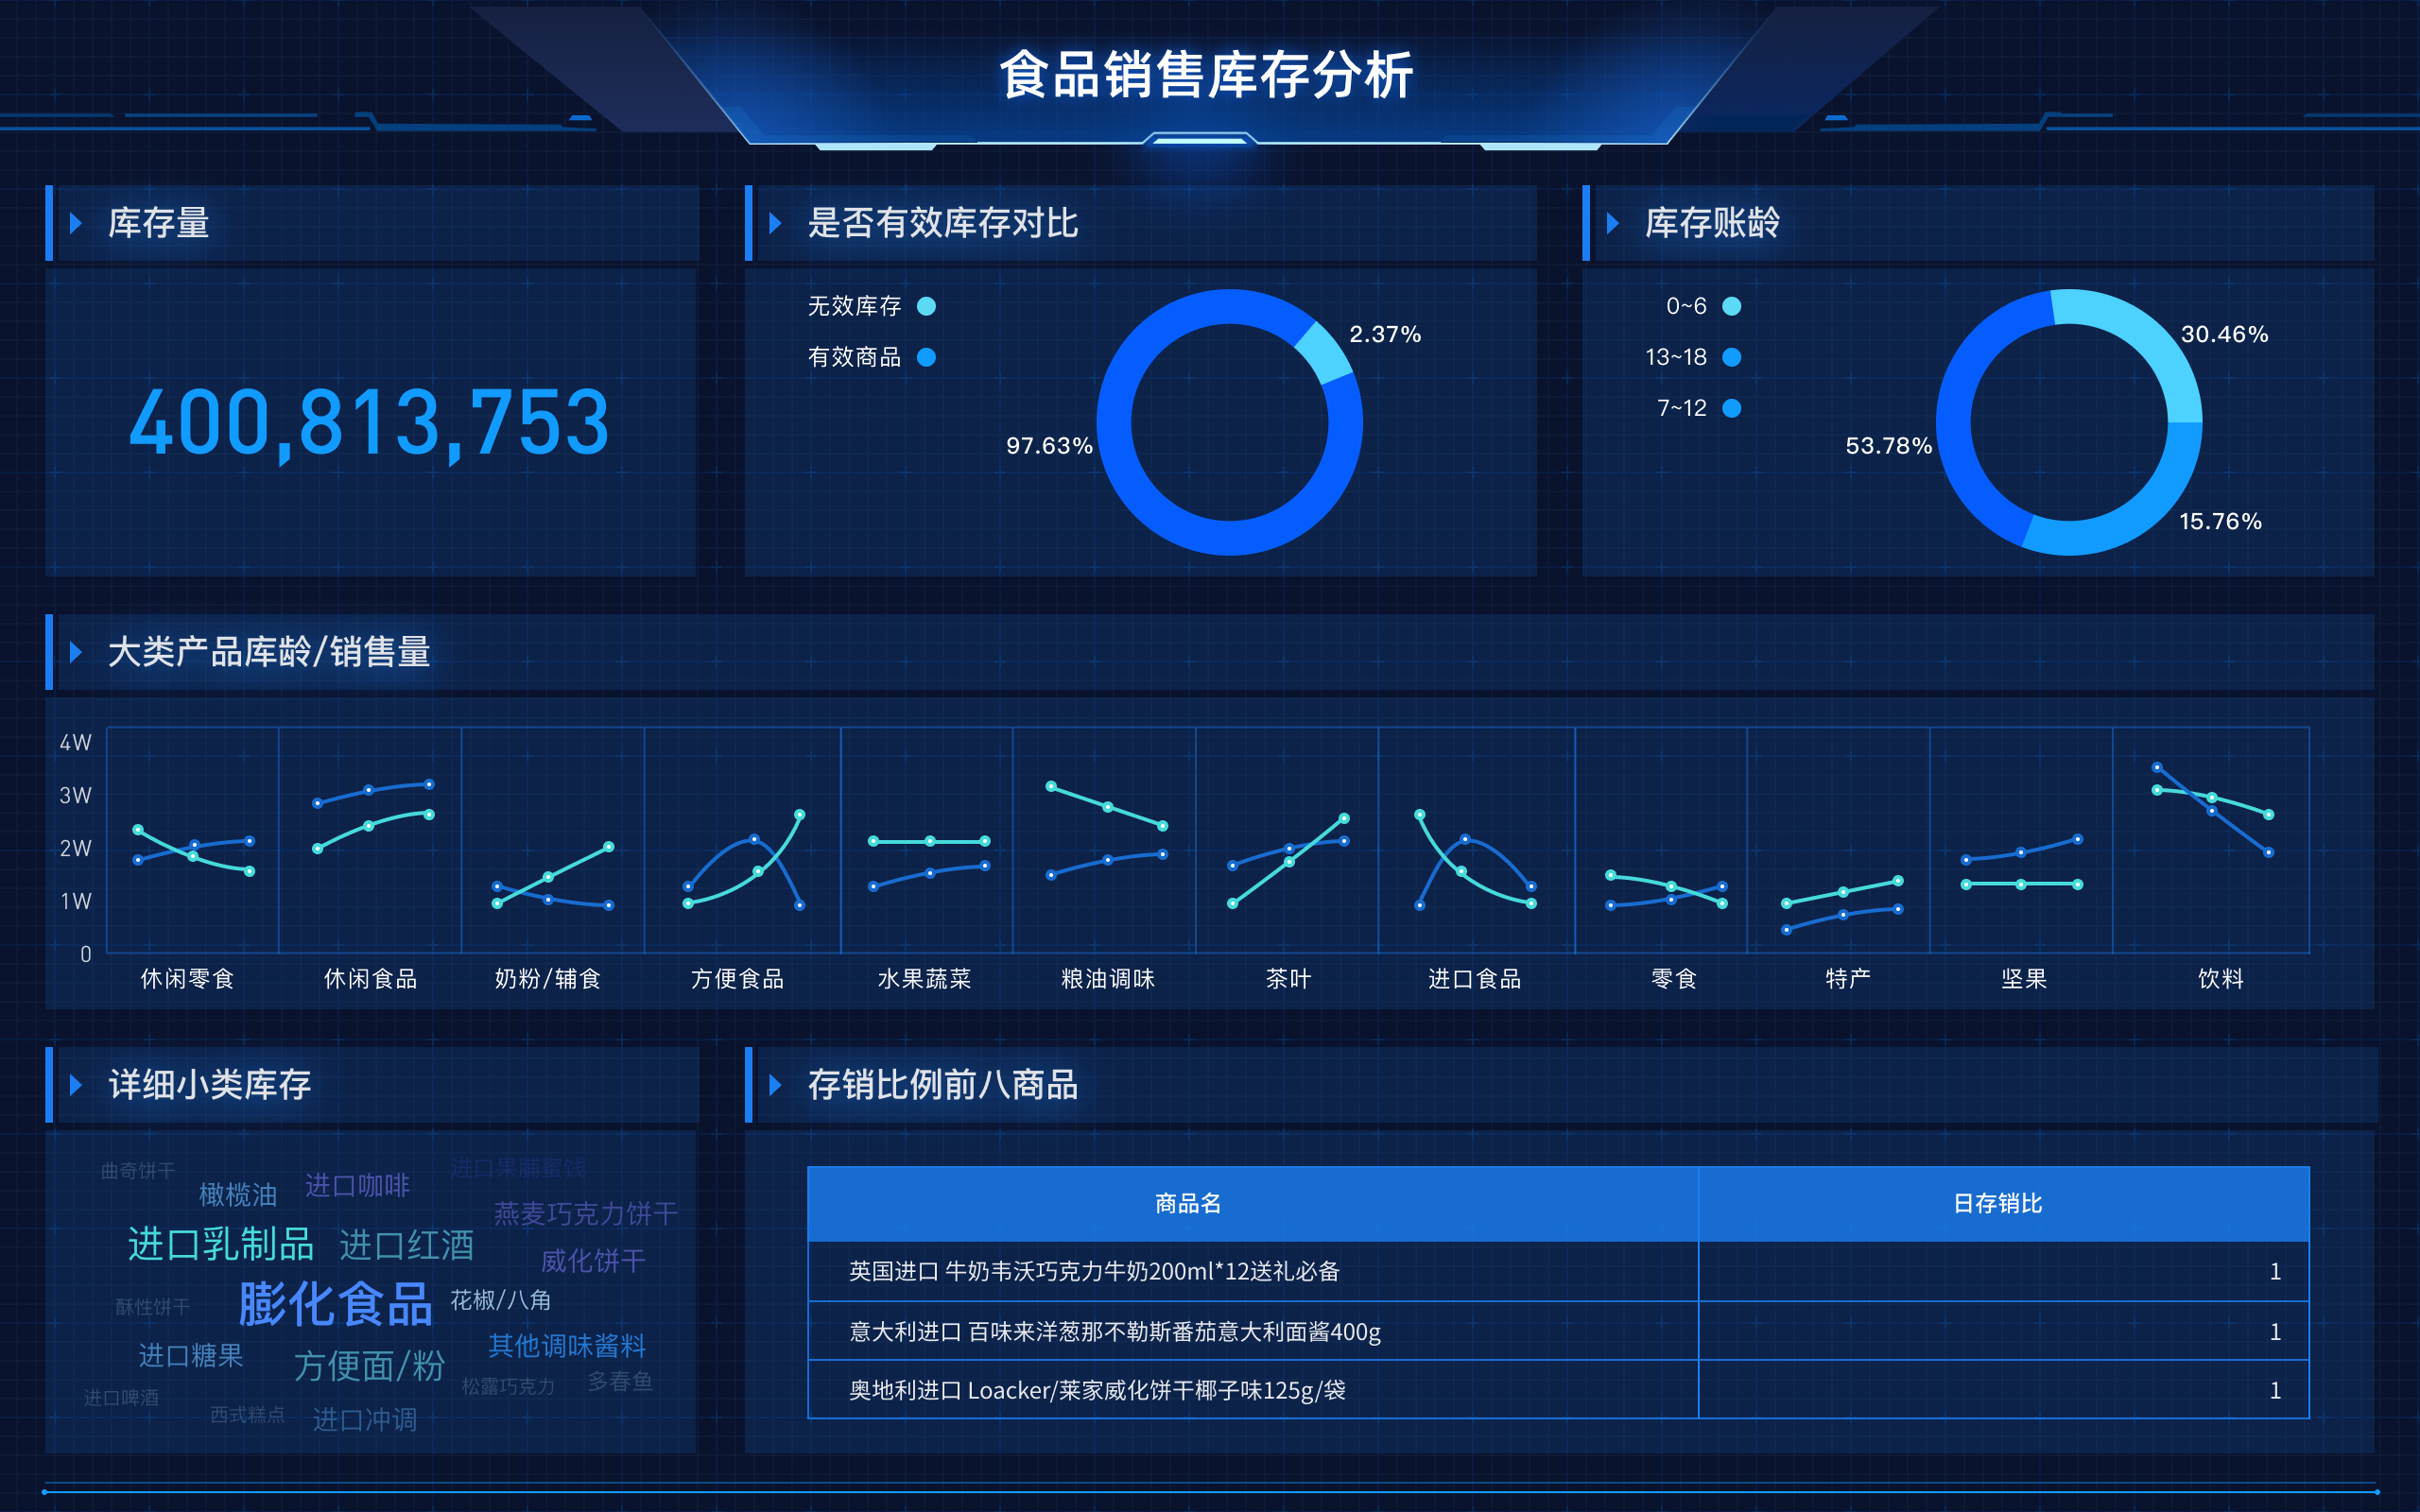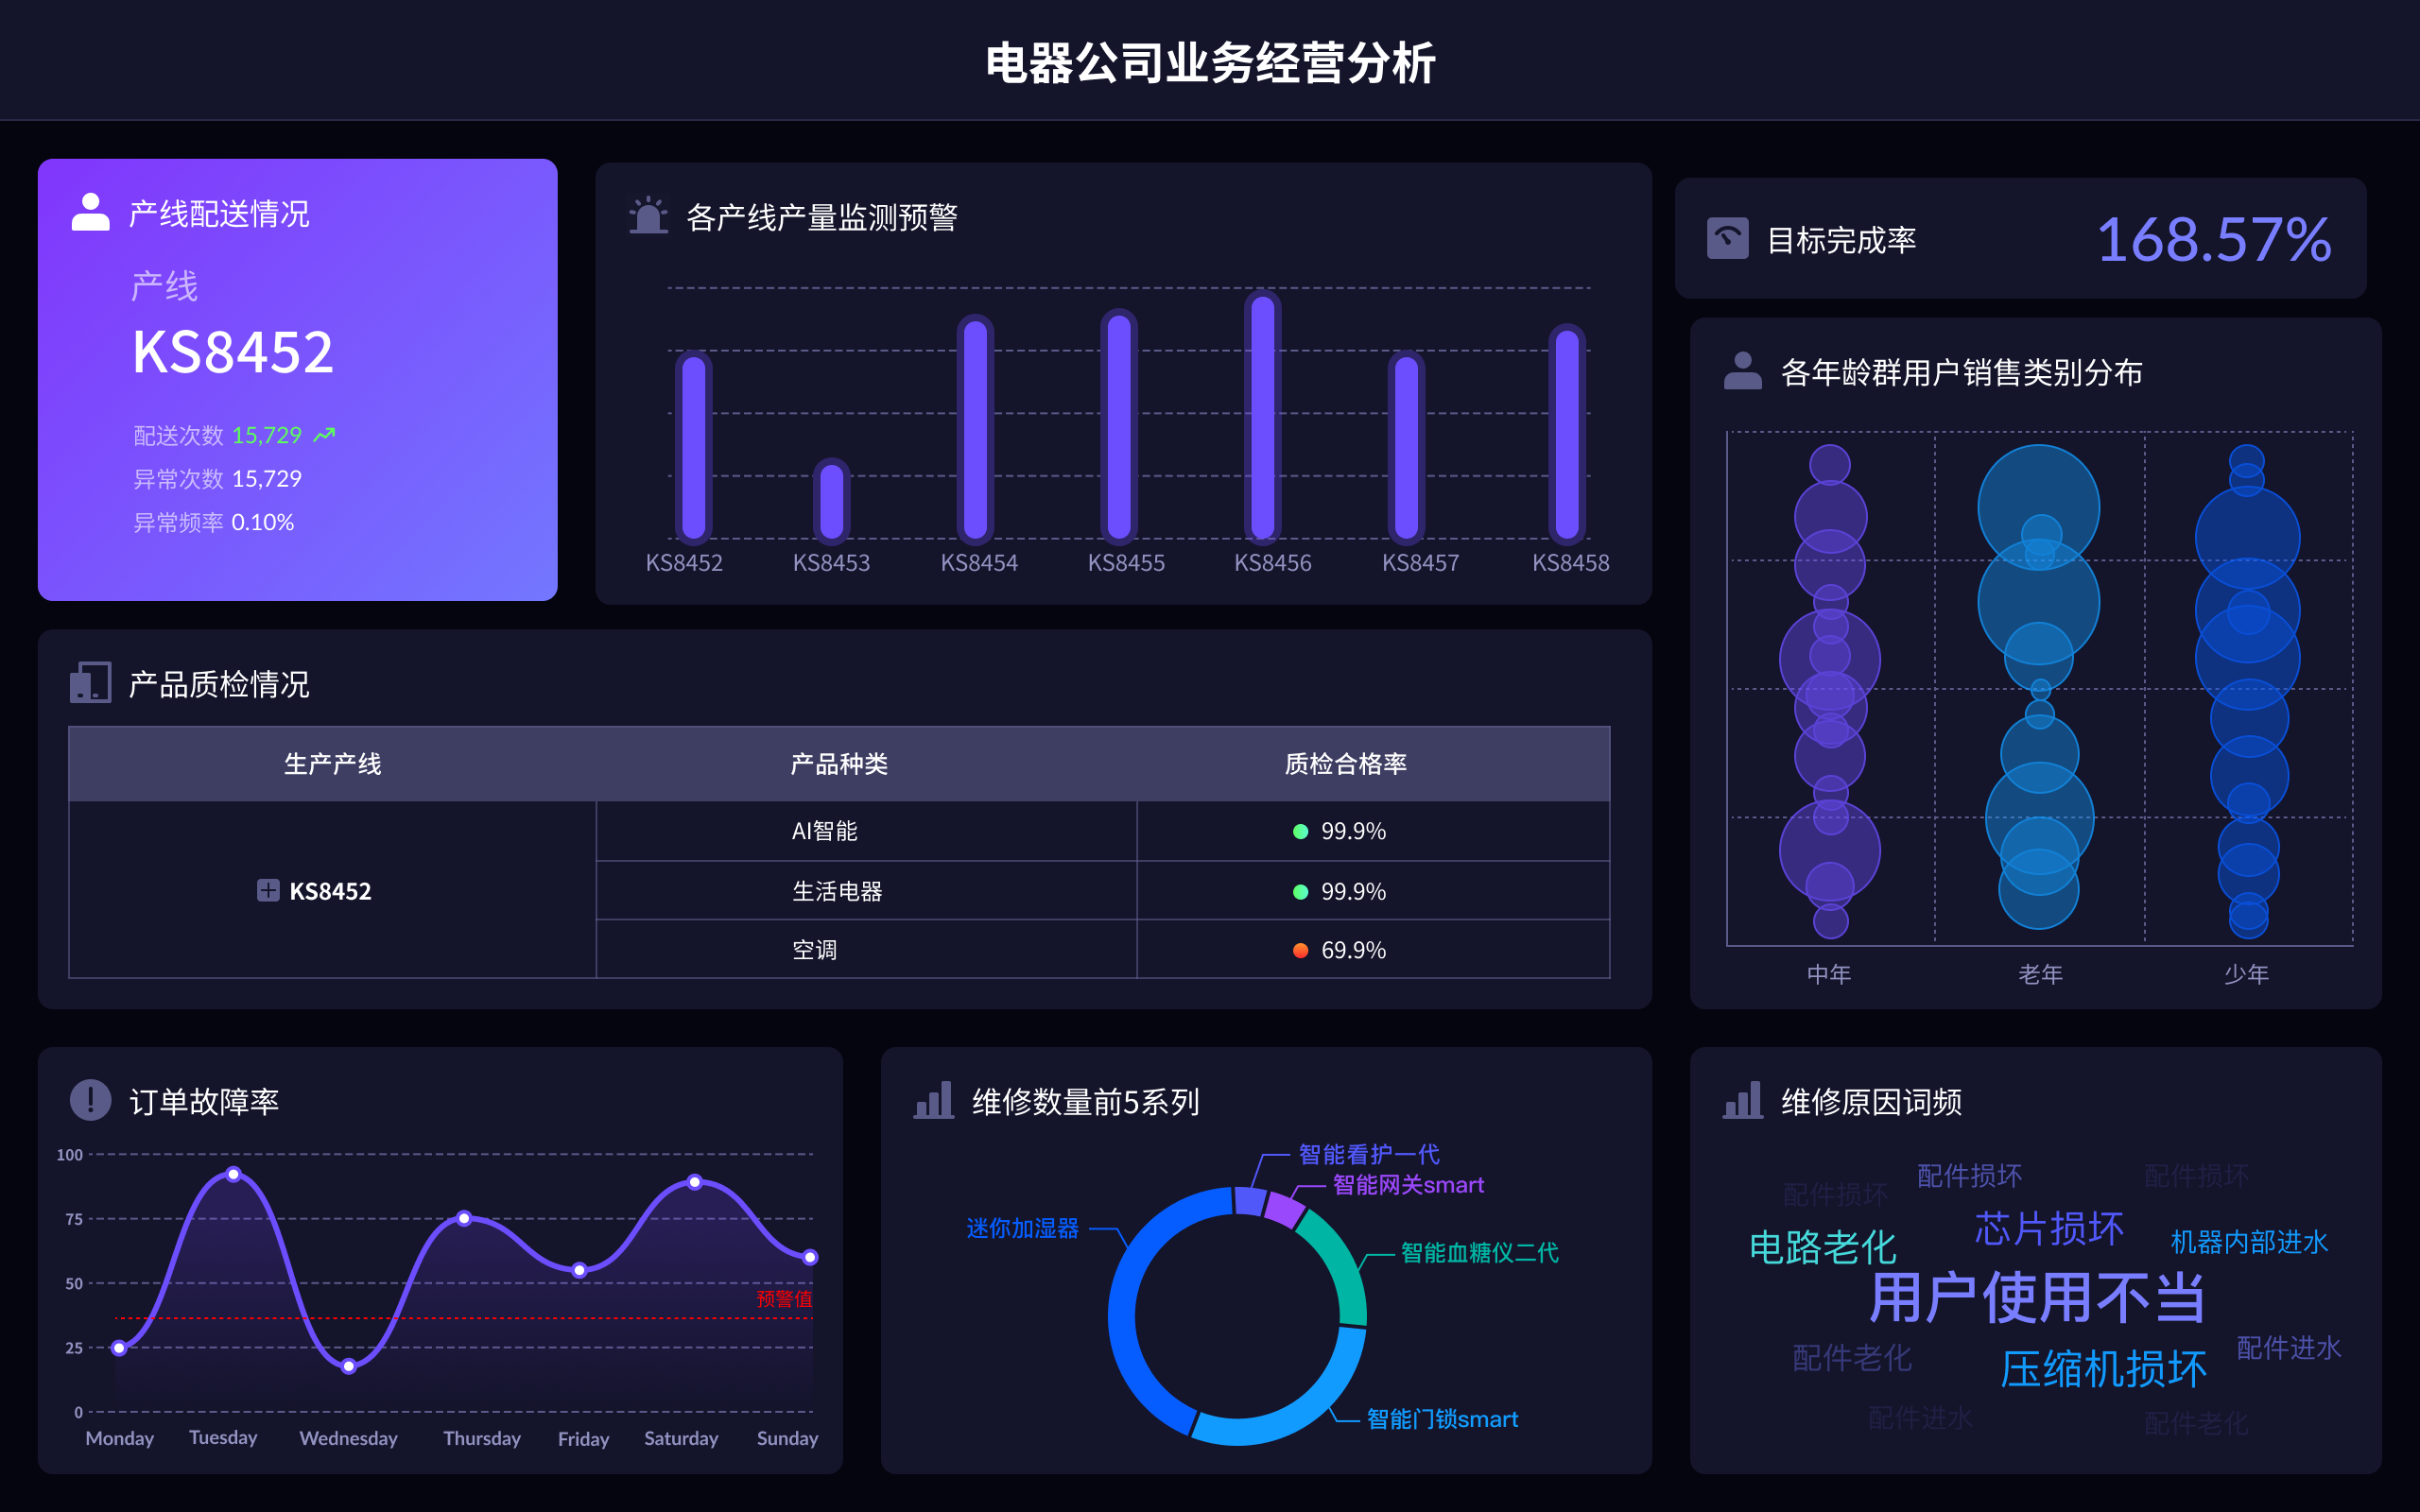
Creating an effective visual dashboard involves a combination of strategic design choices, selection of the right tools, and an understanding of your audience's needs. Key points include: Data Clarity, Interactive Elements, and Performance Optimization. For instance, Data Clarity is crucial as it ensures that the visualizations are easily interpretable, helping users to quickly grasp the key insights without confusion. This involves choosing appropriate chart types, maintaining consistent colors and labeling, and avoiding unnecessary complexity. Below, we delve deeper into these aspects to guide you through setting up a compelling and functional visual dashboard.
一、DATA CLARITY
Data Clarity is essential in any visual dashboard to communicate information effectively. It involves the following practices:
- Chart Selection: Choose the right type of chart to represent your data. For example, line charts are ideal for showing trends over time, while bar charts are great for comparing quantities across different categories.
- Consistent Color Scheme: Use a consistent color palette that aligns with your brand and makes it easy to differentiate between different data points. Avoid using too many colors, as this can overwhelm the viewer and obscure the data's message.
- Clear Labeling and Annotations: Ensure that all axes, legends, and data points are clearly labeled. This helps users understand what they are looking at without needing additional explanations.
FineReport and FineVis, products by FanRuan, are excellent tools for setting up dashboards with a focus on data clarity. They provide intuitive interfaces and a variety of customizable chart options to match your data visualization needs. For more information, you can visit their official websites:
- FineReport: https://s.fanruan.com/ryhzq
- FineVis: https://s.fanruan.com/7z296
二、INTERACTIVE ELEMENTS
Interactivity enhances user engagement and helps in exploring data more deeply. Key interactive features include:
- Drill-Downs: Allow users to click on data points to see more detailed information. This feature is particularly useful in hierarchical data structures, such as sales data broken down by region and then by store.
- Filters and Slicers: Provide tools for users to filter the data according to their needs, such as date ranges, categories, or geographical locations. This makes the dashboard adaptable to various analytical needs.
- Dynamic Updating: Ensure that the dashboard can refresh automatically with new data, keeping the information up-to-date. This is critical for real-time decision-making scenarios.
FineReport and FineVis support these interactive features, making them powerful choices for businesses that require dynamic and engaging dashboards.
三、PERFORMANCE OPTIMIZATION
Performance is a crucial aspect, as slow-loading dashboards can frustrate users and hinder decision-making. To optimize performance, consider the following:
- Data Aggregation: Pre-aggregate data where possible. This reduces the amount of data that needs to be processed and displayed, speeding up the dashboard's response time.
- Efficient Queries: Optimize your data queries to minimize load times. This might involve indexing your databases, using more efficient SQL queries, or caching frequently accessed data.
- Resource Management: Balance the use of resources such as memory and CPU to prevent overloading the system, especially with complex visualizations or large datasets.
FineReport and FineVis are designed with performance in mind, offering features that help streamline data processing and visualization tasks. They also provide comprehensive support for integrating with various data sources, ensuring smooth data flow and efficient rendering of visuals.
四、USER EXPERIENCE AND ACCESSIBILITY
The final key aspect is ensuring that the dashboard is user-friendly and accessible to all potential users, regardless of their technical proficiency. This involves:
- Intuitive Navigation: Design the dashboard with a logical flow, making it easy for users to find the information they need. Use menus, tabs, and clear section headings to organize content.
- Accessibility Features: Incorporate features such as screen reader compatibility, keyboard navigation, and high-contrast color options to make the dashboard accessible to users with disabilities.
- Responsive Design: Ensure that the dashboard is responsive and can be viewed comfortably on different devices, from desktop monitors to mobile phones.
FineReport and FineVis offer various customization options to enhance user experience and accessibility, ensuring that your dashboard can reach a wide audience effectively.
In summary, setting up an English visual dashboard involves focusing on Data Clarity, Interactive Elements, Performance Optimization, and User Experience. By leveraging tools like FineReport and FineVis, you can create dashboards that are not only visually appealing but also highly functional and accessible. For more information and to explore these tools, you can visit their official websites provided above.
相关问答FAQs:
如何设置英文可视化大屏?
在现代企业中,英文可视化大屏已成为展示信息和数据的重要工具。设置一块高效的可视化大屏不仅可以提升信息的传达效率,还能增强观众的参与感和理解力。以下是一些关键步骤和建议,帮助你成功设置英文可视化大屏。
-
选择合适的硬件设备
在设置可视化大屏之前,首先需要选择合适的硬件。这包括显示屏、投影仪或LED屏幕等。选择的设备应符合你的空间需求和预算。大屏幕的尺寸和分辨率也需根据观看距离和观众数量进行考虑。一般来说,较大的屏幕适合于较大的空间,而高分辨率的屏幕则能提供更清晰的图像。 -
选择合适的软件工具
可视化大屏的效果很大程度上取决于所使用的软件工具。许多软件可以帮助你创建动态和互动的内容,如Tableau、Power BI、Google Data Studio等。选择软件时,需考虑其是否支持多种数据源的导入、是否易于使用、以及是否能够创建吸引人的可视化效果。 -
数据收集与整理
在设置可视化大屏之前,需要收集和整理相关的数据。这些数据应准确、全面,并与展示的主题相关。可以使用Excel、数据库或其他工具来整理数据,确保数据的格式一致,并进行必要的清洗和处理。 -
设计可视化内容
设计是可视化大屏成功的关键因素之一。应确保内容简洁明了,避免使用过多的文字和复杂的图表。可以使用图表、地图、图像等多种形式来展示数据,确保信息能够迅速传达给观众。在设计时,还需考虑色彩搭配和字体选择,以提升整体视觉效果。 -
互动性与实时更新
如果条件允许,可以考虑增加大屏的互动性,允许观众参与到展示中来。例如,可以使用触摸屏或移动设备进行互动,以增强观众的参与感。同时,确保数据能够实时更新,以便观众获取最新的信息和数据。 -
测试与调整
在正式展示之前,应进行充分的测试以确保一切正常运行。检查设备连接、软件功能、数据准确性等方面,确保没有技术问题。同时,根据测试反馈进行必要的调整,以提升展示效果。 -
培训与支持
如果有多个用户需要使用可视化大屏,建议提供相关的培训和支持。这可以帮助用户更好地理解如何使用软件工具、如何更新数据以及如何设计可视化内容。通过培训,用户能够更自信地使用大屏,提升整体使用效果。 -
定期评估效果
设置可视化大屏并非一劳永逸,应定期评估其效果。根据观众反馈和数据分析结果,调整展示内容和方式,以确保其始终符合观众的需求和期望。
在设置英文可视化大屏时,有哪些常见的问题?
在设置过程中,可能会遇到一些常见的问题。了解这些问题及其解决方案,可以帮助你更顺利地进行设置和展示。
-
如何选择合适的显示设备?
选择显示设备时需要考虑多个因素,如空间大小、预算、预期的观看距离和观众数量。通常,LED屏幕适合大型场合,投影仪适合灵活的展示环境,而液晶显示屏则适合较小的空间。还需注意设备的分辨率,确保其能够清晰呈现信息。 -
如何保证数据的准确性和实时性?
数据的准确性和实时性至关重要。确保数据来源可靠,定期进行数据审核和更新。可以设置自动数据更新机制,以便实时反映最新信息。此外,应培训相关人员掌握数据处理技巧,以保证数据的有效性。 -
可视化设计有什么原则需要遵循?
在设计可视化内容时,应遵循简洁、易读和一致性的原则。避免使用过于复杂的图表和过多的文字,确保信息能够迅速传达。色彩和字体的选择也应考虑到观众的视觉体验,使用对比强烈的配色和易于阅读的字体,以提升整体效果。
英文可视化大屏的最佳实践有哪些?
为了确保可视化大屏的设置和使用达到最佳效果,可以参考以下最佳实践:
-
从用户需求出发
在设计可视化内容时,应充分考虑目标观众的需求和背景。了解观众的关切点和兴趣,确保展示内容能够引起他们的关注,并能够解答他们的问题。 -
灵活运用多种可视化形式
根据数据的不同特性,灵活运用多种可视化形式,如图表、图像、地图等。通过多样化的展示形式,提升信息的传达效果,使观众能够更好地理解数据。 -
保持内容的更新与新鲜感
定期更新可视化内容,确保其始终保持新鲜感。这不仅能吸引观众的注意力,还能反映最新的业务动态和市场趋势。可以通过数据分析和观众反馈,调整和优化展示内容。 -
重视观众的反馈
在展示过程中,重视观众的反馈和意见,及时进行调整和改进。可以通过问卷调查、现场交流等方式收集反馈,从而更好地满足观众的需求。 -
确保技术支持到位
在展示过程中,确保技术支持人员到位,以便及时解决可能出现的技术问题。提前进行设备调试和测试,可以最大程度地减少展示中的技术故障。
通过以上的建议和最佳实践,能够有效地设置和使用英文可视化大屏,提升信息传达效果,增强观众的体验与参与感。
本文内容通过AI工具匹配关键字智能整合而成,仅供参考,帆软不对内容的真实、准确或完整作任何形式的承诺。具体产品功能请以帆软官方帮助文档为准,或联系您的对接销售进行咨询。如有其他问题,您可以通过联系blog@fanruan.com进行反馈,帆软收到您的反馈后将及时答复和处理。


