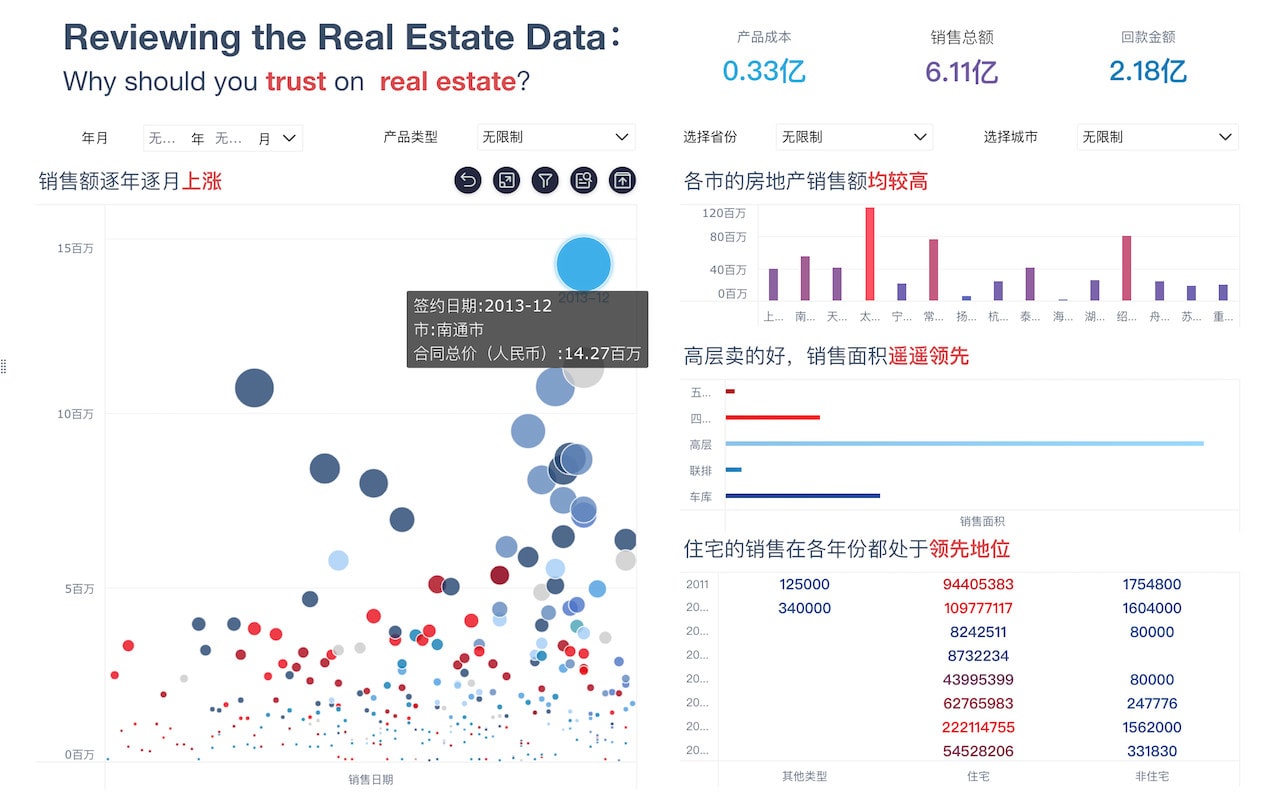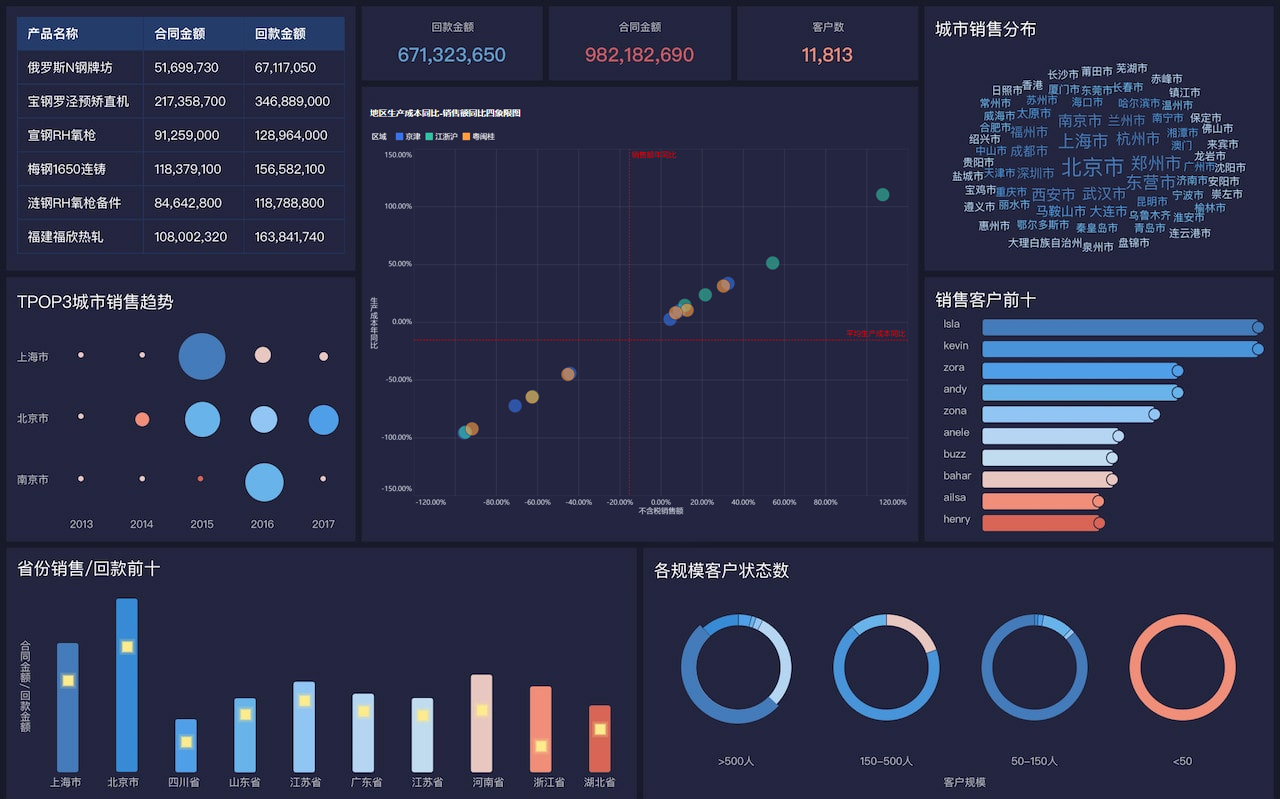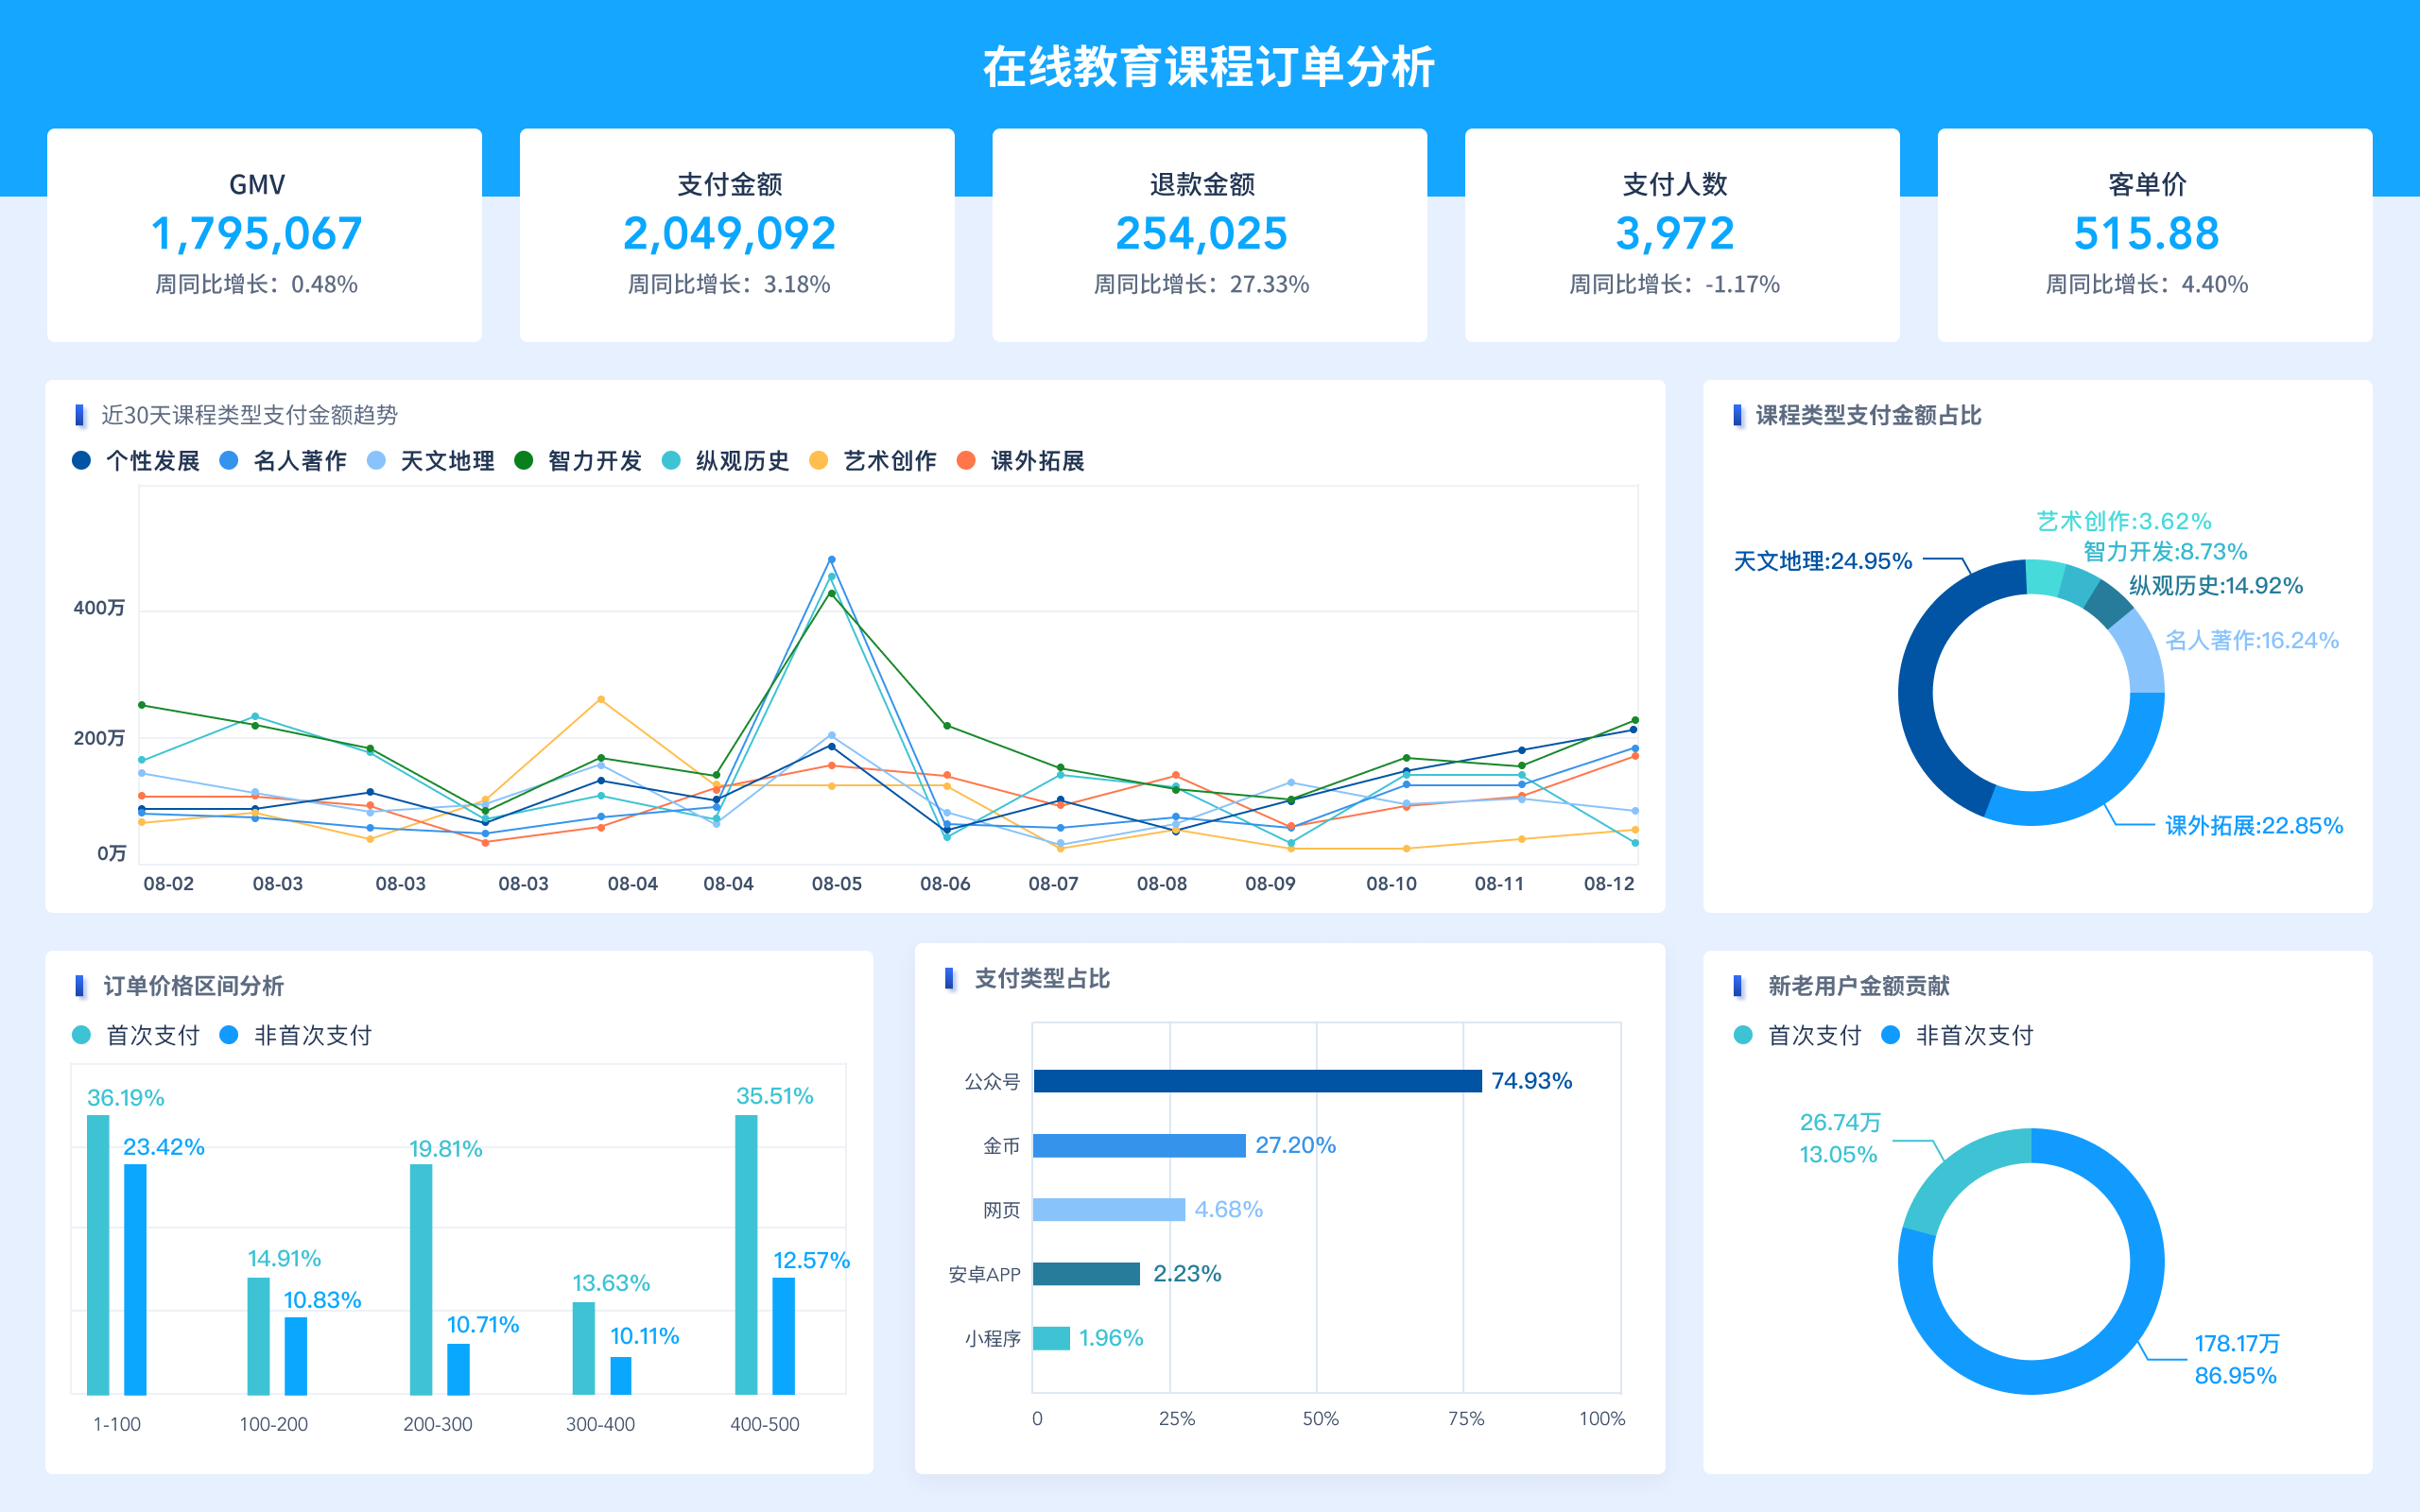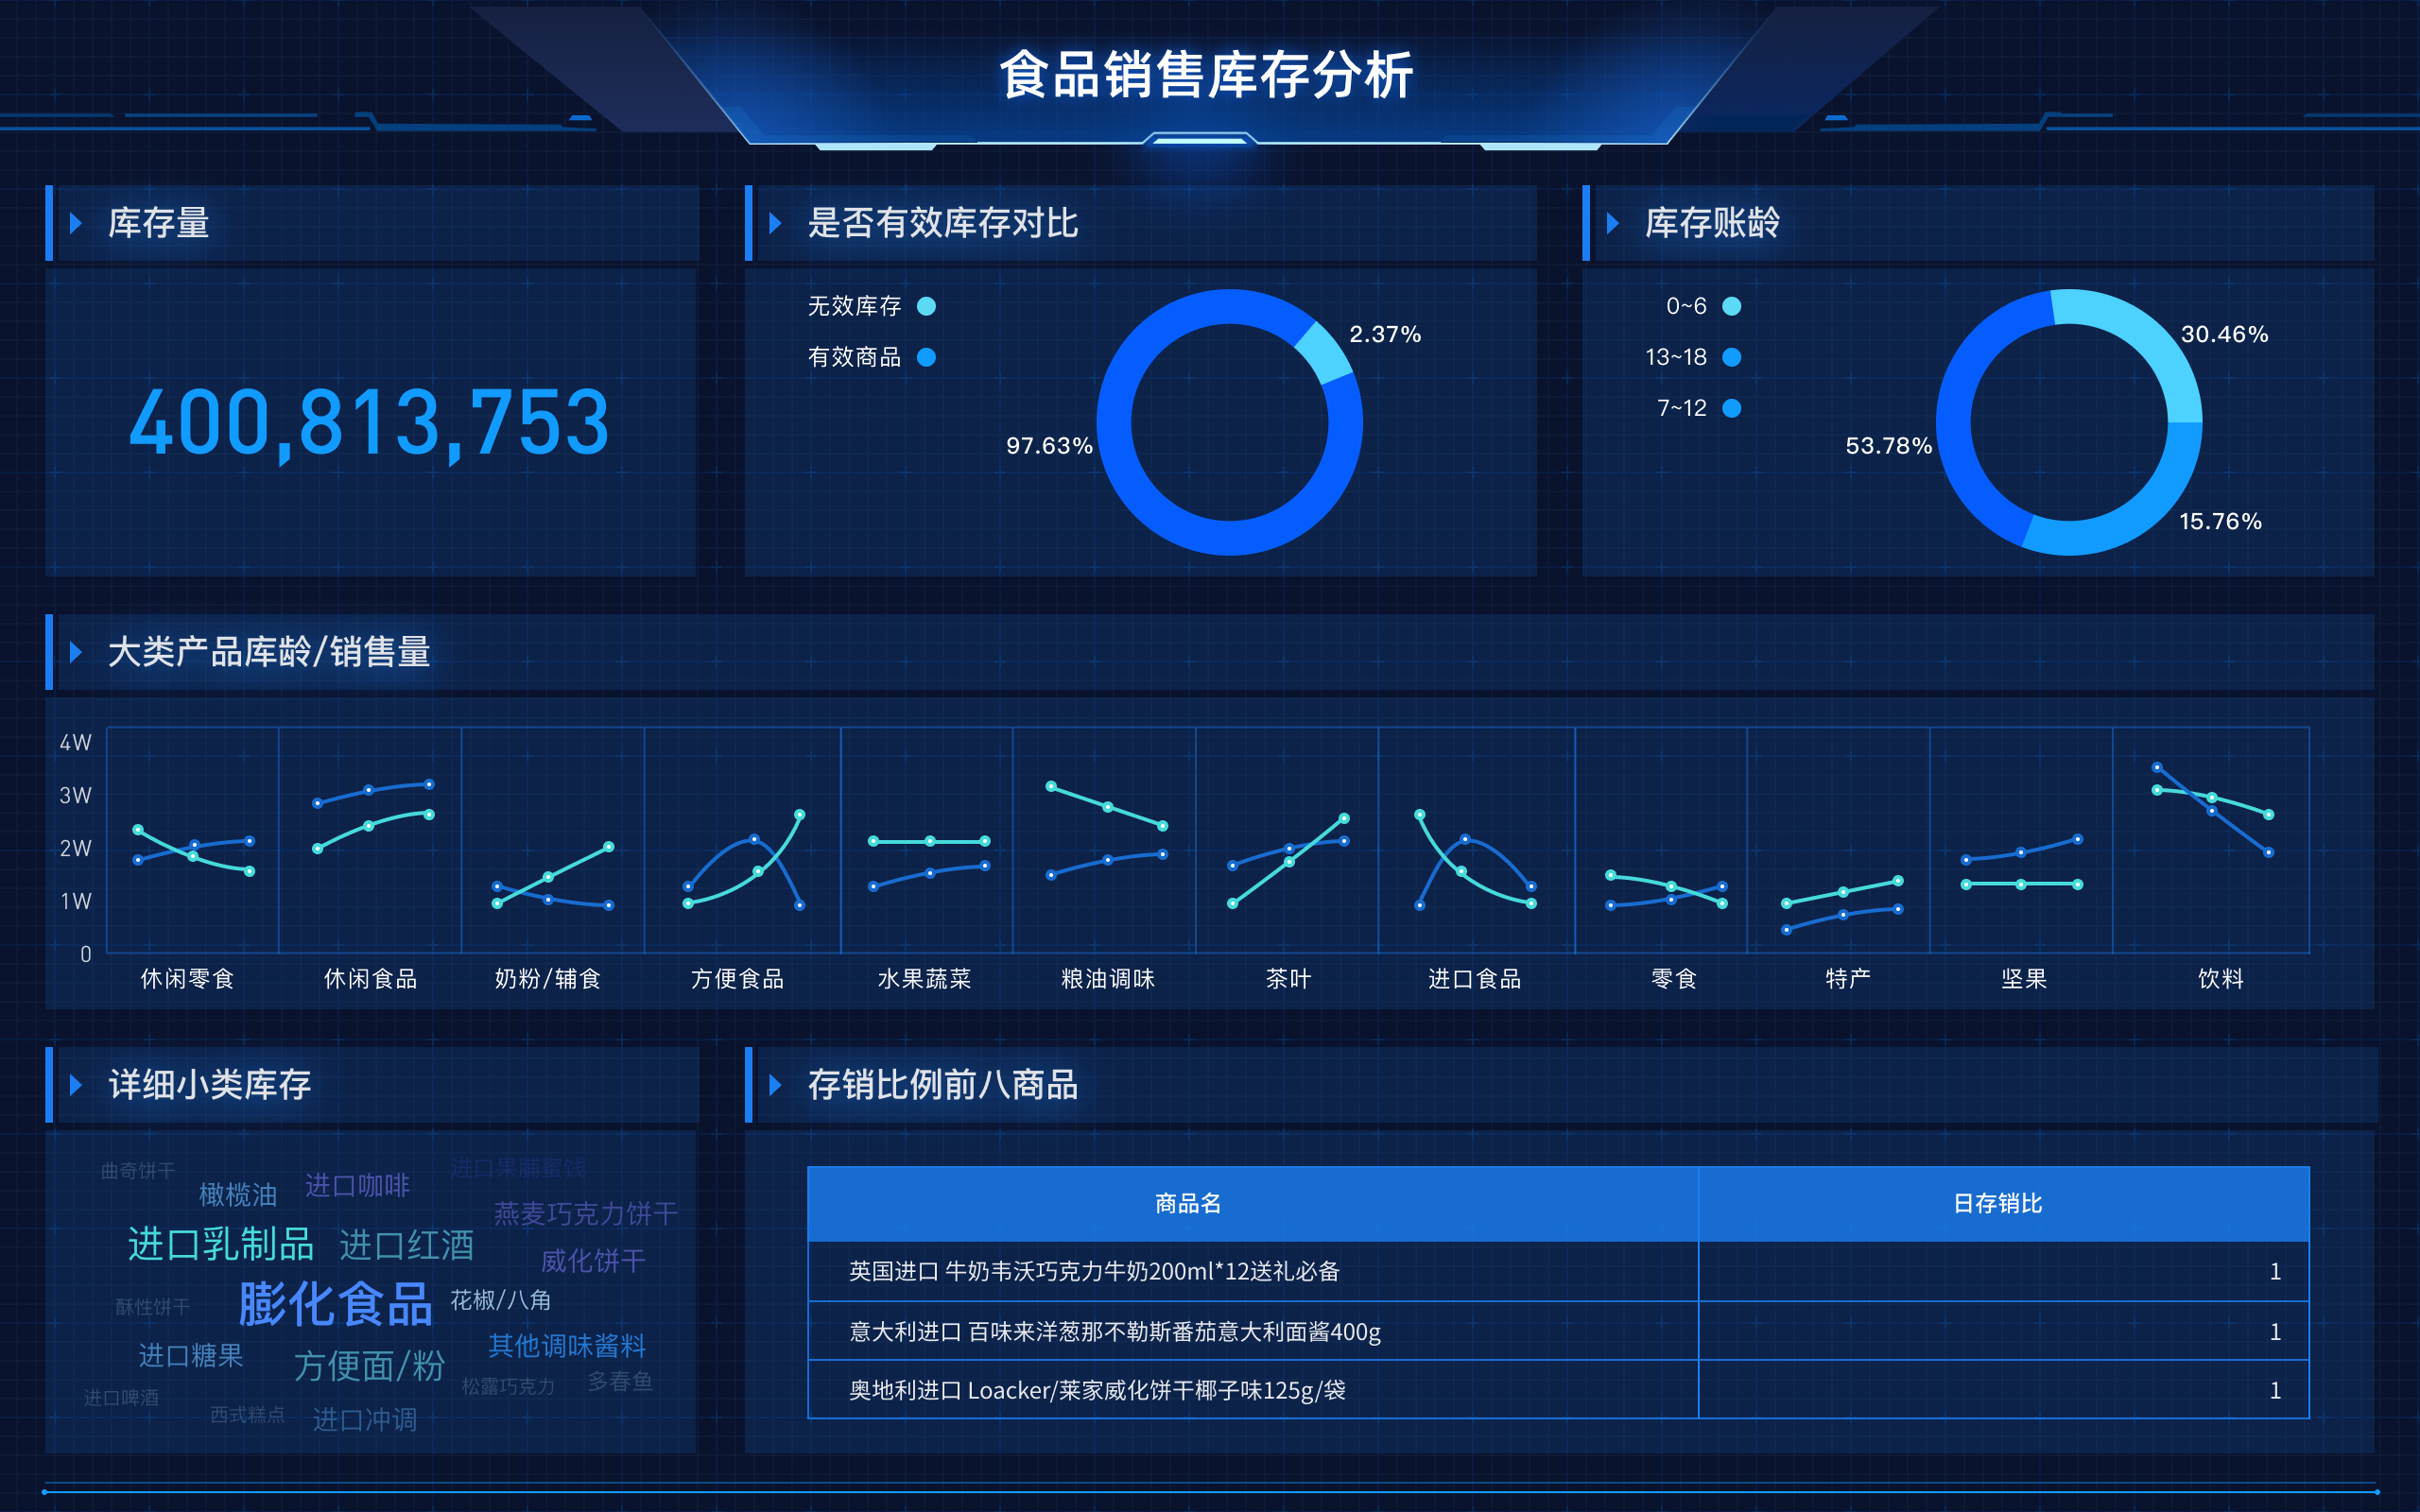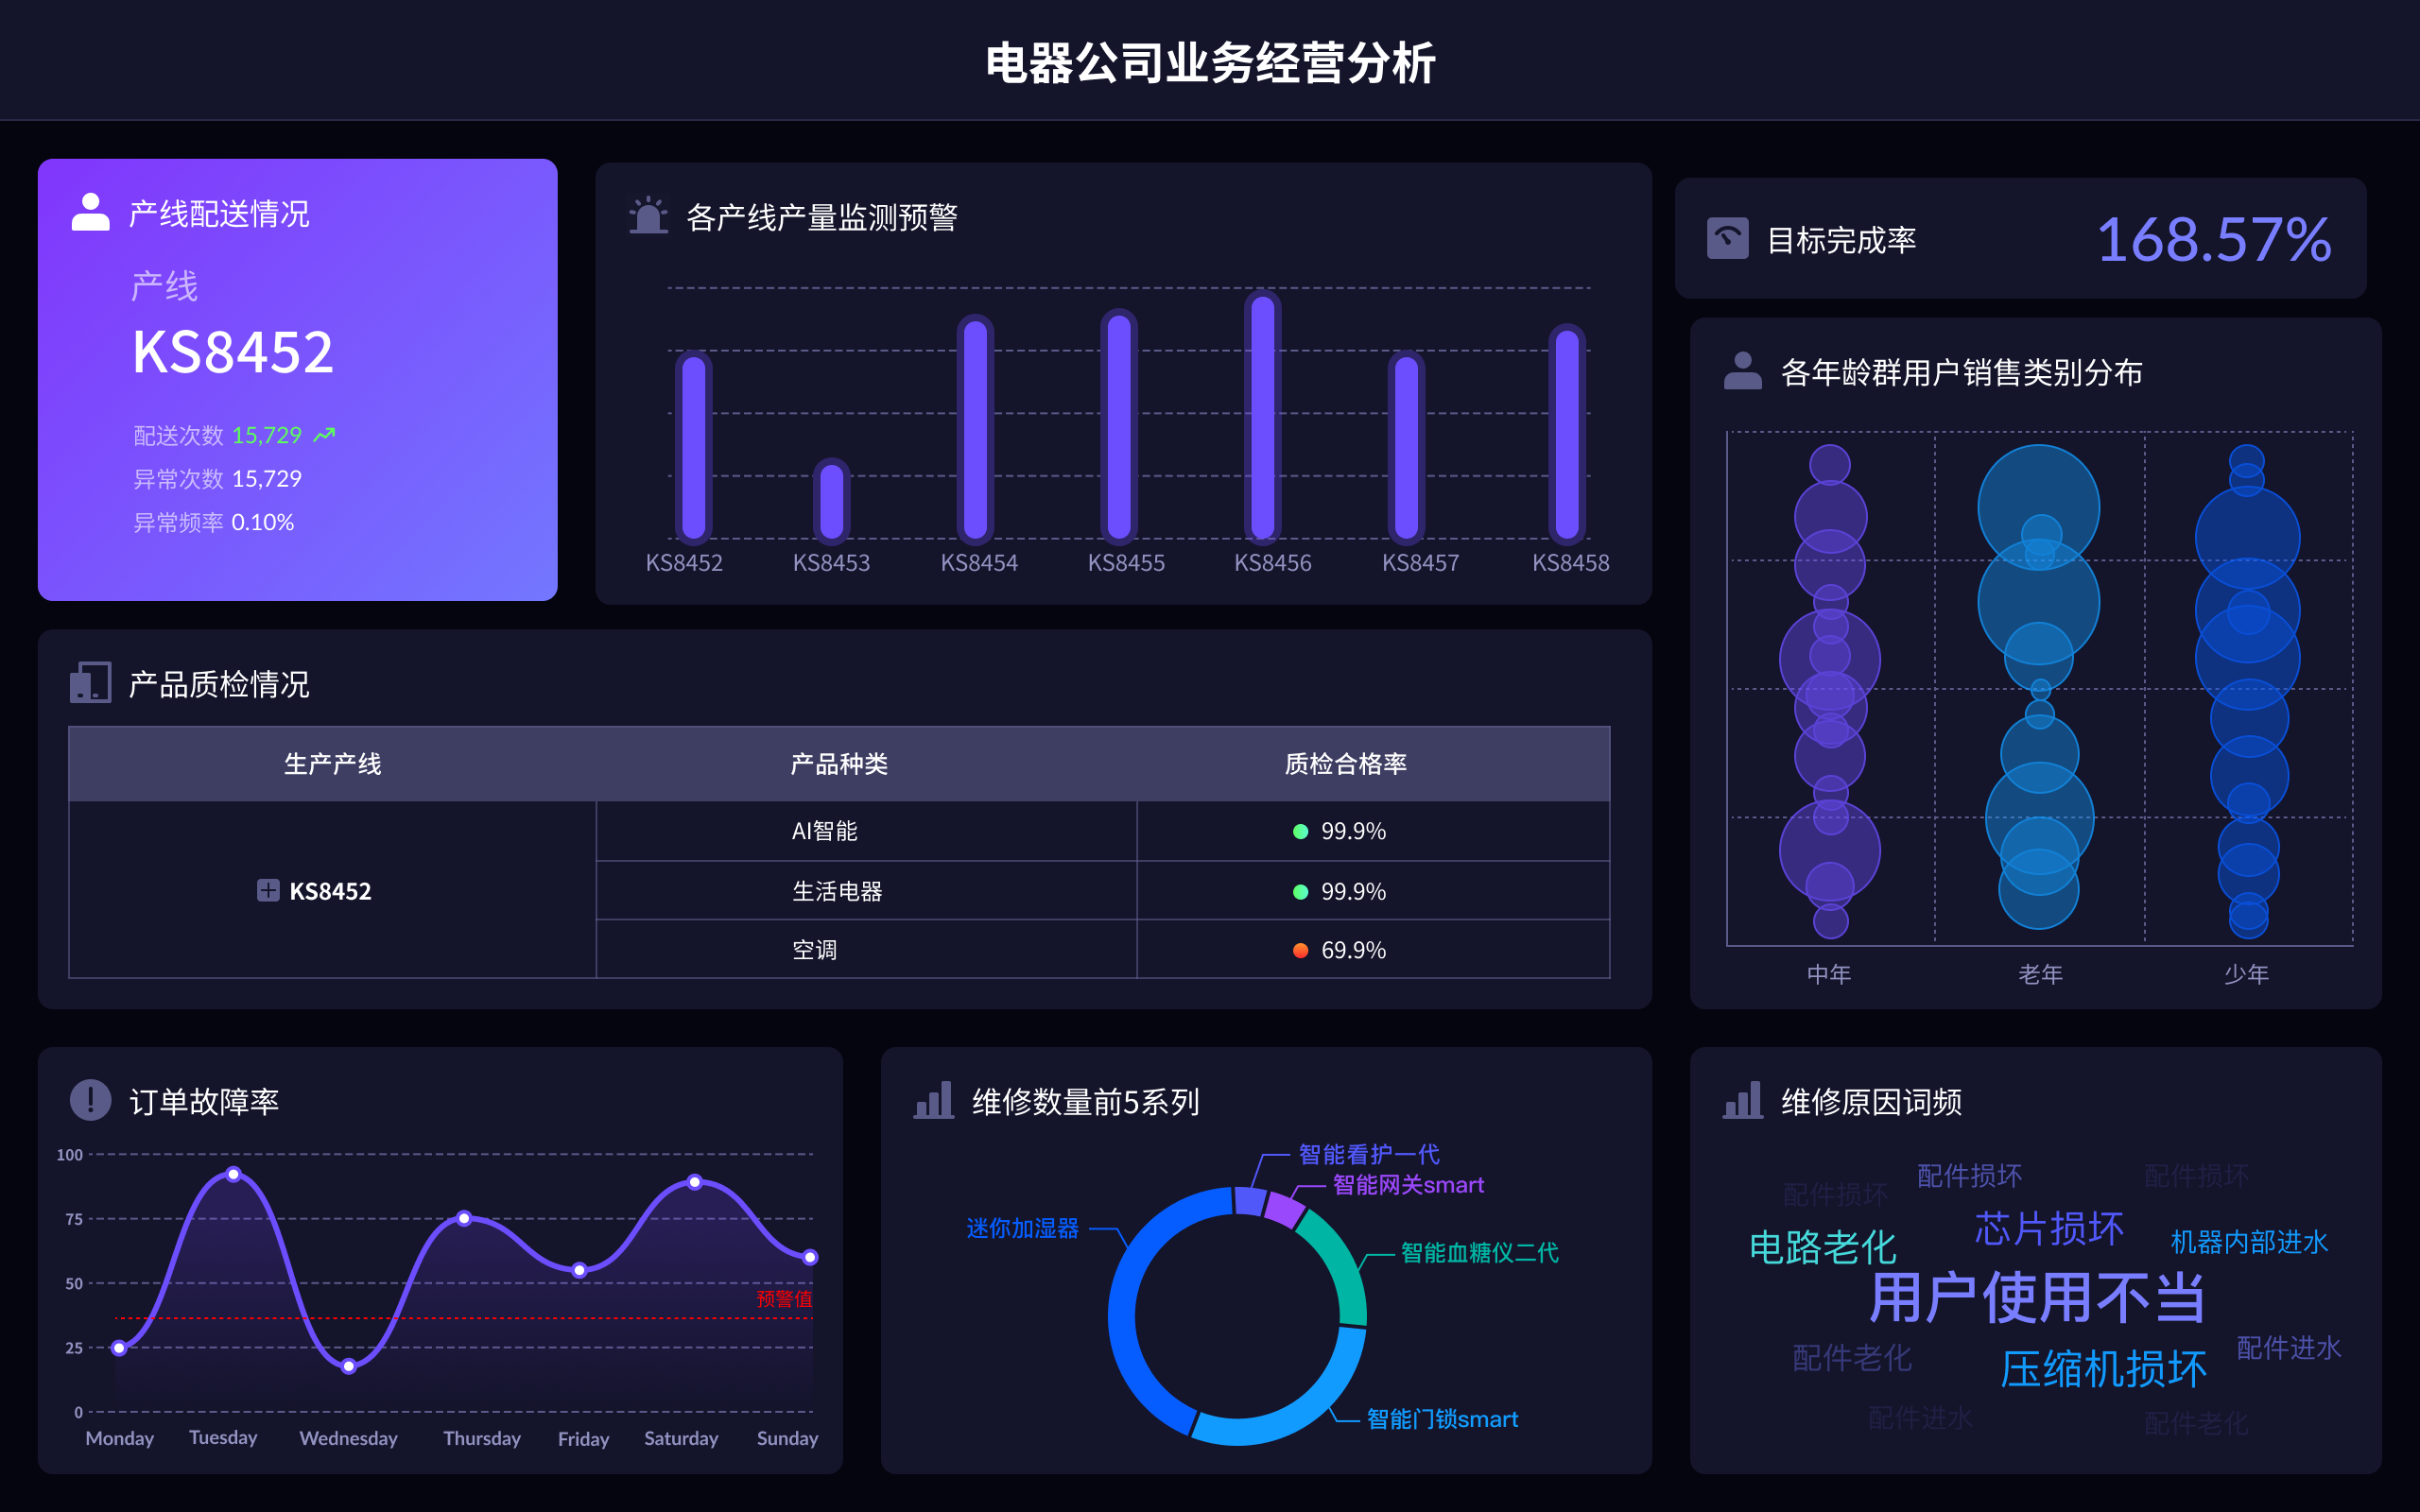
The term "可视化大屏" in English is "visualization dashboard" or "large screen visualization."
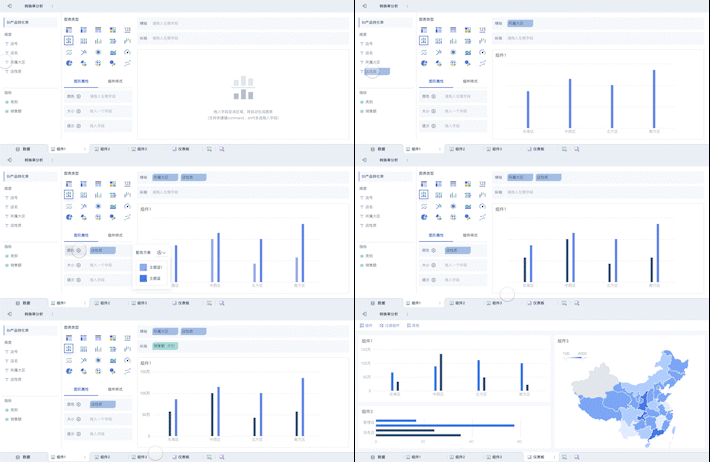
A visualization dashboard typically refers to a user interface that organizes and presents information in an easy-to-read, visual format on a large screen. This is often used in business intelligence, data analysis, and monitoring applications to display key performance indicators, metrics, and data trends in real time. These dashboards can integrate various data sources and provide interactive elements, allowing users to drill down into specific data points or customize the view based on their needs. The large screen aspect enhances visibility and accessibility, making it ideal for command centers, conference rooms, or any environment where data needs to be shared and analyzed by a group.
For example, in a corporate setting, a visualization dashboard might display sales performance metrics, customer feedback trends, and operational efficiencies, all on a large screen in the office for the entire team to monitor and discuss. This real-time data visualization aids in quick decision-making and strategic planning.
相关问答FAQs:
What is the English term for "可视化大屏"?
The English term for "可视化大屏" is "visualization big screen" or simply "visualization display." This term typically refers to large screens or displays used to present data, information, or visuals in a way that is easily understandable and engaging. In many contexts, these screens are employed in business environments, control rooms, or public spaces to facilitate data-driven decision-making and enhance audience engagement.
What are the common applications of visualization big screens?
Visualization big screens are utilized across a variety of sectors, including business, education, healthcare, and entertainment. In corporate settings, they are often used for displaying real-time data analytics, performance metrics, or project management dashboards. Educational institutions might employ these screens for interactive learning experiences, showcasing multimedia presentations, or facilitating collaborative discussions. In healthcare, they can help visualize patient data for better decision-making during critical situations. The entertainment industry also uses these screens for immersive experiences, such as in theme parks or live events where visual storytelling plays a crucial role.
How do visualization big screens enhance data comprehension?
Visualization big screens significantly enhance data comprehension by transforming complex data sets into visual formats that are easier to interpret. By leveraging graphical elements such as charts, graphs, and interactive interfaces, these screens allow users to grasp trends, patterns, and insights quickly. The large format also promotes collaboration, as multiple viewers can engage with the content simultaneously. Furthermore, the use of colors, animations, and real-time updates captivates audiences, making it simpler for them to understand key messages and make informed decisions based on the visualized data.
本文内容通过AI工具匹配关键字智能整合而成,仅供参考,帆软不对内容的真实、准确或完整作任何形式的承诺。具体产品功能请以帆软官方帮助文档为准,或联系您的对接销售进行咨询。如有其他问题,您可以通过联系blog@fanruan.com进行反馈,帆软收到您的反馈后将及时答复和处理。


