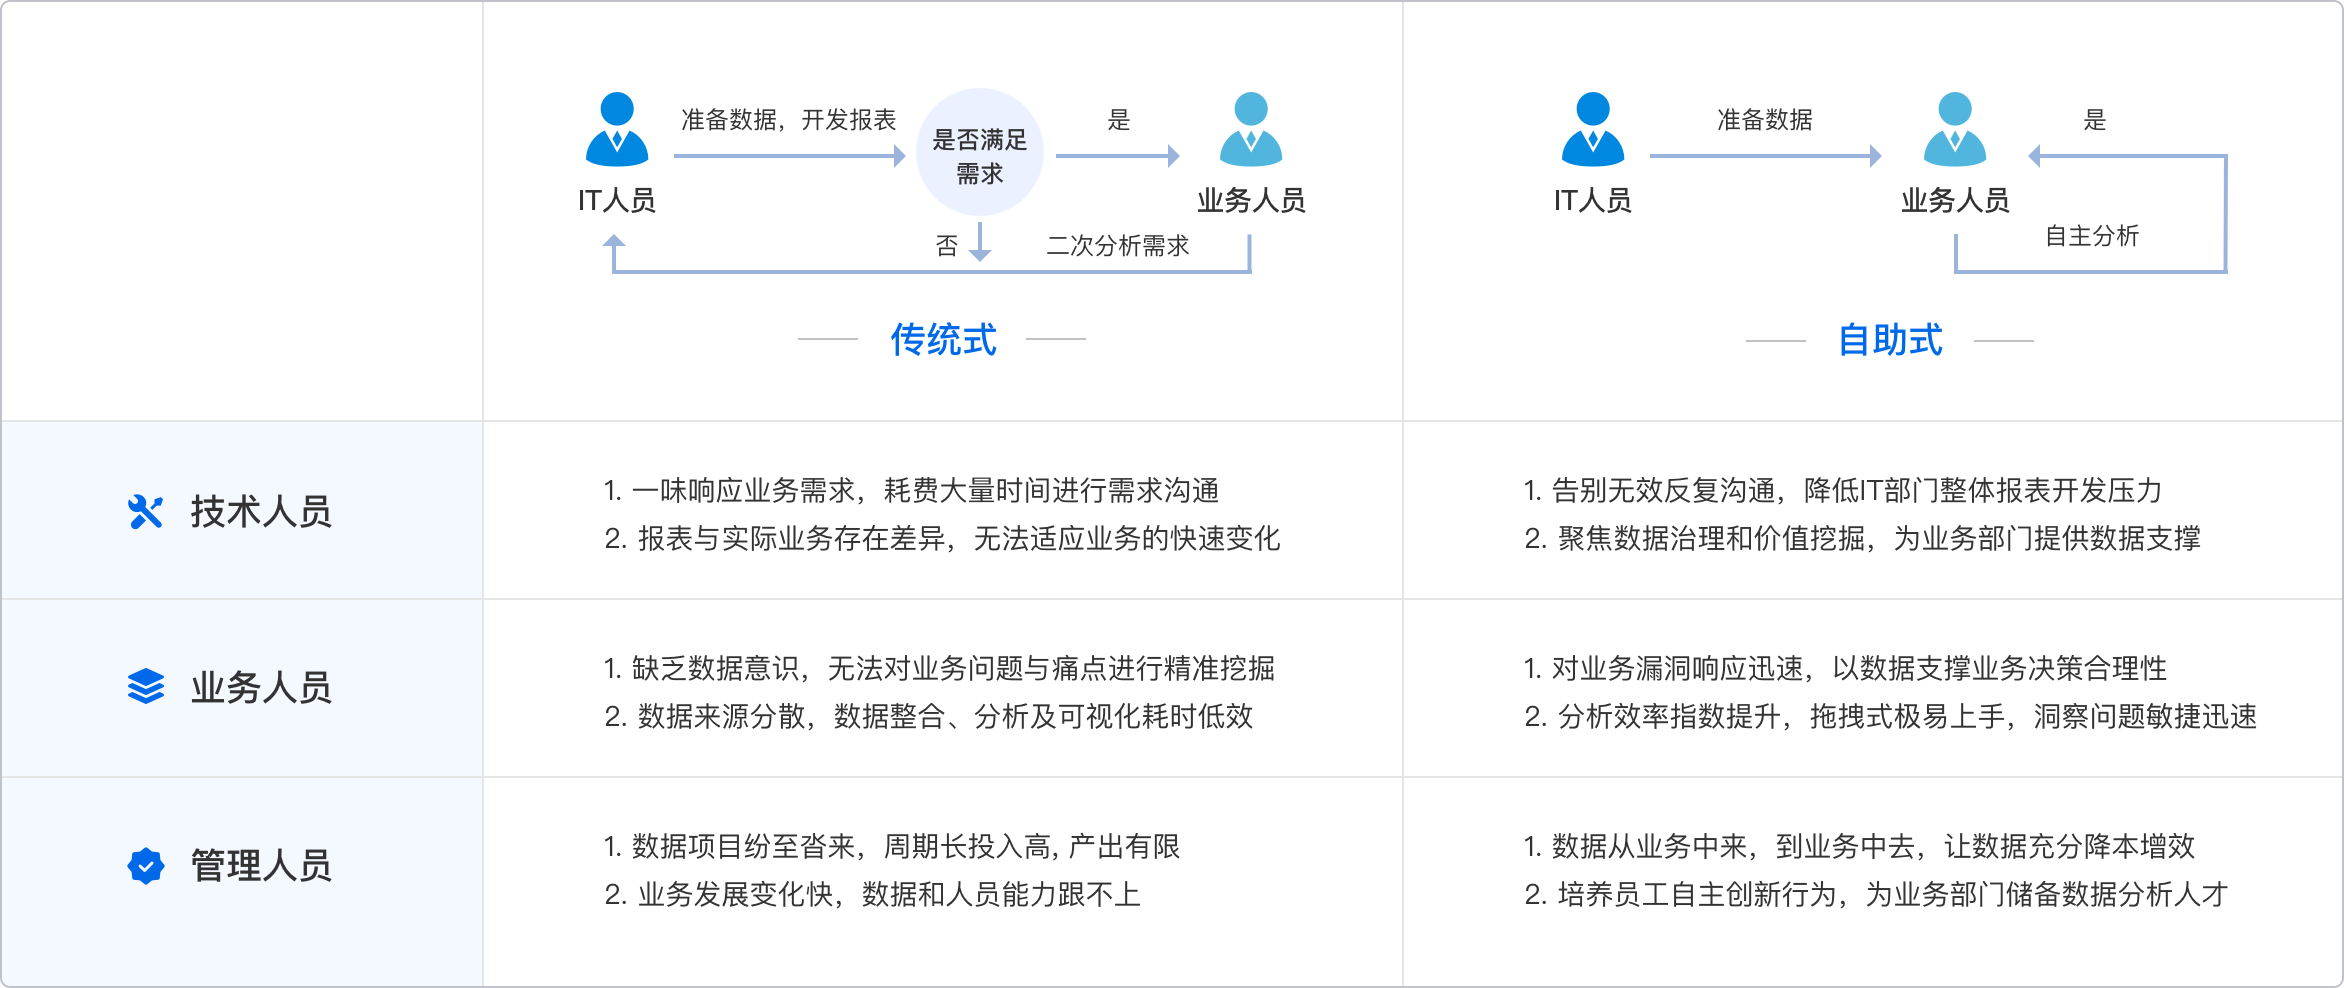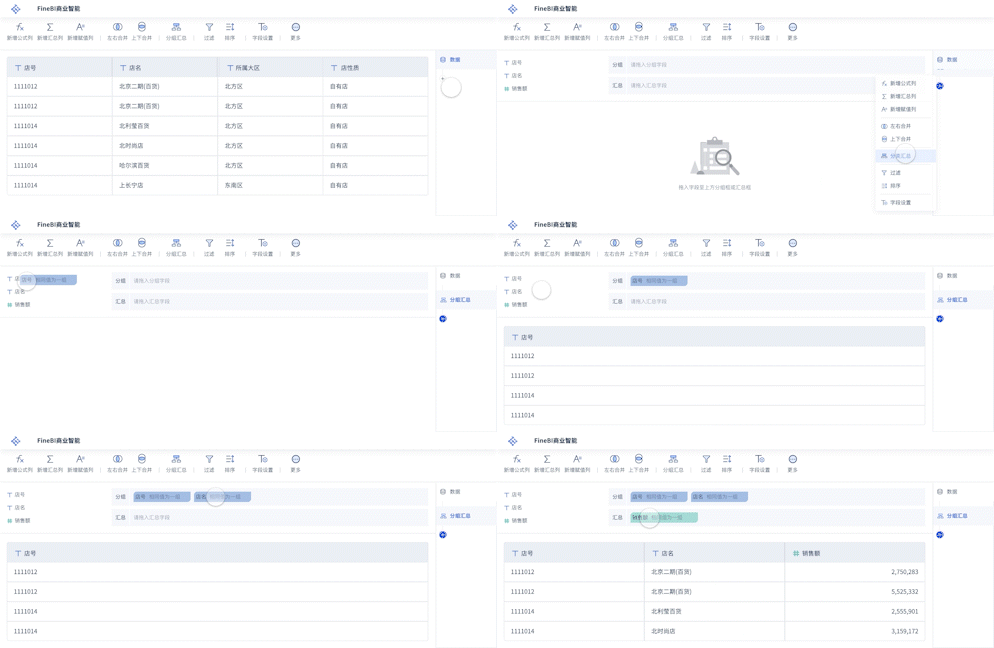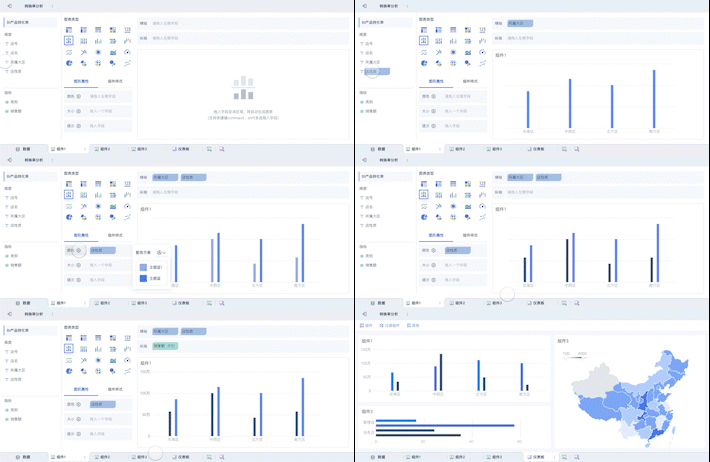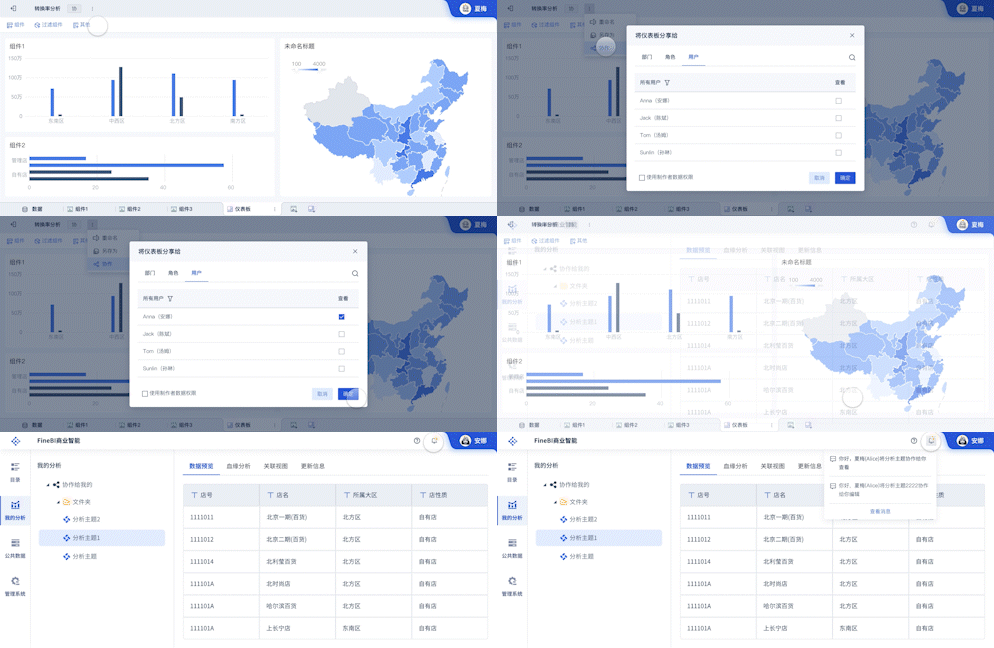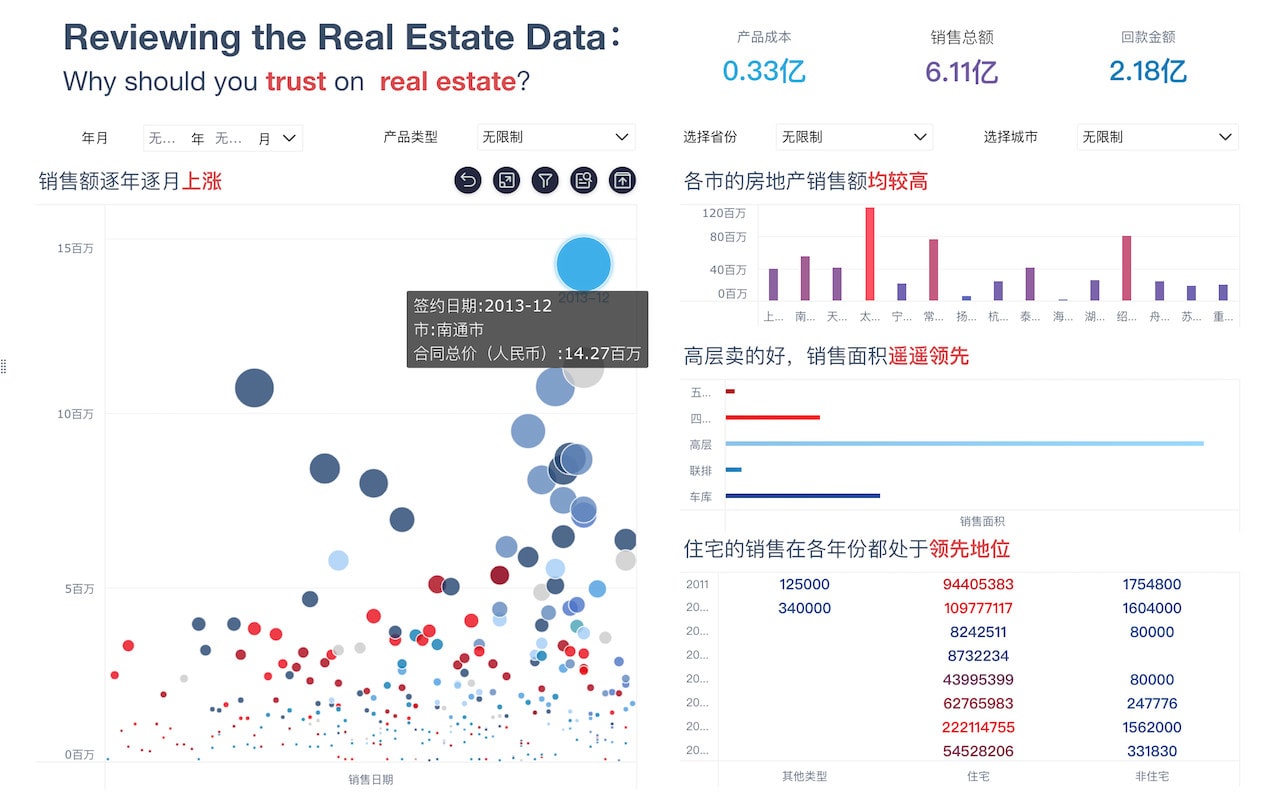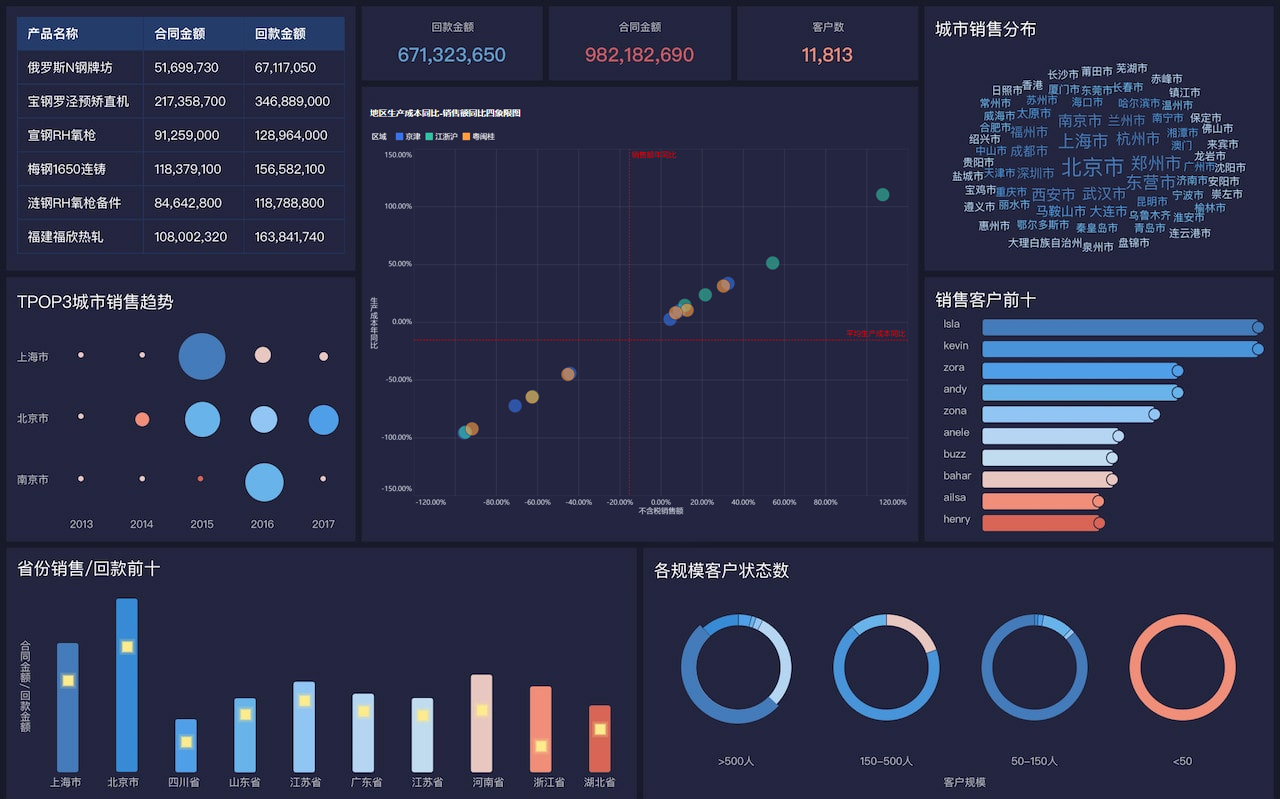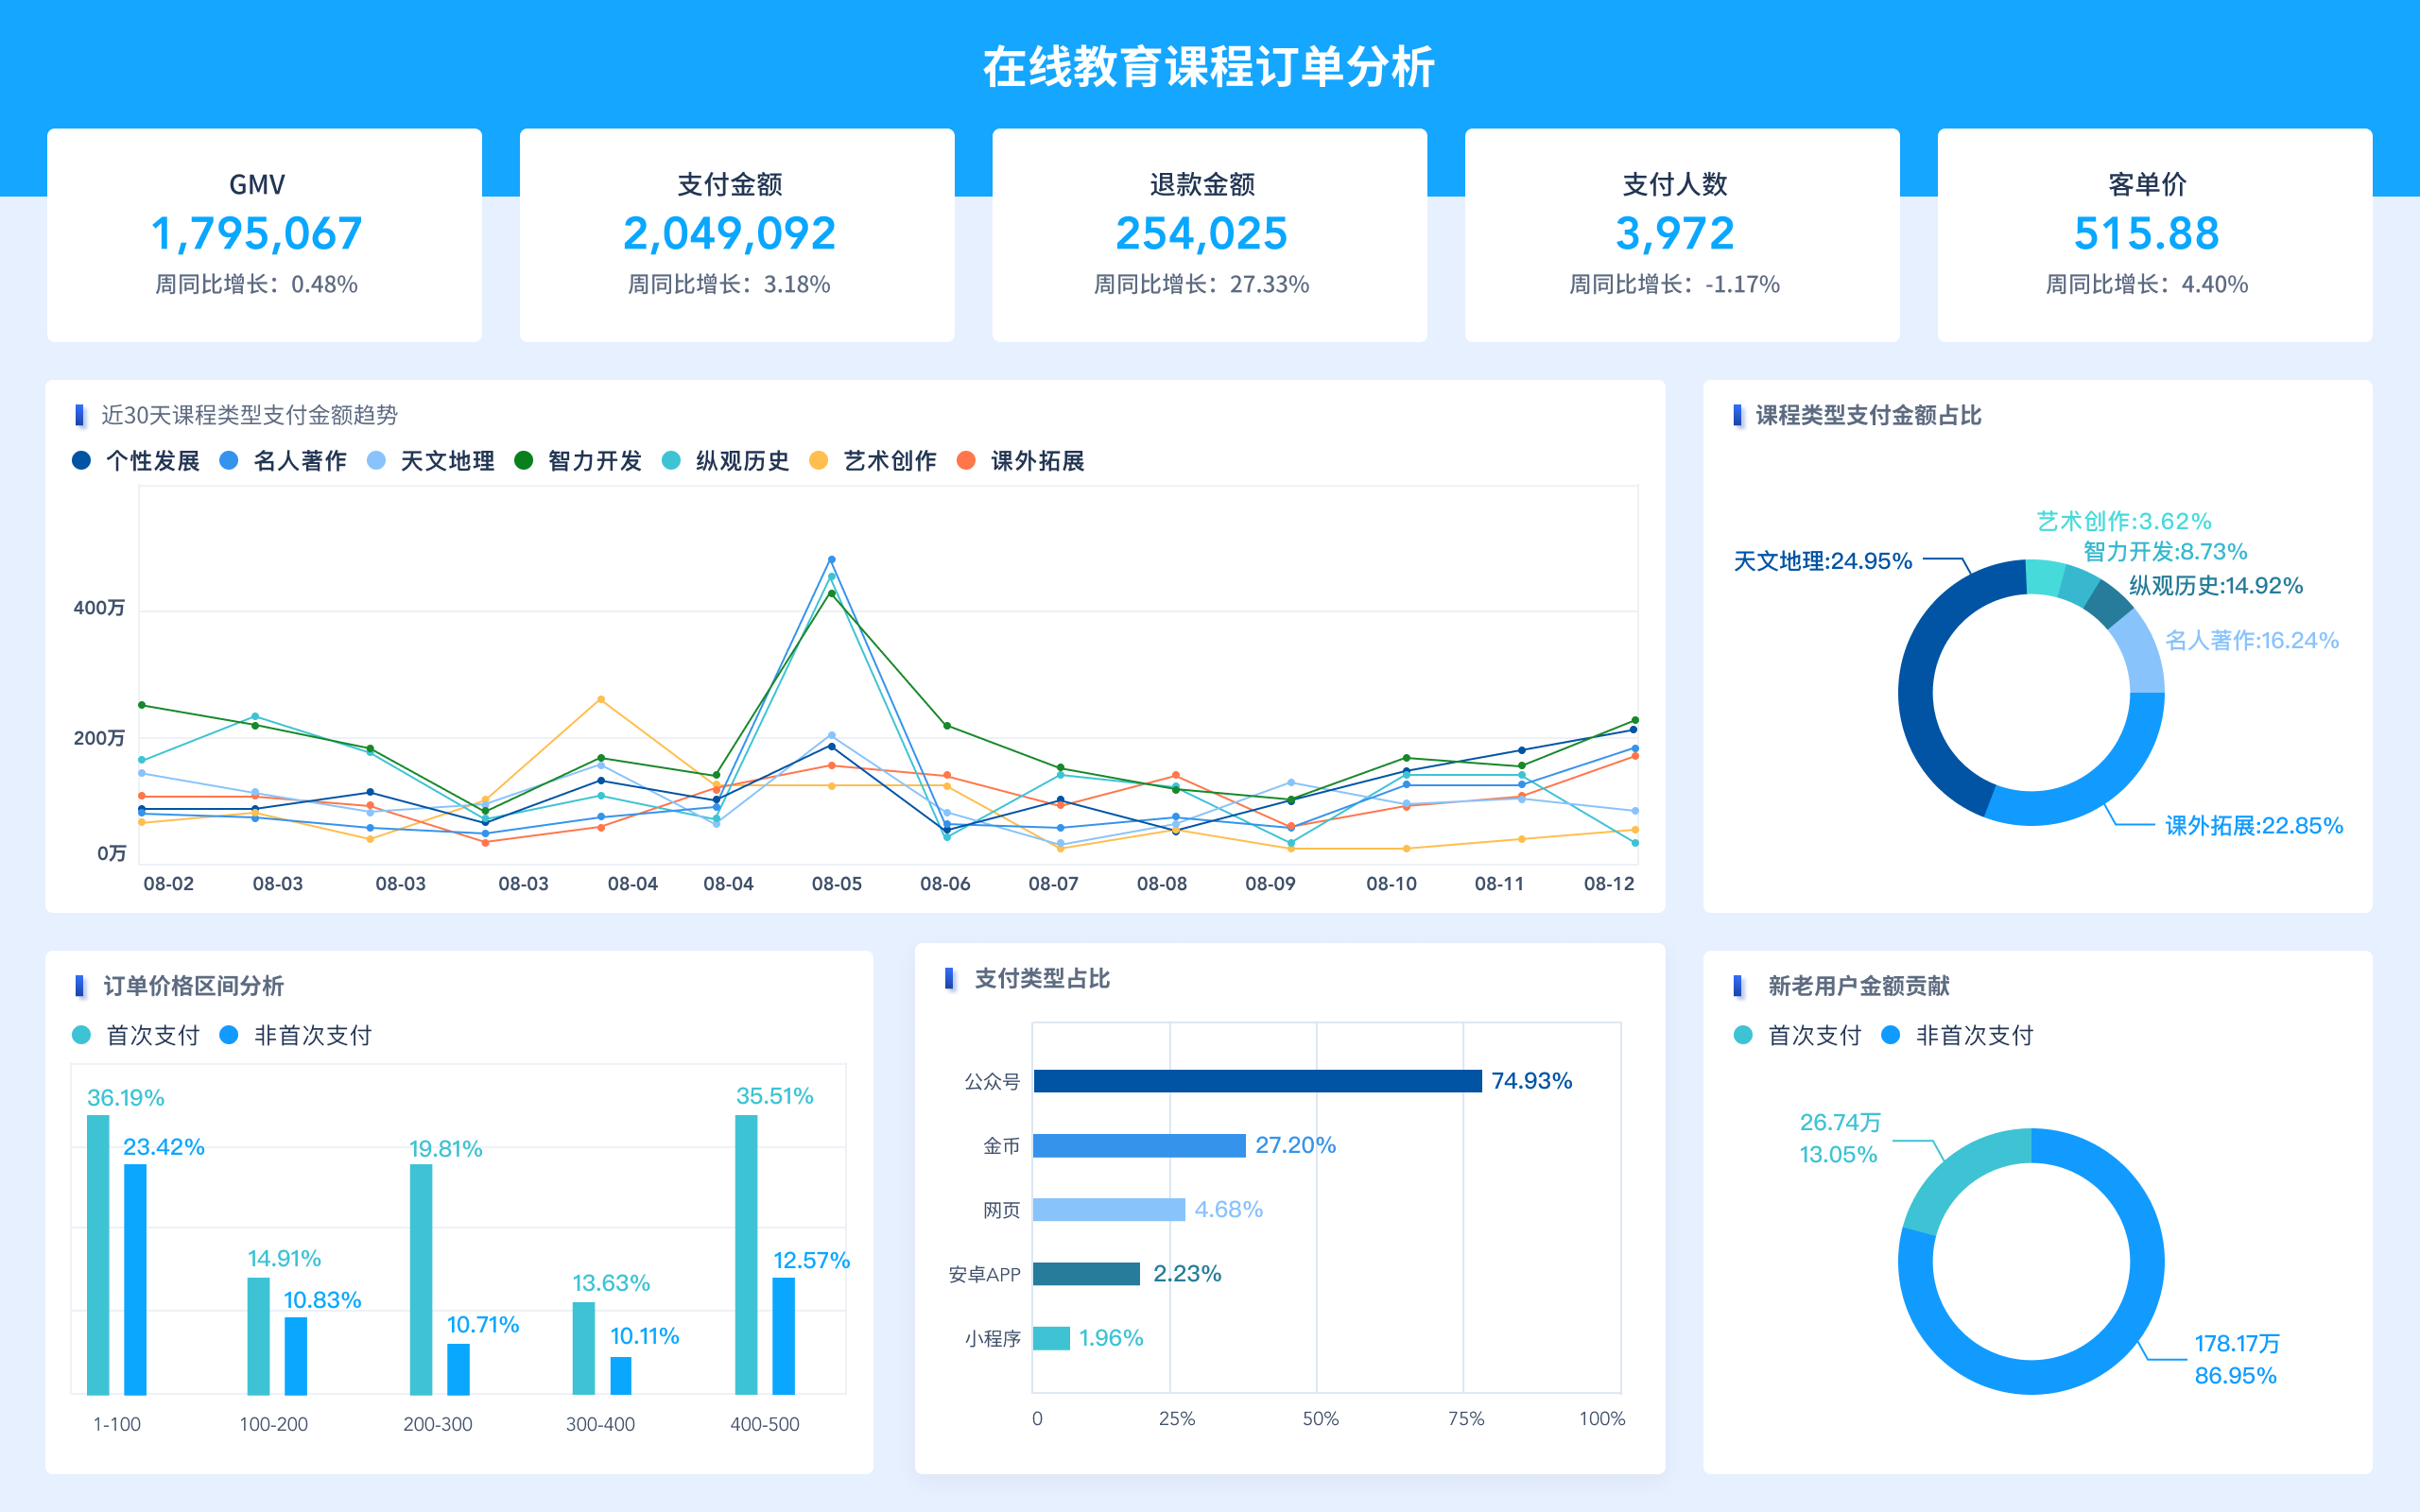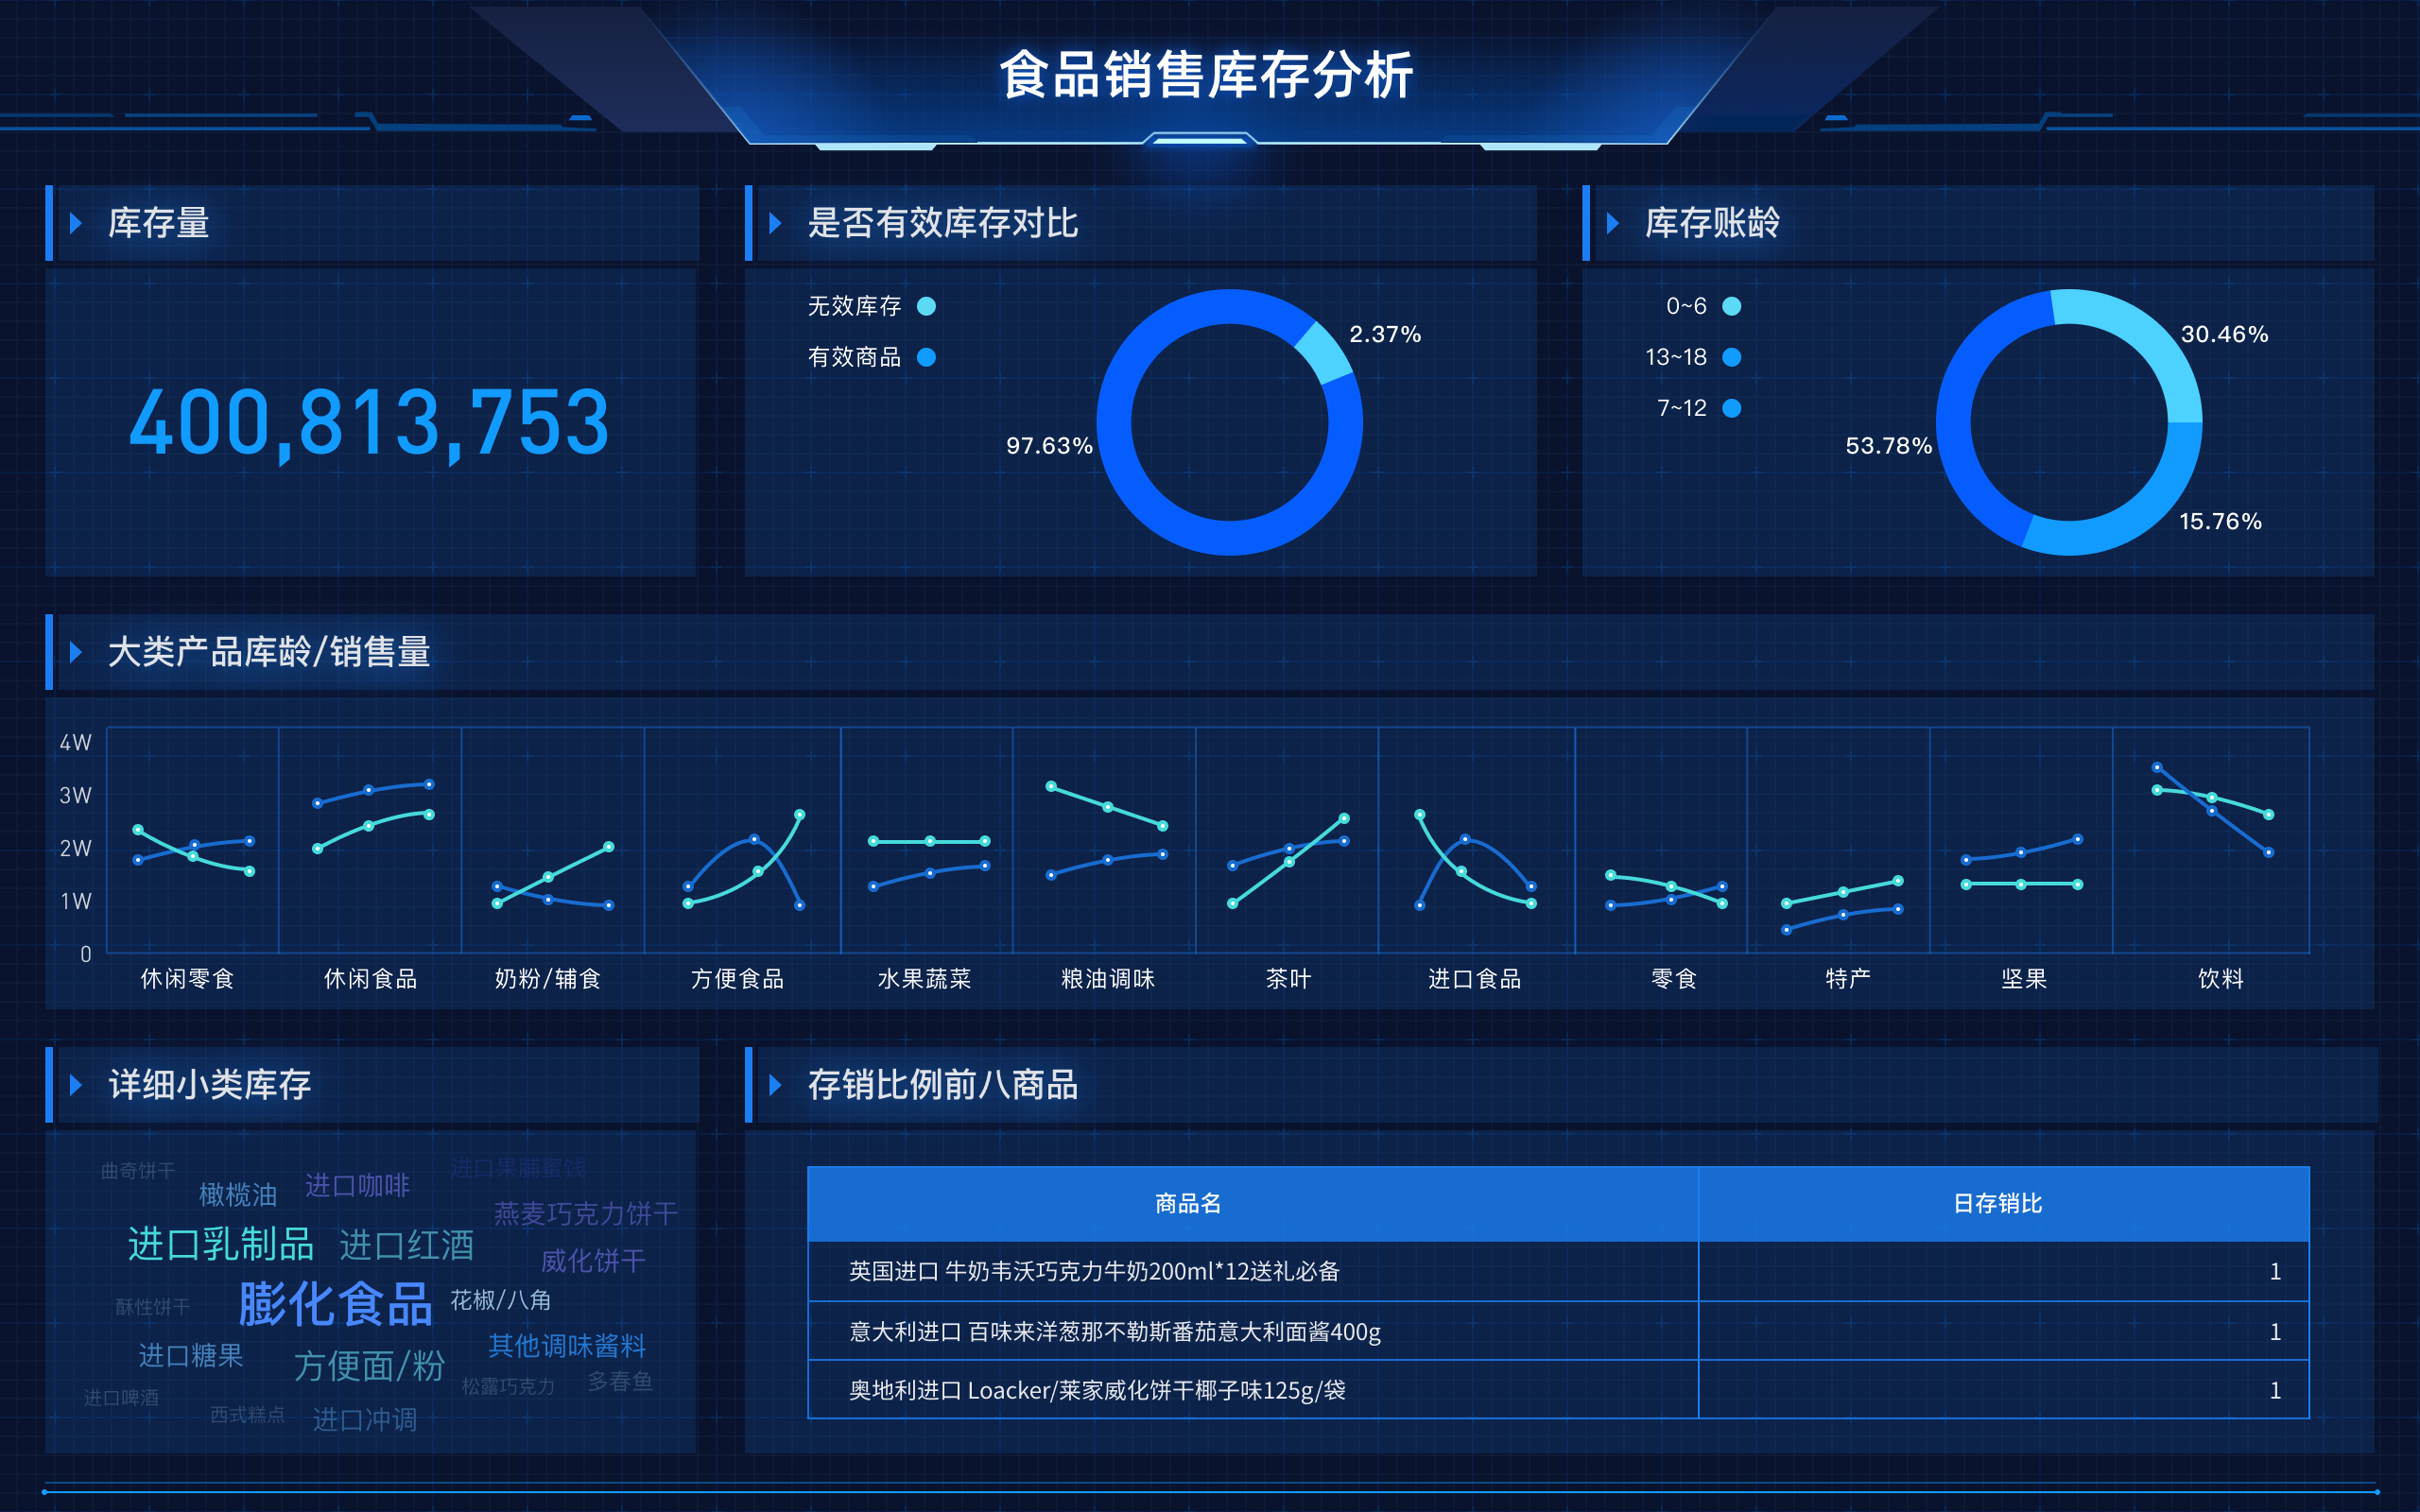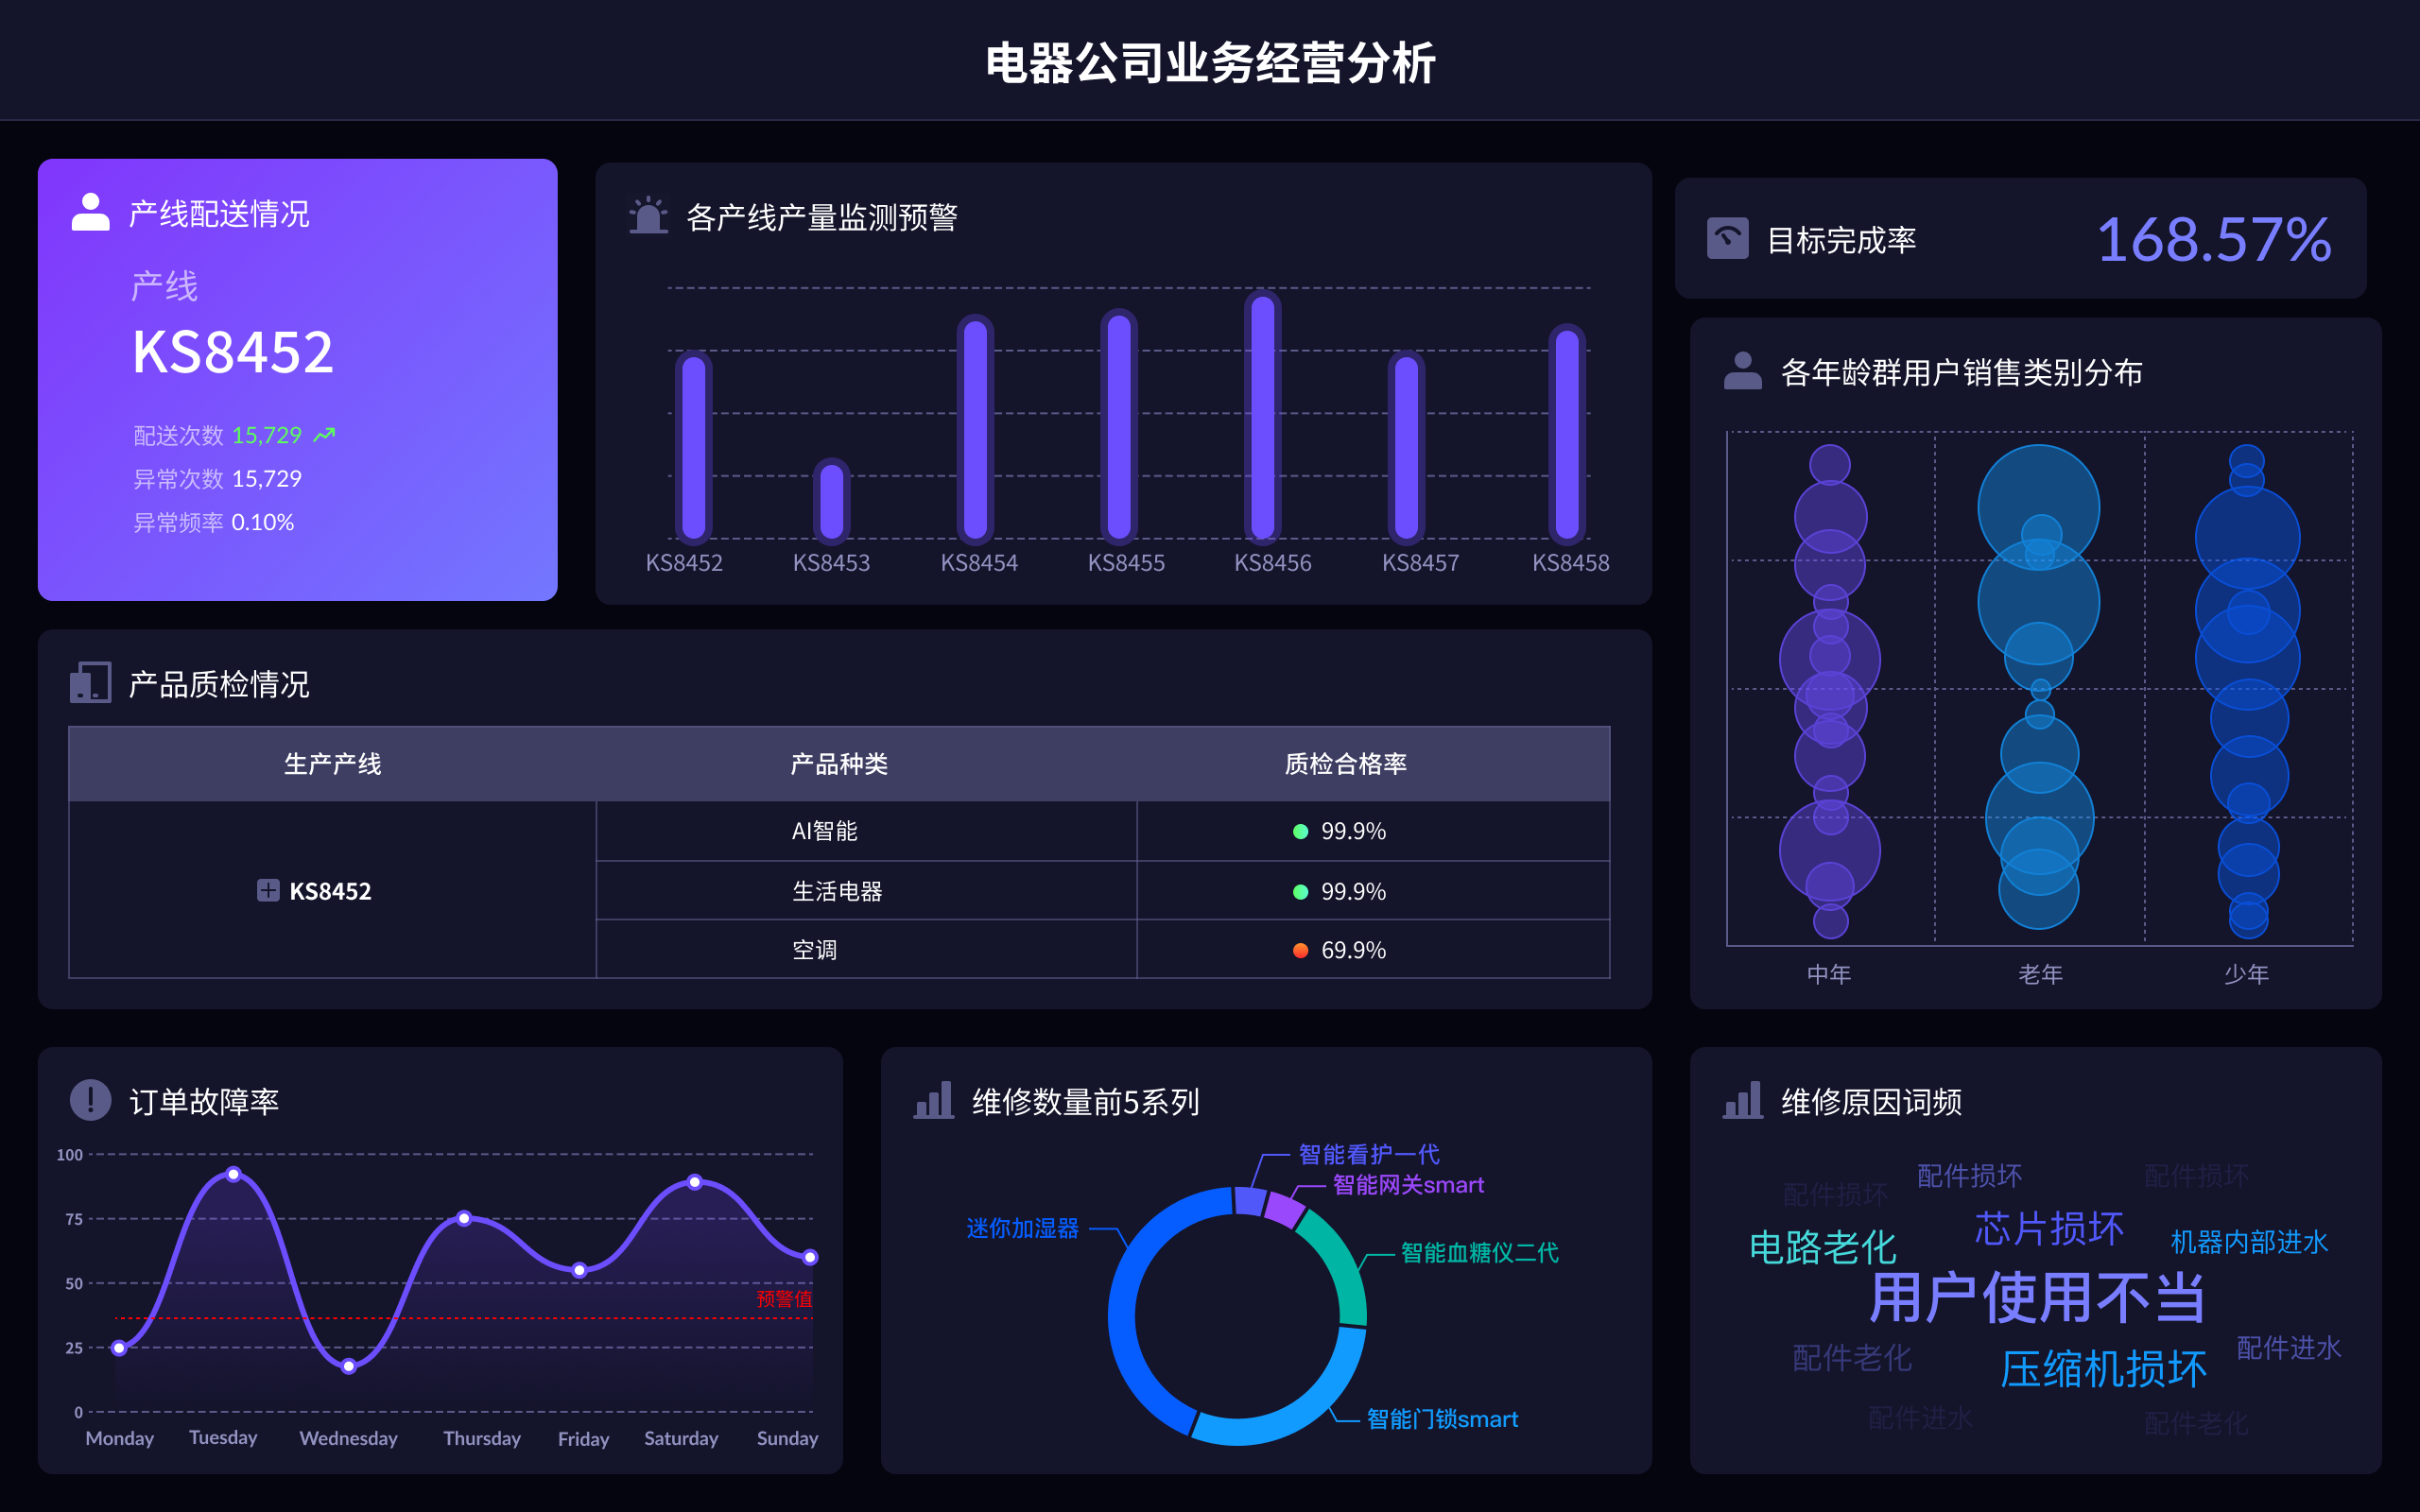
The English abbreviation for a visualization large screen is "VLS" (Visualization Large Screen). This term refers to displays used for presenting large amounts of data in a visually comprehensible format, often utilized in control rooms, conferences, or monitoring systems to provide real-time data insights. Enhanced data comprehension, real-time monitoring, improved decision-making, engaging presentations are the key benefits. Enhanced data comprehension can be achieved by presenting complex data sets in an easily understandable format, which allows stakeholders to quickly grasp the essential information and make informed decisions.
I、ENHANCED DATA COMPREHENSION
A VLS is essential for converting complex datasets into an easy-to-understand visual format. This process involves using graphs, charts, and other visual aids to represent data that might otherwise be overwhelming in raw form. The primary advantage is that it helps users quickly grasp the essential trends and patterns. For instance, in a corporate setting, a VLS can display sales performance metrics, highlighting areas where the company is performing well and identifying sectors needing improvement. This capability is particularly crucial during strategic planning sessions, where clear and concise data presentation can significantly influence decision-making.
II、REAL-TIME MONITORING
Real-time monitoring is another significant benefit of using a VLS. These screens can display live data feeds, allowing users to monitor ongoing processes or events as they happen. This feature is particularly useful in environments such as control rooms, where operators need to keep track of multiple data streams simultaneously. For example, in a manufacturing plant, a VLS can show the status of different production lines, alerting managers to any issues that need immediate attention. Having this real-time data allows for quicker response times and more efficient operations.
III、IMPROVED DECISION-MAKING
With enhanced data comprehension and real-time monitoring, a VLS significantly improves decision-making processes. Decision-makers can rely on the visual data to gain insights quickly, assess various scenarios, and make informed choices. This ability to see the big picture, as well as the finer details, helps in evaluating the potential outcomes of different strategies. For example, in emergency response situations, a VLS can provide critical information about resource deployment, helping coordinators to make swift and effective decisions to manage the situation.
IV、ENGAGING PRESENTATIONS
VLSs are also instrumental in making presentations more engaging and impactful. By visually displaying data, presenters can capture the audience’s attention and convey their message more effectively. This visual appeal is crucial in educational settings, corporate meetings, and conferences, where keeping the audience engaged is essential. For instance, in a business conference, a VLS can showcase key performance indicators, market trends, and future projections in a visually appealing manner, making the information more digestible and memorable for the audience.
V、APPLICATIONS IN VARIOUS INDUSTRIES
The applications of VLSs span across multiple industries, each benefiting from its unique capabilities. In the healthcare industry, VLSs can be used to monitor patient vitals and other critical data, providing healthcare professionals with the information they need to make timely decisions. In education, VLSs enhance learning by displaying educational content in a visually engaging way, helping students to better understand complex concepts. In the financial sector, VLSs can present market data and trends in real-time, aiding traders and analysts in making informed decisions.
VI、TECHNOLOGY AND INTEGRATION
The technology behind VLSs involves advanced display systems, data processing units, and integration software that ensure seamless operation. High-resolution screens, interactive features, and the ability to handle large data sets are some of the key technological aspects. Integration with various data sources, such as databases, IoT devices, and software applications, allows VLSs to pull in data from multiple channels, providing a comprehensive view of the information. This integration capability is vital for creating a unified data visualization platform that can be tailored to meet the specific needs of different industries.
VII、FUTURE TRENDS
Looking ahead, the future of VLS technology is promising, with advancements in AI, machine learning, and data analytics set to enhance its capabilities further. These technologies will enable more sophisticated data visualization, predictive analytics, and automated insights, making VLSs even more powerful tools for decision-making. Additionally, the increasing adoption of 5G technology will facilitate faster data transmission, enhancing the real-time capabilities of VLSs. As these technologies evolve, VLSs will continue to play a crucial role in helping organizations to harness the power of their data.
For a deeper understanding of data visualization tools, you might explore FineReport and FineVis, products by Fanruan. They offer robust solutions for creating detailed and interactive data visualizations. More details can be found on their official websites:
- FineReport: https://s.fanruan.com/ryhzq
- FineVis: https://s.fanruan.com/7z296
相关问答FAQs:
可视化大屏英文缩写是什么?
可视化大屏在英文中通常称为“Visual Display”,其常用的缩写是“VD”或“VDS”,具体取决于上下文。可视化大屏是一种用于数据展示和信息传播的设备,广泛应用于各个行业,如商业、教育、交通、安防等。它通过图形、图表和动态内容等多种形式,将复杂的数据和信息以直观易懂的方式呈现出来,帮助用户快速理解和分析。
在现代信息技术的发展背景下,可视化大屏的应用越来越普遍。它不仅仅是一个显示屏,更是一个数据分析和决策支持的工具。通过大屏展示,企业能够实时监控关键业务指标,提升决策效率。
可视化大屏的主要功能是什么?
可视化大屏的功能主要包括数据监控、信息展示、互动分析和远程控制等。它能够通过实时数据采集与处理,将重要信息以图形化的形式展示,帮助用户快速获取所需的信息。
-
数据监控:可视化大屏常用于实时监控各种业务数据,如销售业绩、生产进度、网络流量等。通过图表和仪表盘的形式,用户可以一目了然地看到数据的变化趋势,及时做出调整。
-
信息展示:在会议、展览和教育等场合,可视化大屏用于展示各种信息,包括企业宣传、产品介绍、课程内容等。它能够吸引观众的注意力,提升信息传递的效果。
-
互动分析:现代的可视化大屏支持触摸和互动功能,用户可以通过手势操作对数据进行深入分析。这种互动性不仅提升了用户体验,也促使团队成员之间的协作更加高效。
-
远程控制:许多可视化大屏可以通过网络进行远程控制,用户可以在不同地点管理和更新展示内容。这一功能特别适合需要多地协调或远程办公的企业。
可视化大屏的应用领域有哪些?
可视化大屏的应用领域非常广泛,涵盖了商业、教育、交通、安防等多个行业。以下是一些主要的应用场景:
-
商业领域:在商业环境中,可视化大屏常用于展示销售数据、市场分析和客户反馈等。它帮助企业实时监控业务表现,支持决策制定。
-
教育领域:学校和培训机构利用可视化大屏进行教学,展示课程内容和学习资料,提升学生的学习兴趣和参与度。通过互动功能,教师可以与学生进行即时交流,增强教学效果。
-
交通管理:城市交通管理部门使用可视化大屏展示交通流量、事故信息和天气情况等。通过实时数据分析,交通管理人员可以优化信号控制,提升交通效率。
-
安防监控:在安防领域,监控中心通过可视化大屏实时监控各类视频信号,进行事件分析和处理,确保公共安全。大屏的多画面显示功能使得安防人员能够快速响应各种突发情况。
-
展览展示:在展览和活动中,可视化大屏用于吸引观众,展示产品信息和品牌故事,增强参与者的体验感。通过动态的视觉效果,展览能够更好地传达主题和信息。
可视化大屏的灵活性和多功能性使其在各个行业中都能发挥重要作用,帮助组织提升信息传播的效率和质量。随着技术的进步,未来可视化大屏的应用将更加广泛和深入。
本文内容通过AI工具匹配关键字智能整合而成,仅供参考,帆软不对内容的真实、准确或完整作任何形式的承诺。具体产品功能请以帆软官方帮助文档为准,或联系您的对接销售进行咨询。如有其他问题,您可以通过联系blog@fanruan.com进行反馈,帆软收到您的反馈后将及时答复和处理。


