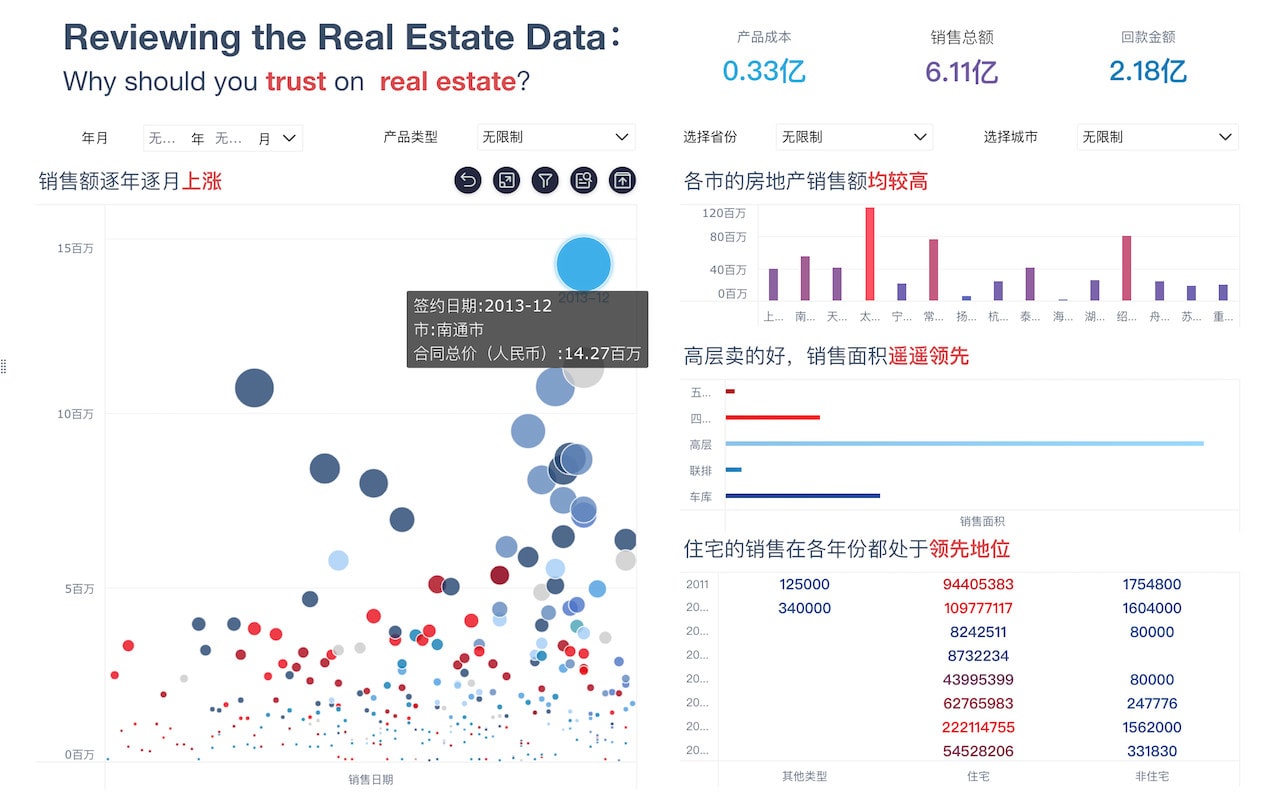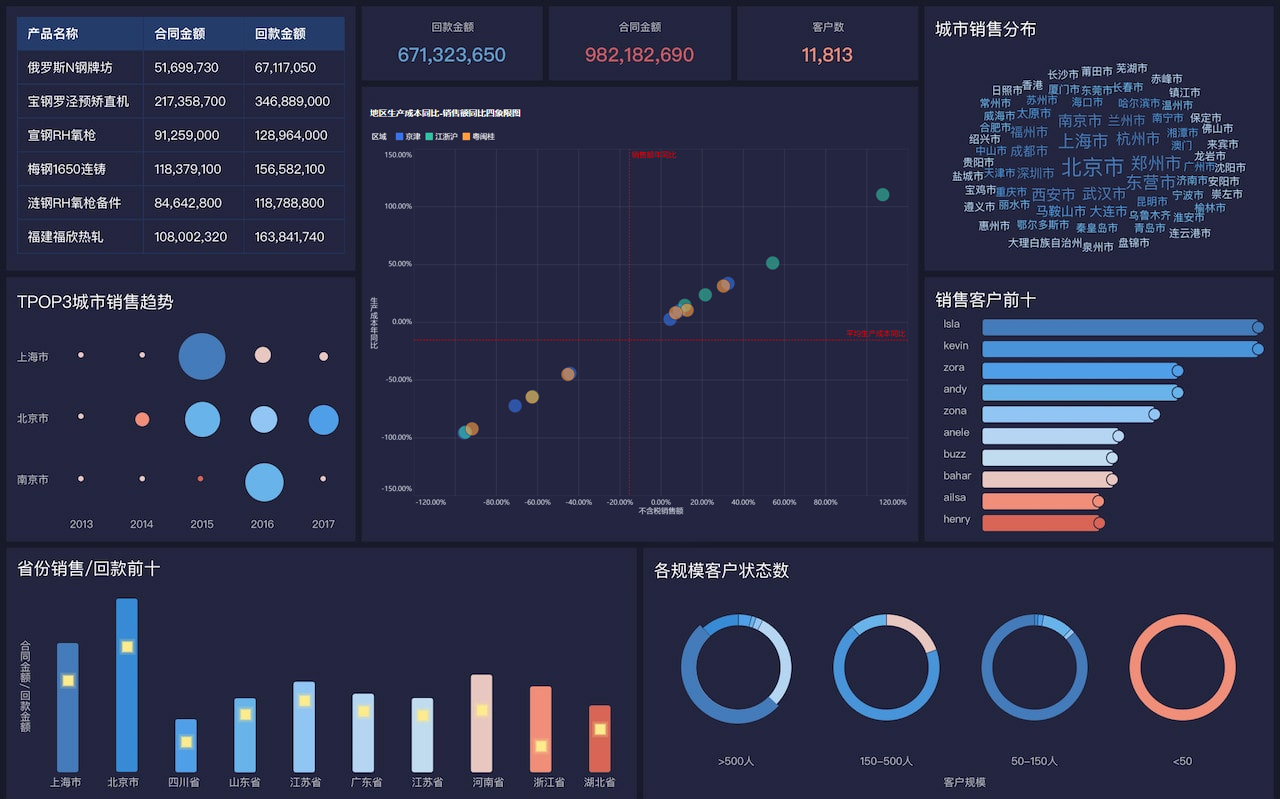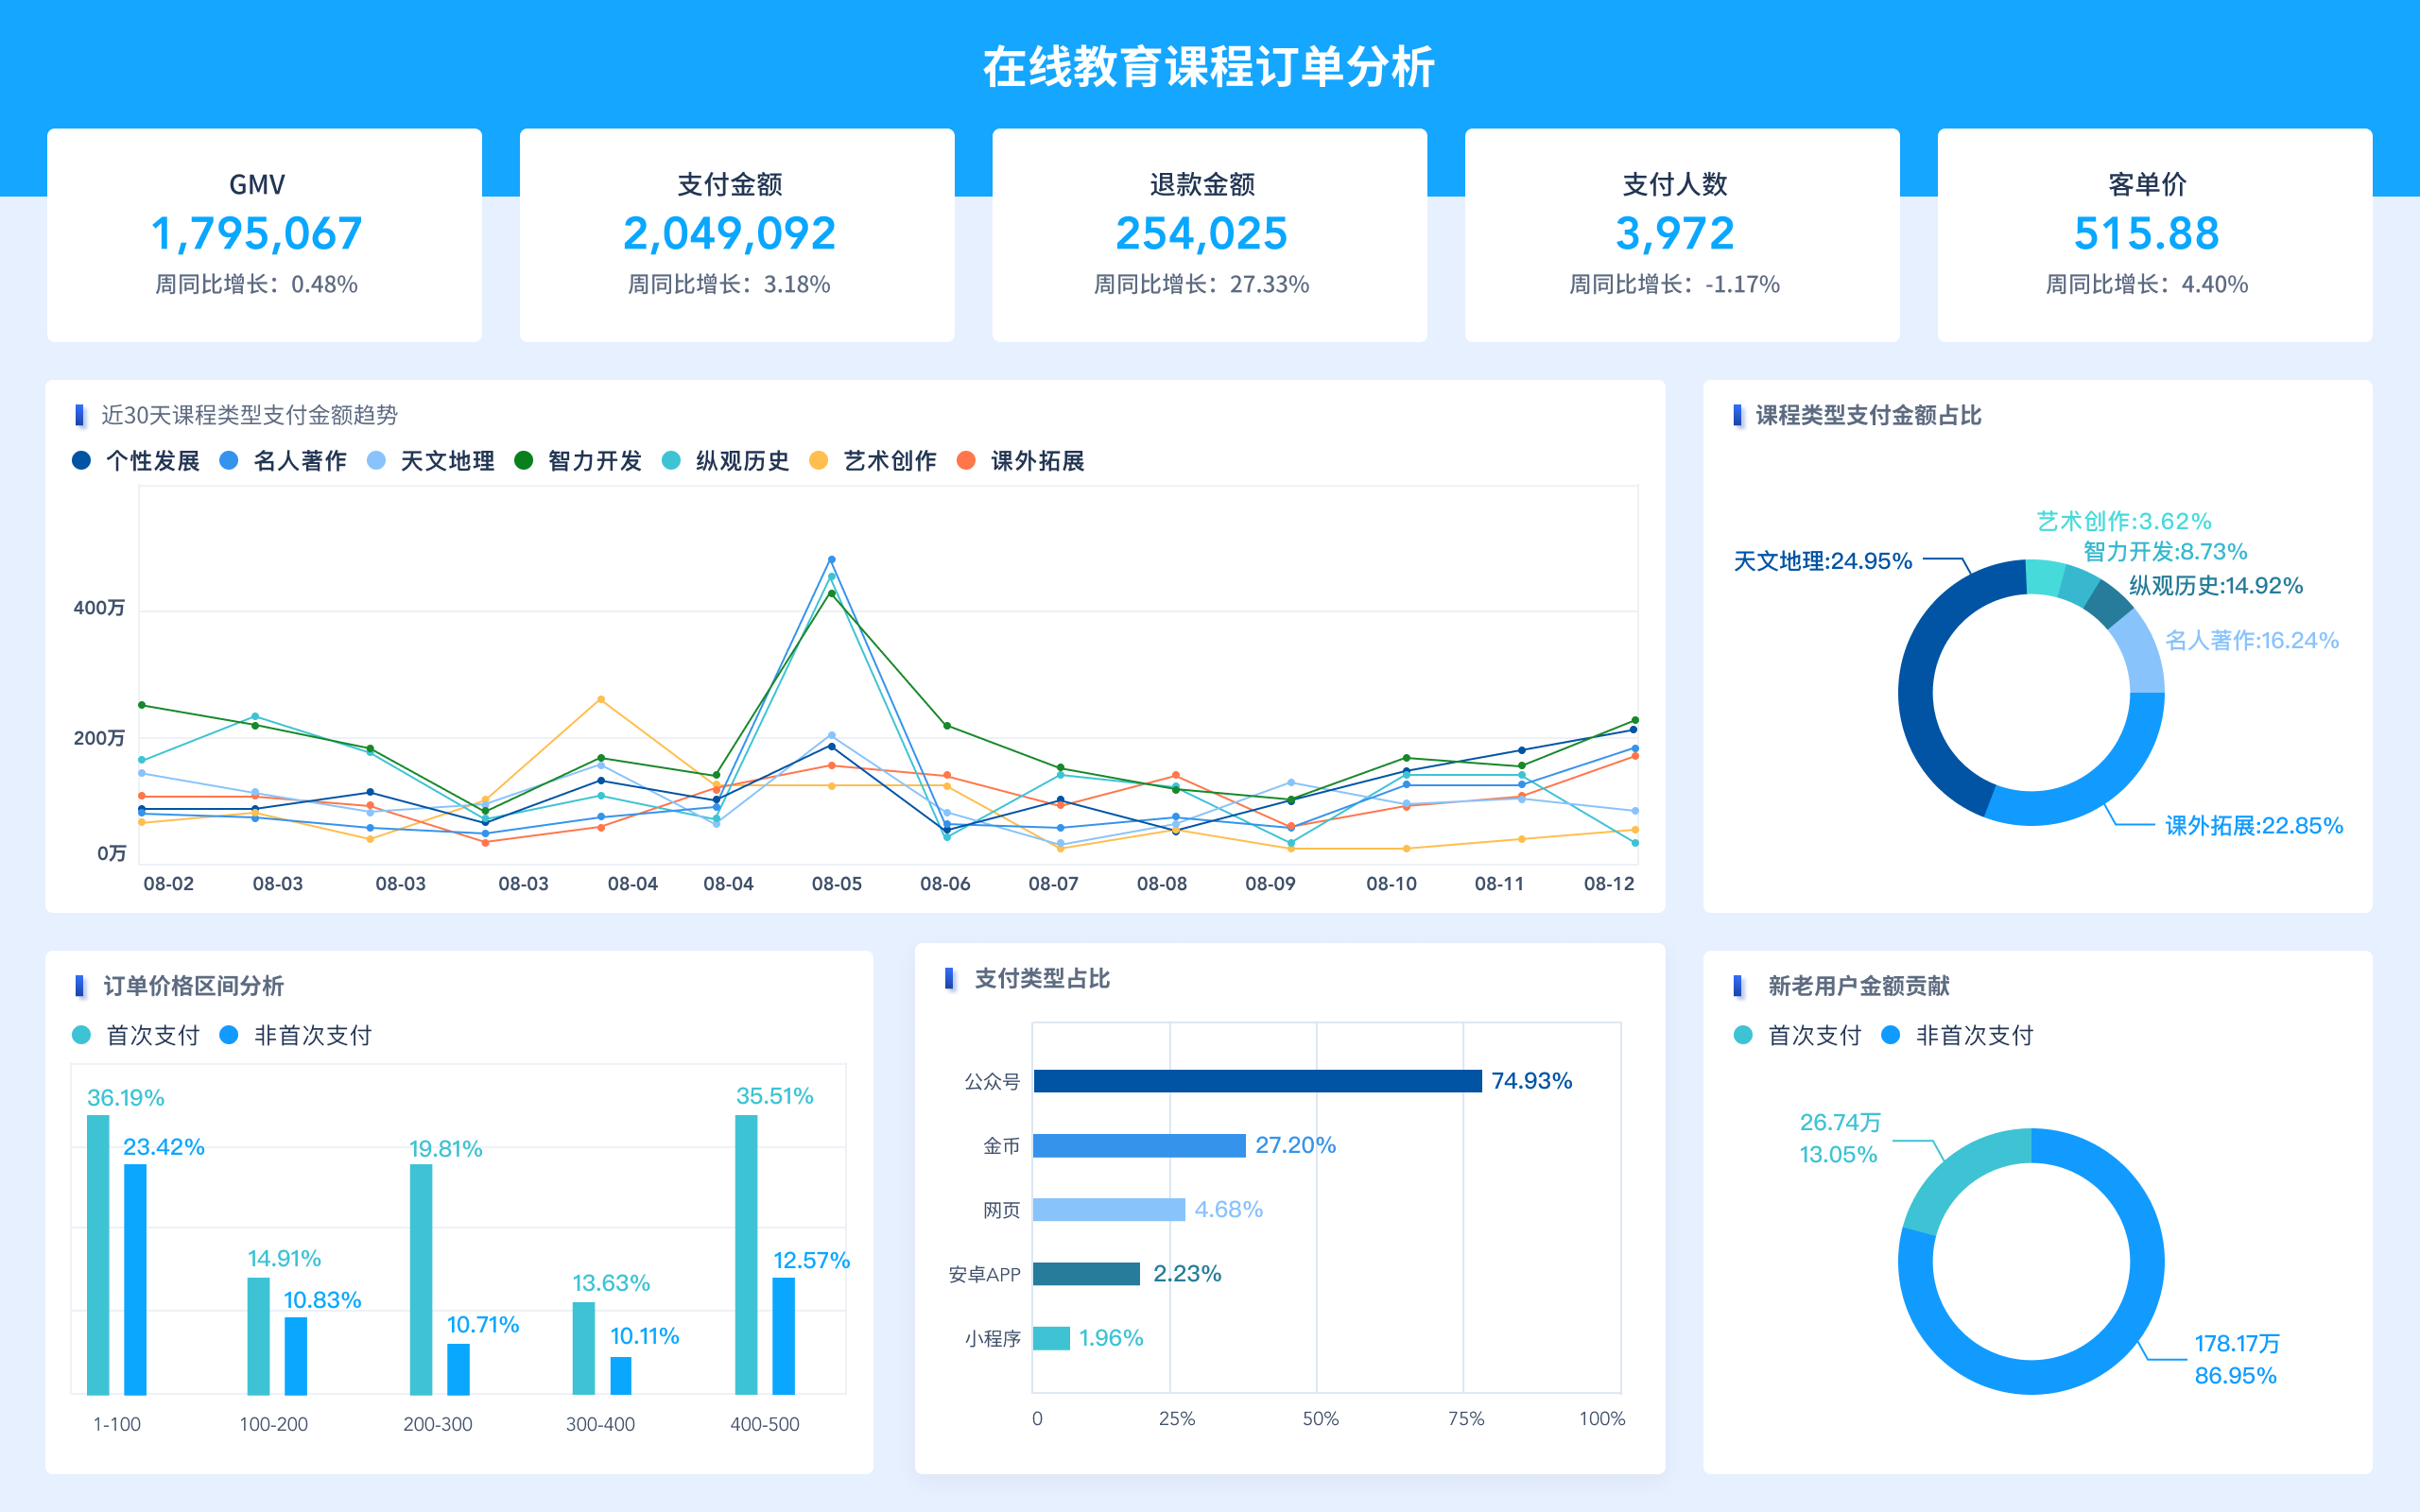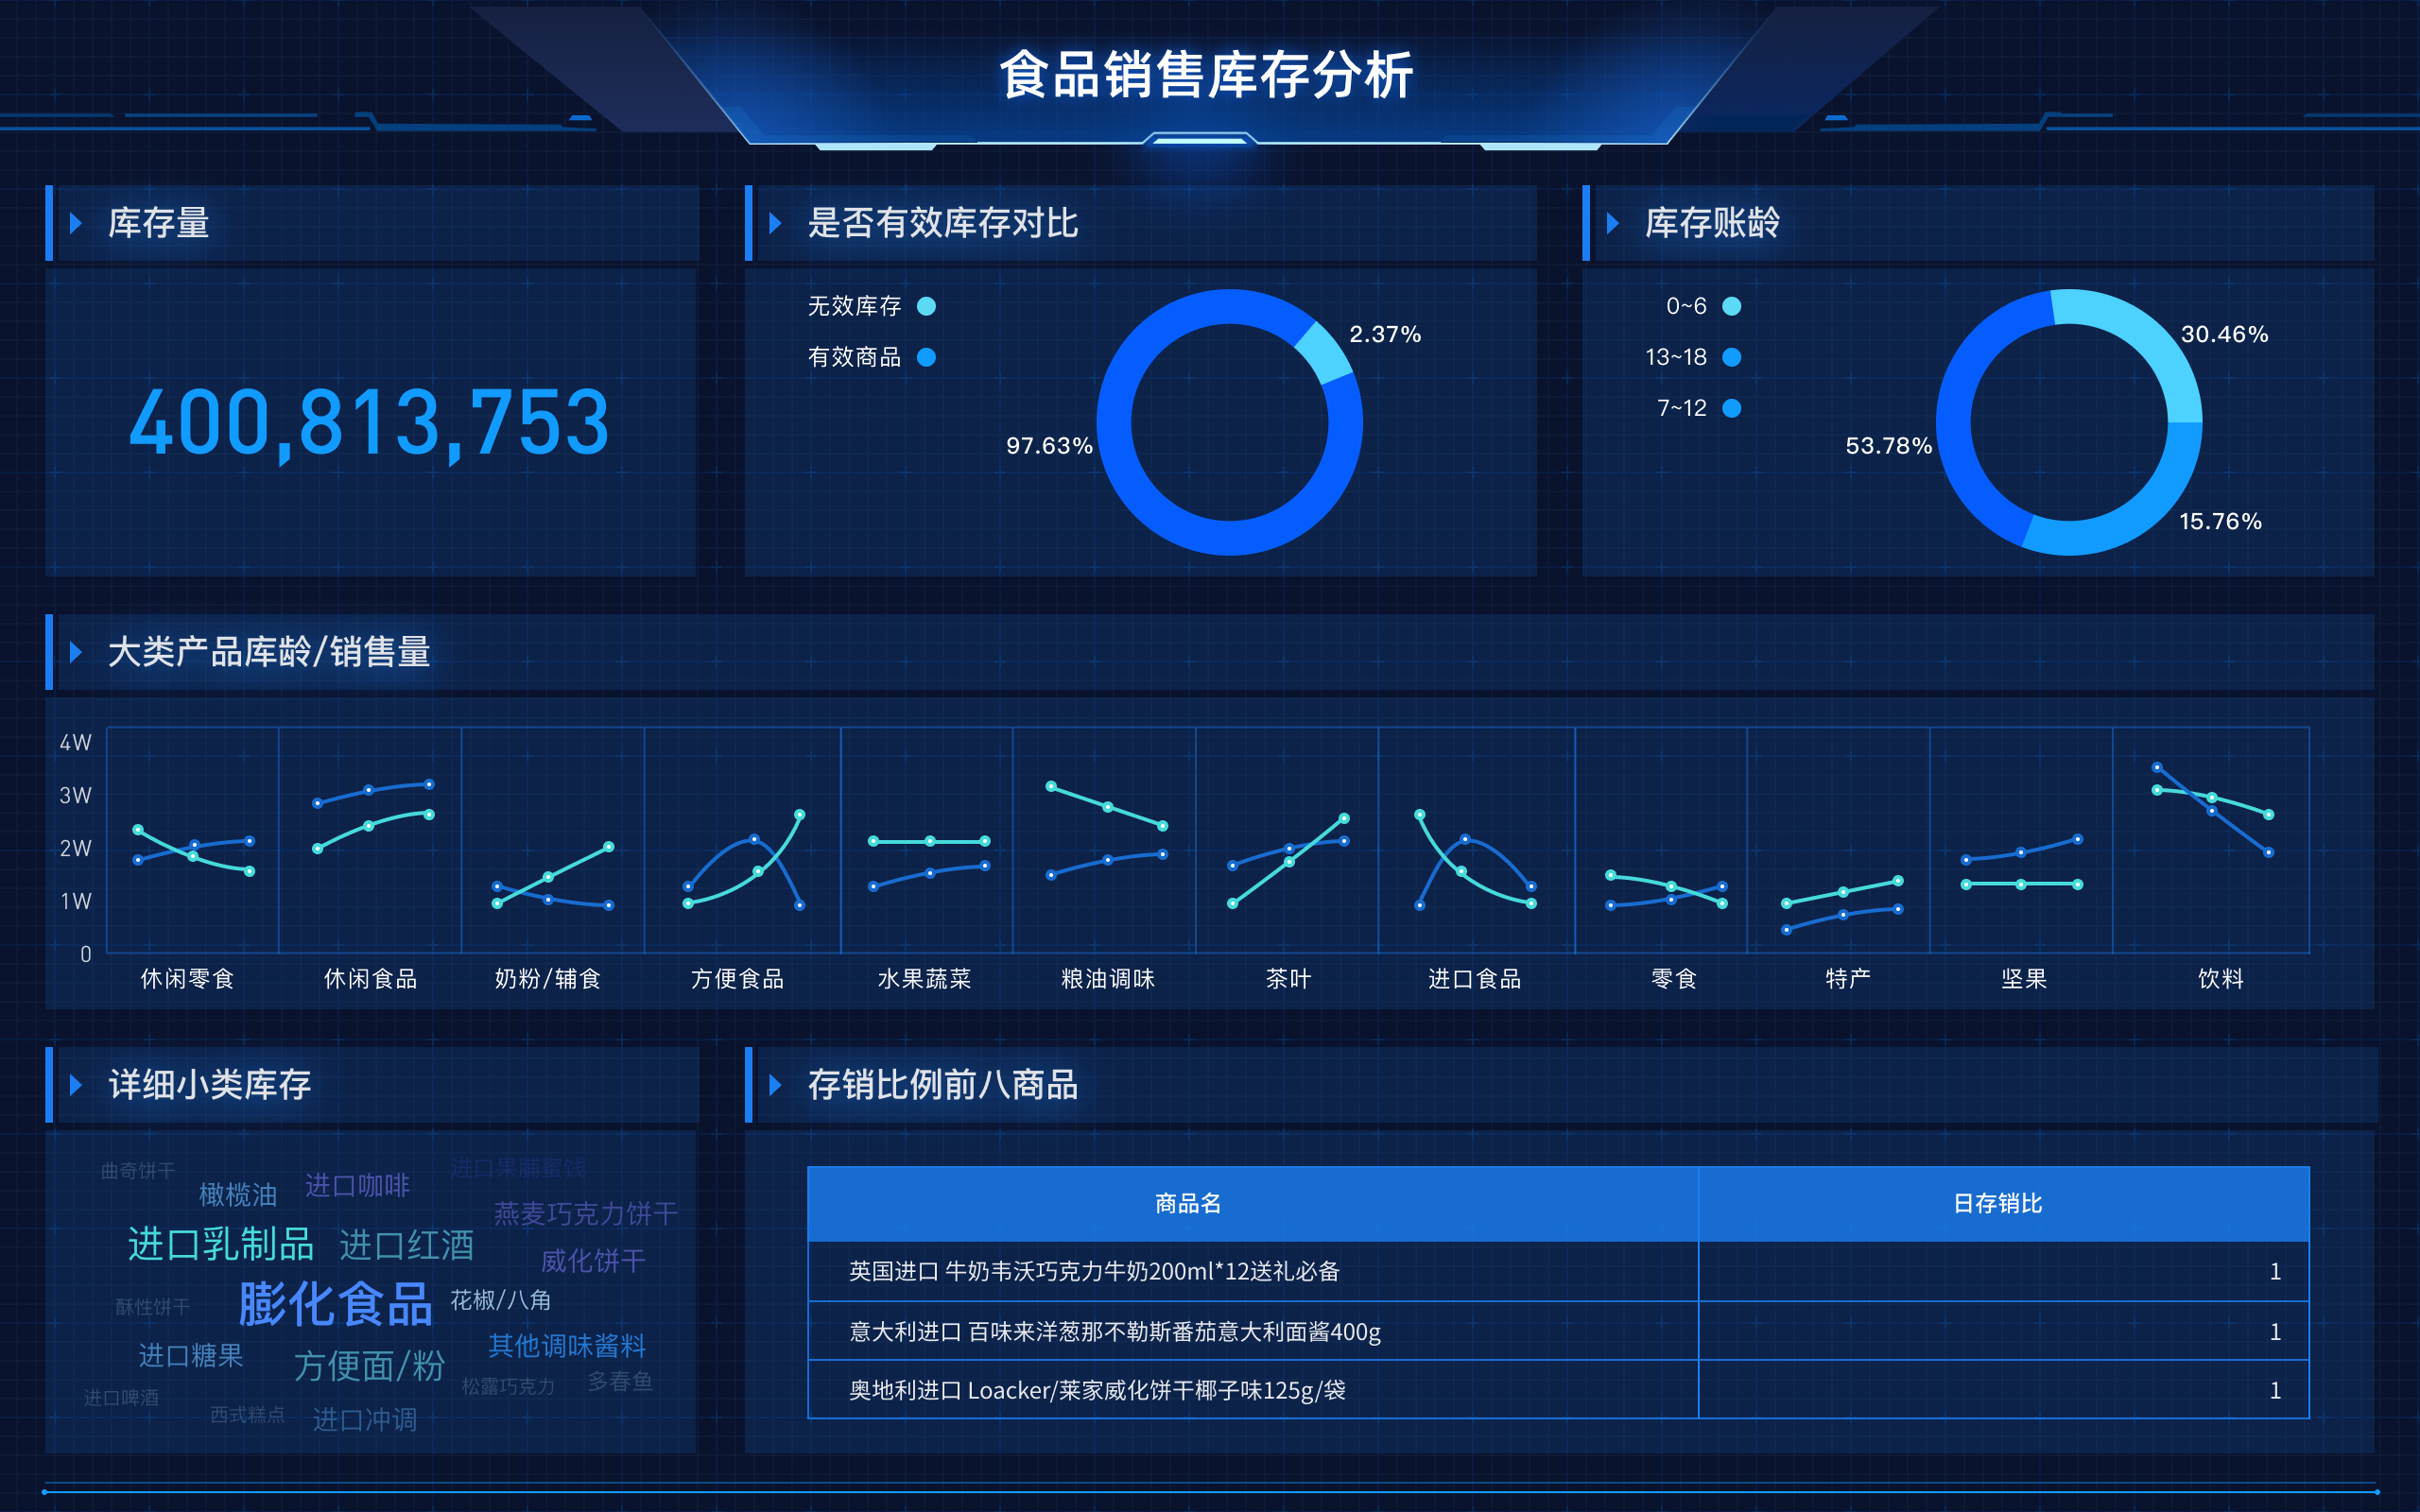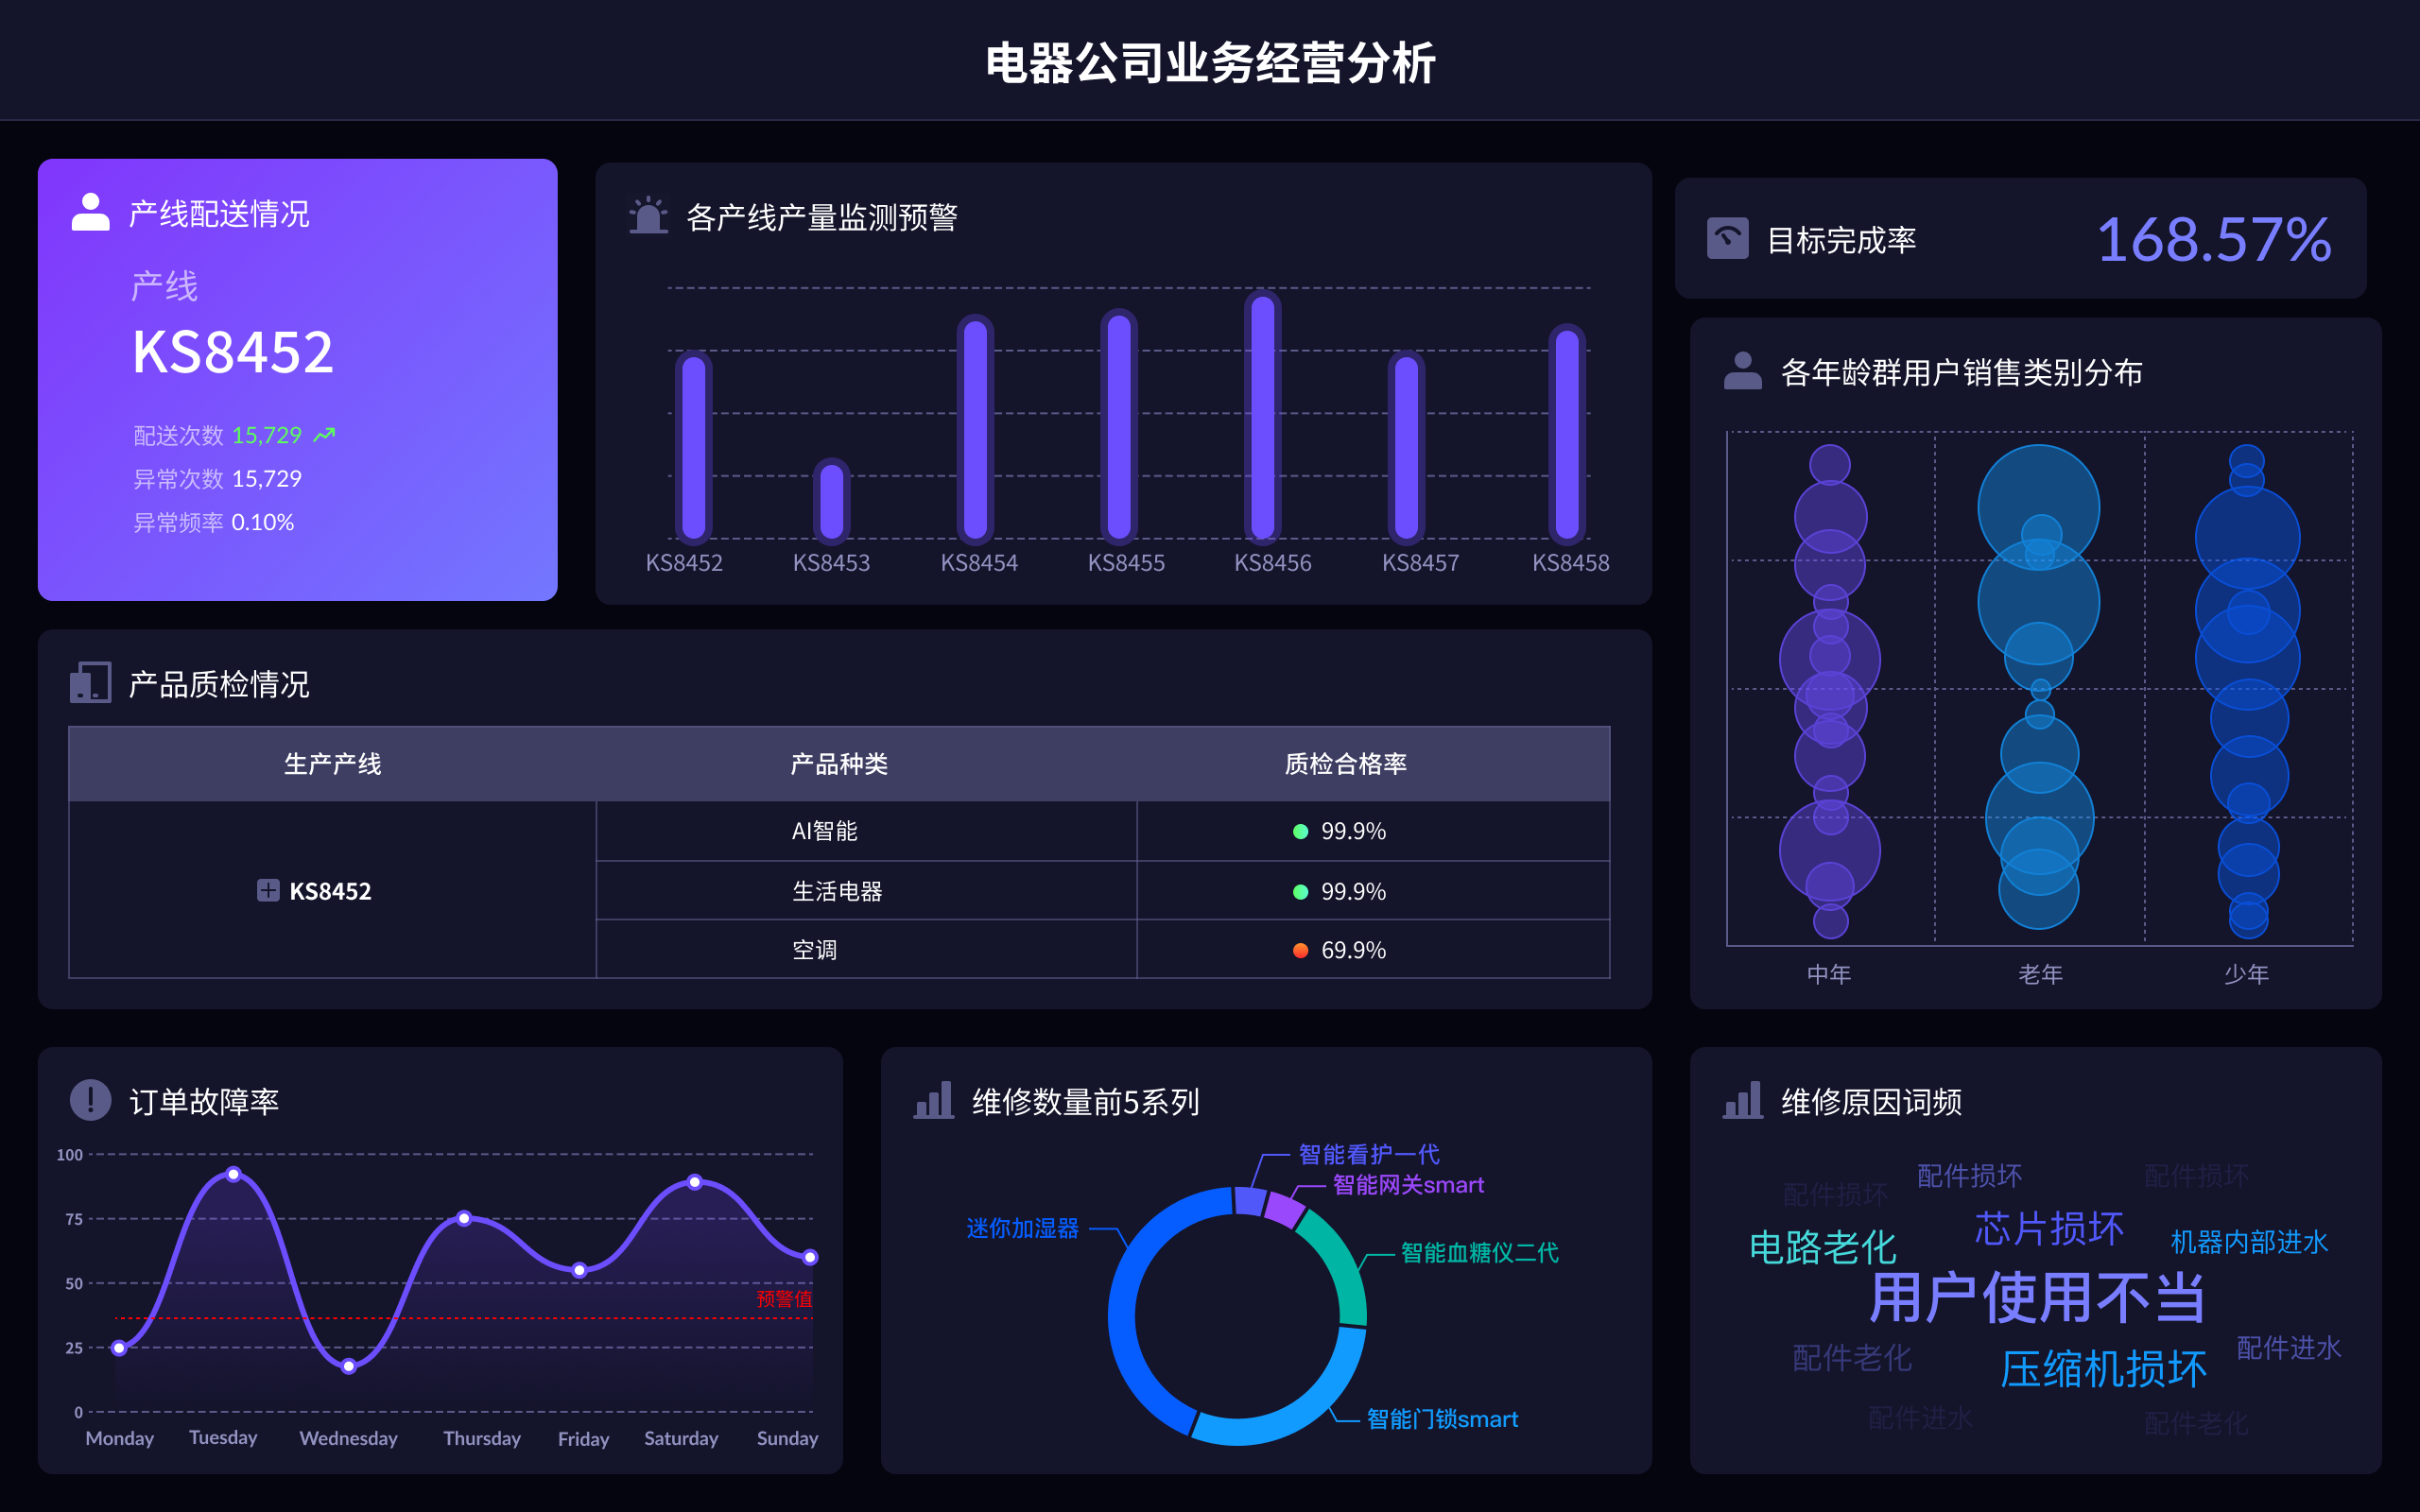
The English term for "可视化大屏" is "Visualization Dashboard" or "Data Visualization Dashboard". A Visualization Dashboard is a powerful tool that allows users to interact with data visually, providing insights through graphical representations such as charts, graphs, and maps. This tool is crucial for data analysis, decision-making, and presenting complex data in a comprehensible format. One of the primary benefits of a visualization dashboard is that it enables real-time data monitoring, which is essential for timely and informed decisions.
I、INTRODUCTION TO VISUALIZATION DASHBOARD
A Visualization Dashboard is a dynamic interface that consolidates and visualizes data from various sources, allowing users to monitor, analyze, and manage information effectively. These dashboards are widely used across different sectors, including business, healthcare, education, and government, to transform raw data into actionable insights. The main features include interactive charts, real-time data updates, customizable views, and data drill-down capabilities.
II、BENEFITS OF VISUALIZATION DASHBOARDS
Real-time Data Monitoring: This feature is crucial for making timely decisions. Visualization dashboards provide up-to-date information, enabling users to react swiftly to changes and trends.
Enhanced Data Understanding: By transforming raw data into visual formats, dashboards make it easier for users to comprehend complex information quickly. This visual representation helps in identifying patterns, trends, and outliers.
Improved Decision-Making: With all critical data presented in one place, decision-makers can quickly access the information they need, leading to more informed and effective decisions.
Customization and Flexibility: Dashboards can be tailored to meet the specific needs of different users. This customization ensures that users can focus on the most relevant data for their roles.
Collaboration and Sharing: Visualization dashboards facilitate better communication and collaboration among team members by providing a shared platform for data analysis and reporting.
III、KEY COMPONENTS OF A VISUALIZATION DASHBOARD
Data Sources Integration: Dashboards pull data from various sources such as databases, APIs, and spreadsheets, providing a unified view of information.
Visualization Tools: These tools include charts, graphs, maps, and tables that help in presenting data visually. Common types of visualizations used are bar charts, line charts, pie charts, scatter plots, and heat maps.
Interactive Features: Features like filtering, zooming, and drill-down allow users to interact with the data, exploring different aspects and gaining deeper insights.
Real-time Updates: Dashboards that update in real-time ensure that the displayed data is always current, which is vital for monitoring ongoing processes and events.
User Interface Design: A well-designed interface is crucial for usability. It should be intuitive, responsive, and easy to navigate, ensuring that users can efficiently access and interpret the data.
IV、APPLICATIONS OF VISUALIZATION DASHBOARDS
Business Intelligence: Companies use dashboards to track key performance indicators (KPIs), sales figures, and other critical business metrics, enabling strategic planning and performance management.
Healthcare: In healthcare, dashboards are used to monitor patient data, manage hospital resources, and track the spread of diseases, facilitating better healthcare delivery and resource allocation.
Education: Educational institutions utilize dashboards to track student performance, manage administrative data, and analyze trends in education, aiding in improving educational outcomes.
Government: Governments use dashboards for various purposes, including tracking public health statistics, managing city resources, and monitoring public services, enhancing governance and public service delivery.
Finance: Financial institutions employ dashboards to monitor market trends, track financial performance, and manage risk, supporting better financial decision-making.
V、IMPLEMENTING A VISUALIZATION DASHBOARD
Define Objectives: Clearly outline the goals and objectives of the dashboard. Understanding what you aim to achieve will guide the design and implementation process.
Identify Data Sources: Determine the data sources that will be integrated into the dashboard. Ensure that these sources are reliable and provide the necessary data.
Choose the Right Tools: Select the appropriate visualization tools and software that meet your requirements. Popular tools include Tableau, Power BI, and FineReport.
Design the Dashboard: Focus on creating a user-friendly interface. Organize the data logically, and use visual elements that enhance understanding without cluttering the dashboard.
Test and Iterate: Before full deployment, test the dashboard with a small group of users. Gather feedback and make necessary adjustments to improve functionality and usability.
Deployment and Training: Deploy the dashboard and provide training to users to ensure they can effectively utilize the tool. Continuous support and updates are crucial for maintaining the dashboard’s effectiveness.
VI、FUTURE TRENDS IN VISUALIZATION DASHBOARDS
Artificial Intelligence and Machine Learning: Incorporating AI and ML can enhance the capabilities of dashboards by providing predictive analytics and automated insights.
Increased Interactivity: Future dashboards will likely offer more advanced interactive features, allowing users to engage with the data in more meaningful ways.
Integration with IoT: As the Internet of Things (IoT) expands, dashboards will integrate data from a wide array of connected devices, offering more comprehensive insights.
Enhanced Data Security: With growing concerns over data privacy, future dashboards will incorporate stronger security measures to protect sensitive information.
Cloud-Based Solutions: The shift towards cloud-based dashboards will continue, providing scalability, accessibility, and real-time data integration.
In conclusion, Visualization Dashboards are essential tools for data analysis and decision-making, offering numerous benefits through their real-time data monitoring, enhanced data understanding, and customizable features. Their applications span various sectors, providing valuable insights and improving operational efficiency. As technology advances, these dashboards will continue to evolve, incorporating new features and capabilities to meet the growing demands of data-driven decision-making.
For more information on visualization tools, visit FineReport and FineVis, which offer comprehensive solutions for data visualization and analysis.
相关问答FAQs:
可视化大屏英文叫什么名称?
可视化大屏在英文中通常称为“Visualization Dashboard”或“Data Visualization Screen”。这些术语指的是用于展示数据的图形化界面,能够以直观的方式呈现复杂的信息。它们广泛应用于商业分析、项目管理、运营监控等领域,帮助用户快速理解数据趋势和关系。
在商业环境中,Visualization Dashboard 通常集成了各种数据源,通过图表、图形和地图等多种形式展示信息。使用这些工具,决策者可以实时监控关键指标,进行数据分析,从而做出更明智的商业决策。大屏幕可视化的设计也越来越注重用户体验,确保信息的可读性和易用性。
可视化大屏的主要应用领域有哪些?
可视化大屏的应用领域非常广泛,包括但不限于以下几个方面:
-
商业智能与分析:在商业智能领域,Visualization Dashboard 被用来展示销售数据、市场趋势和客户行为。企业利用这些可视化工具,能够快速识别业务机会和潜在问题。
-
运营监控:在制造业和服务行业中,大屏可视化用于实时监控生产线、设备状态和服务质量。通过实时数据展示,企业可以迅速响应异常情况,优化运营效率。
-
公共安全与交通管理:在城市管理中,Visualization Dashboard 可以集成交通流量、公共安全事件等数据,帮助管理者实时掌握城市运行状态,做出及时决策。
-
医疗健康:在医疗行业,通过可视化大屏展示患者信息、疾病流行趋势等,可以帮助医生和管理者更有效地进行医疗资源分配和决策。
-
教育与培训:在教育机构中,Visualization Dashboard 可以用来展示学生成绩、课程进度和教学效果,帮助教师和管理者优化教学方案。
如何选择合适的可视化大屏工具?
选择合适的可视化大屏工具需要考虑多个因素,包括需求、预算和用户体验等。以下是一些建议:
-
明确需求:在选择之前,首先需要明确使用可视化大屏的目的。是为了展示实时数据,还是进行历史数据分析?不同的需求会影响工具的选择。
-
用户友好性:选择一个直观易用的工具非常重要。用户界面应清晰,功能应易于理解和操作,以确保所有用户都能快速上手。
-
数据集成能力:确保所选工具能够与现有的数据源和系统集成。良好的数据集成能力可以实现数据的实时更新和准确展示。
-
可定制性:一个好的可视化工具应允许用户根据自己的需求进行定制。无论是图表类型、颜色还是布局,定制能力都能提升用户的使用体验。
-
预算考虑:不同的可视化工具价格差异很大。需要根据预算进行合理选择,确保所选工具在性能和价格之间达到平衡。
-
支持与培训:选择提供良好技术支持和培训的供应商,可以在实施过程中减少问题和提高使用效率。
通过综合考虑这些因素,可以找到最适合自己需求的可视化大屏工具,提升工作效率和决策能力。
本文内容通过AI工具匹配关键字智能整合而成,仅供参考,帆软不对内容的真实、准确或完整作任何形式的承诺。具体产品功能请以帆软官方帮助文档为准,或联系您的对接销售进行咨询。如有其他问题,您可以通过联系blog@fanruan.com进行反馈,帆软收到您的反馈后将及时答复和处理。


