search("knowledge visualization tools 2024")mclick(["0", "1", "2", "4", "10"])
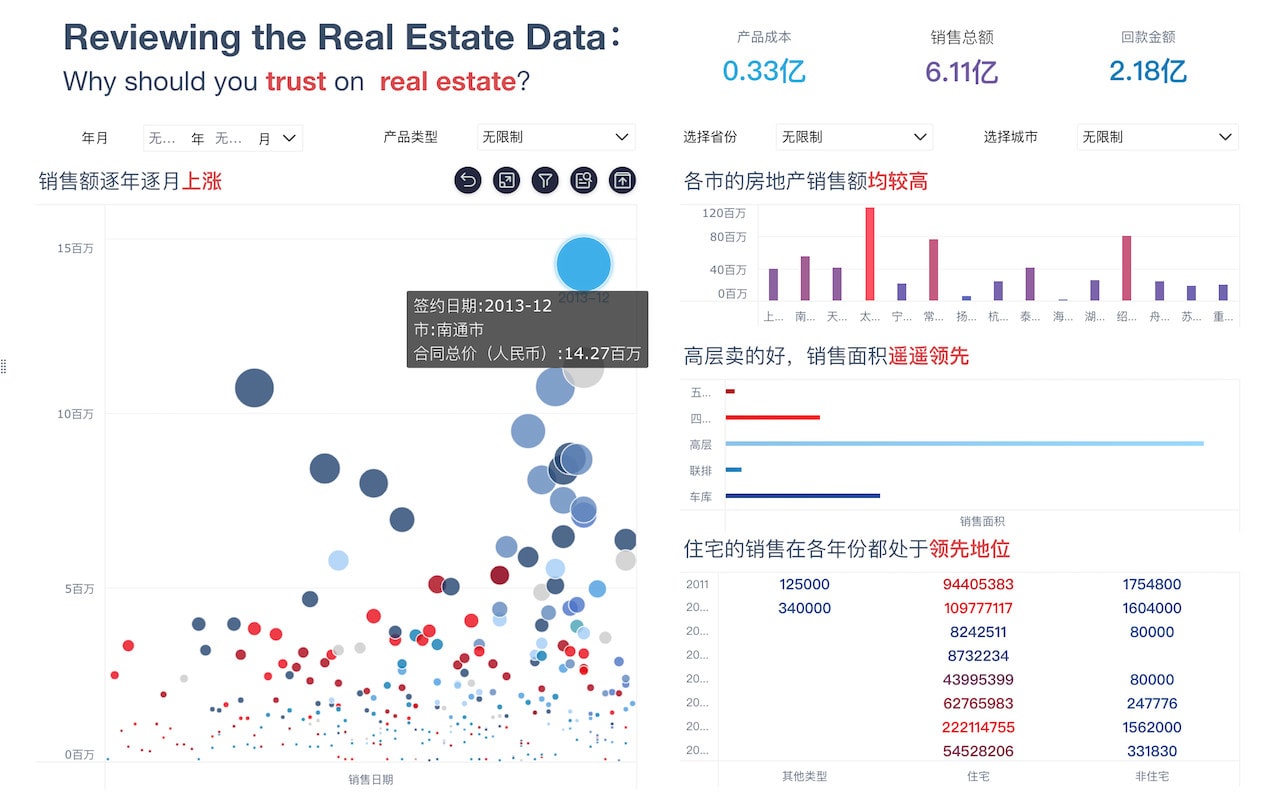
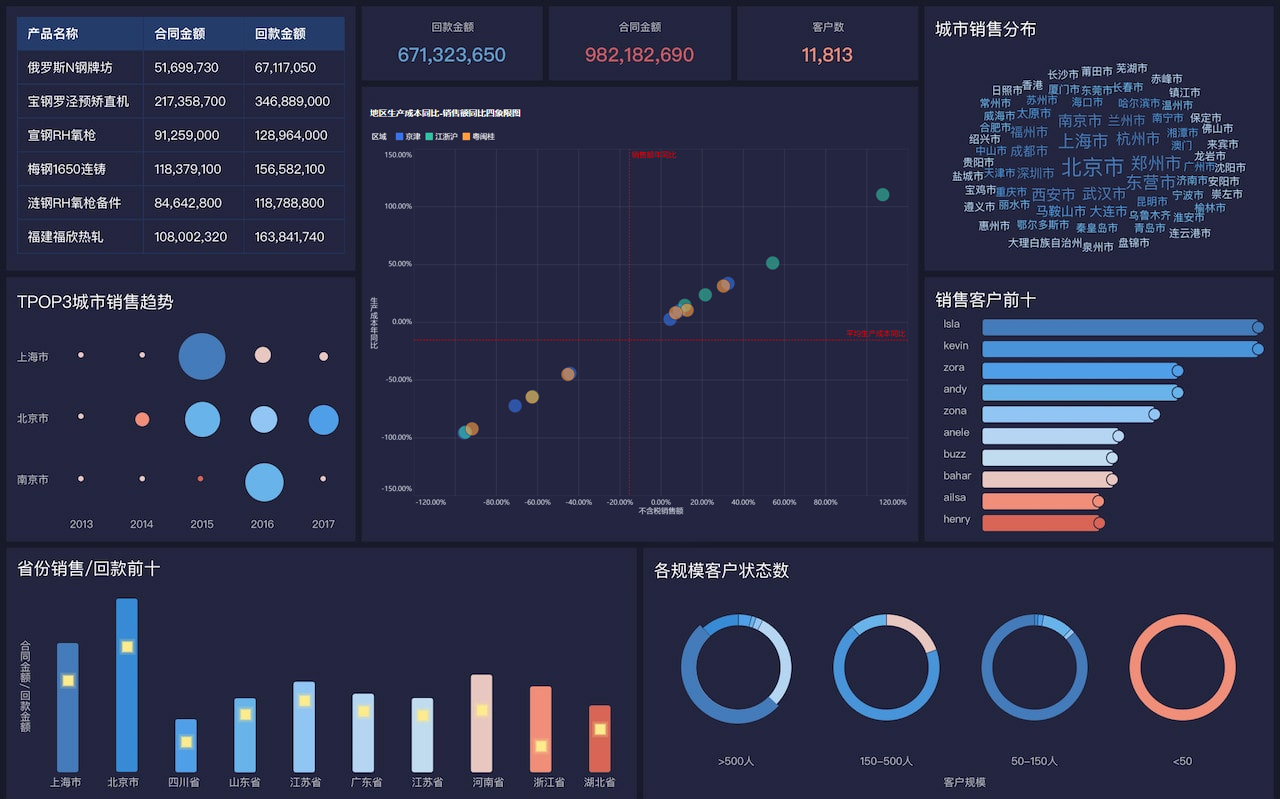
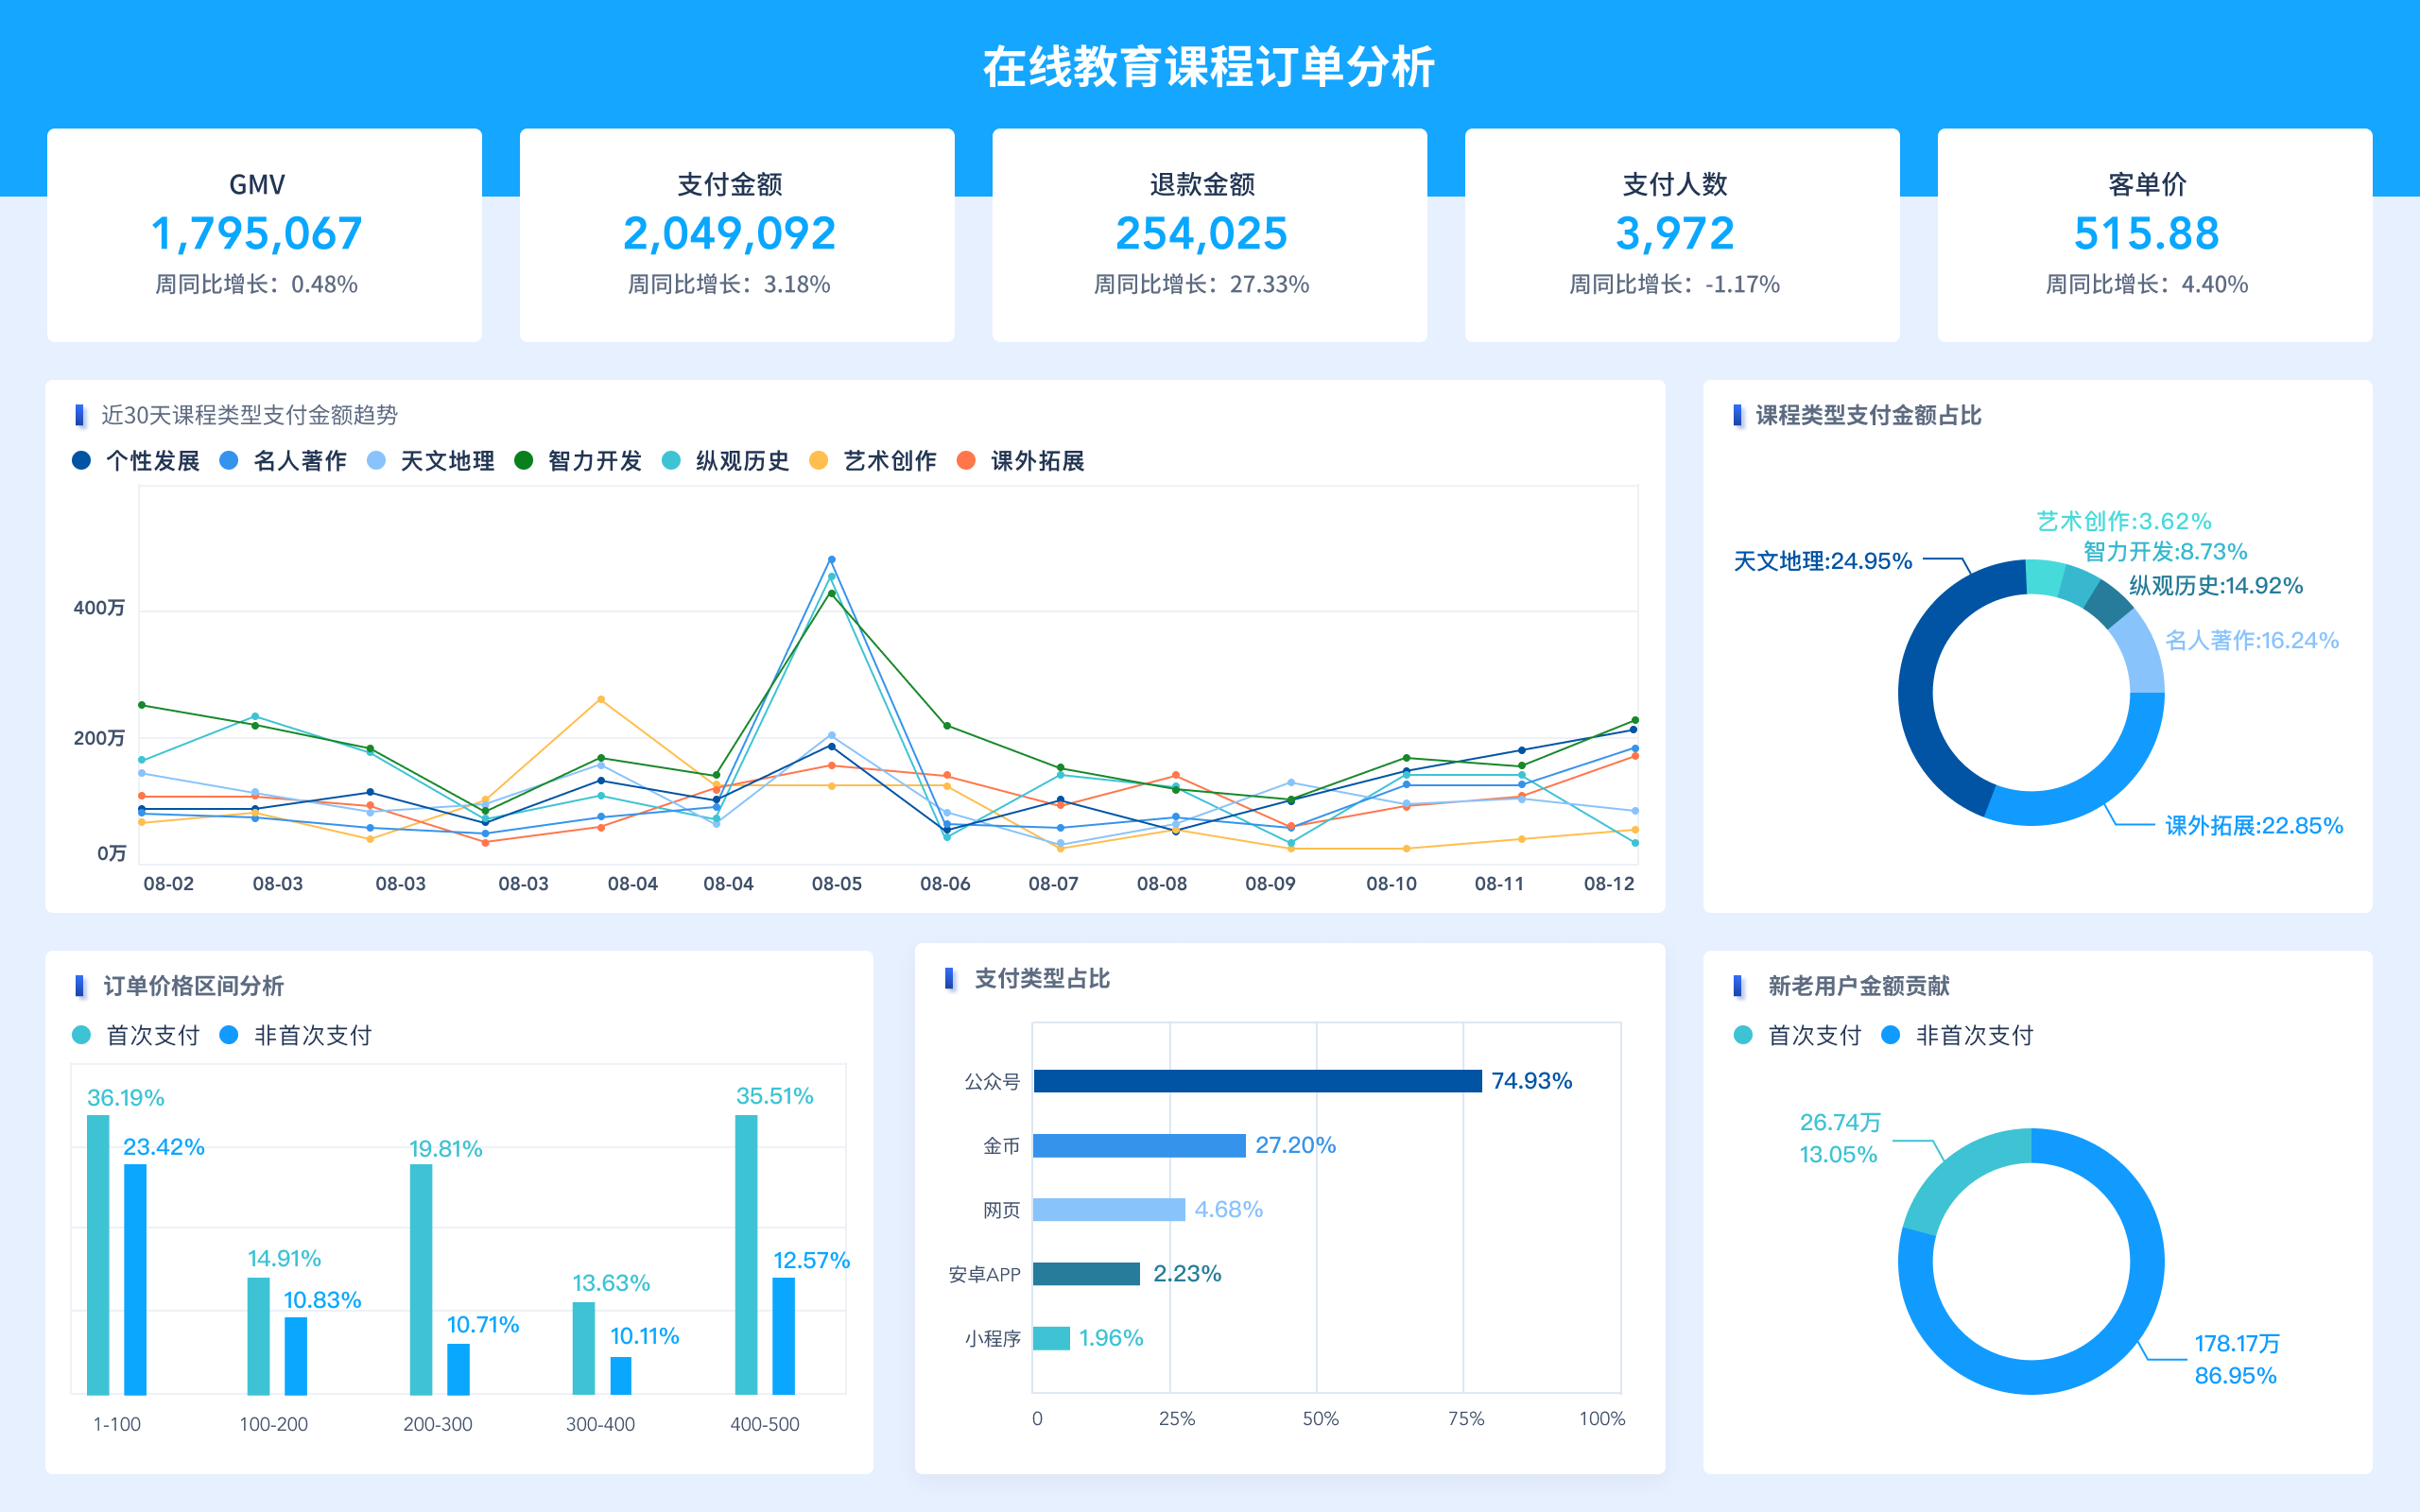
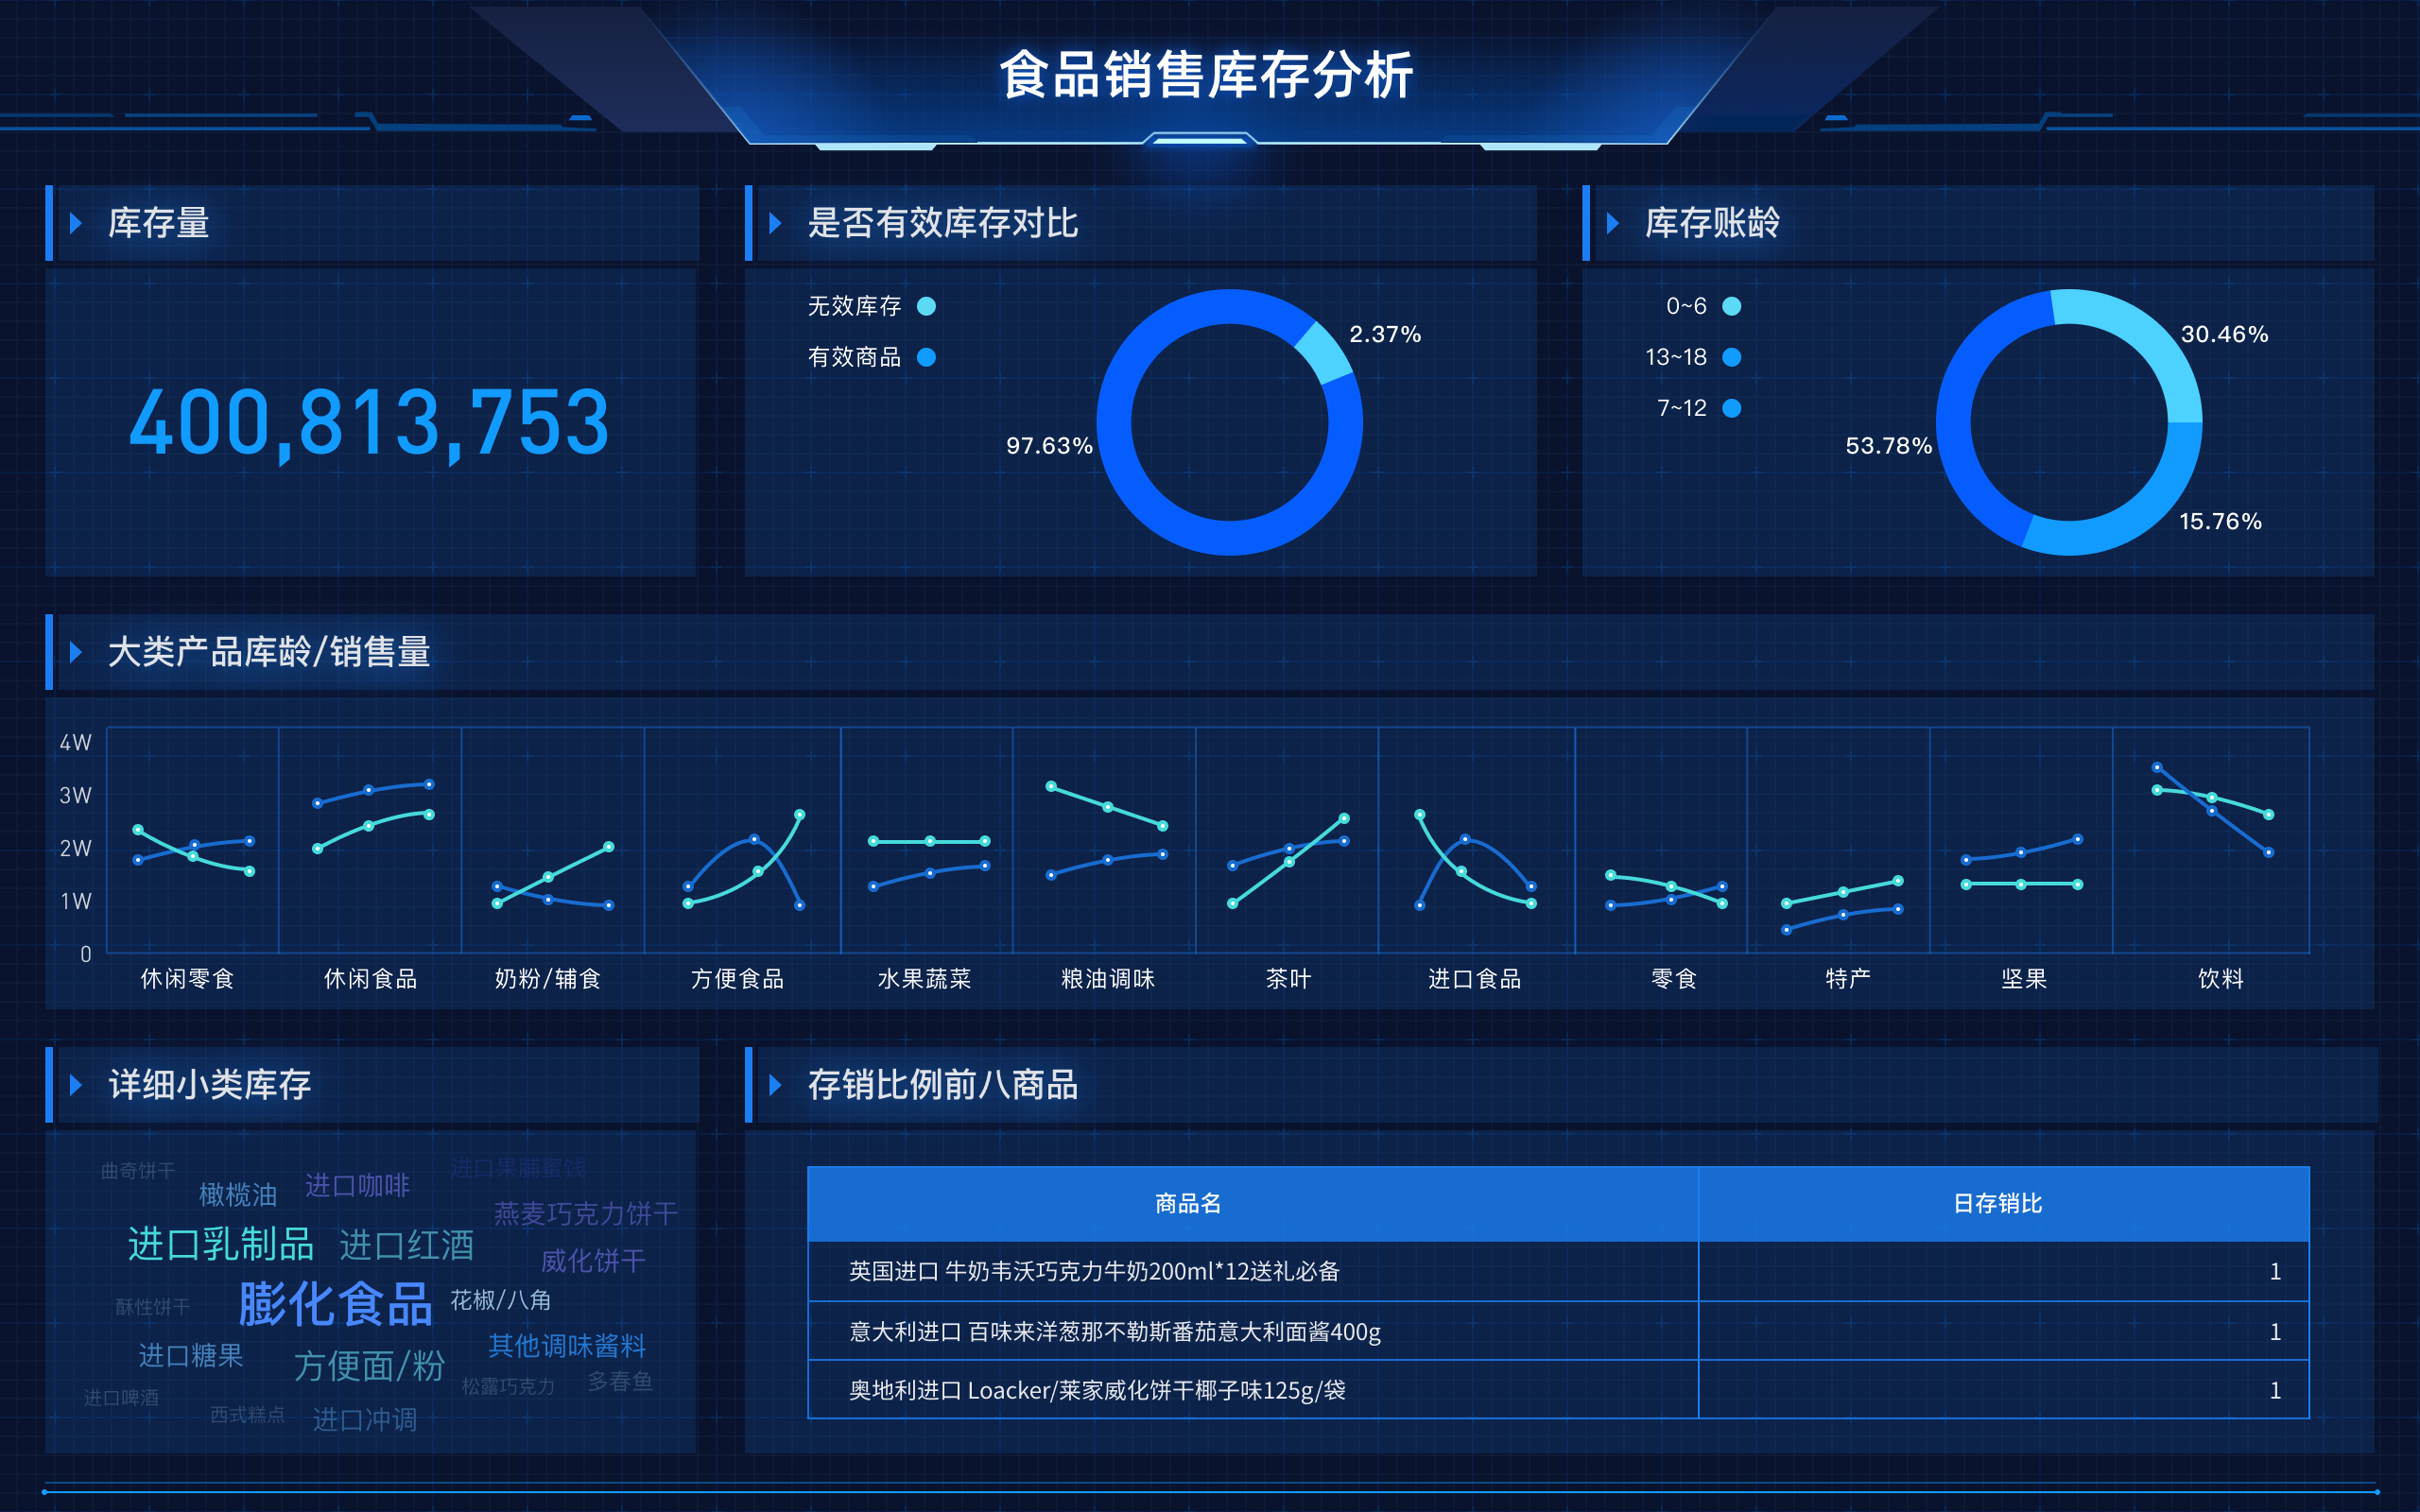
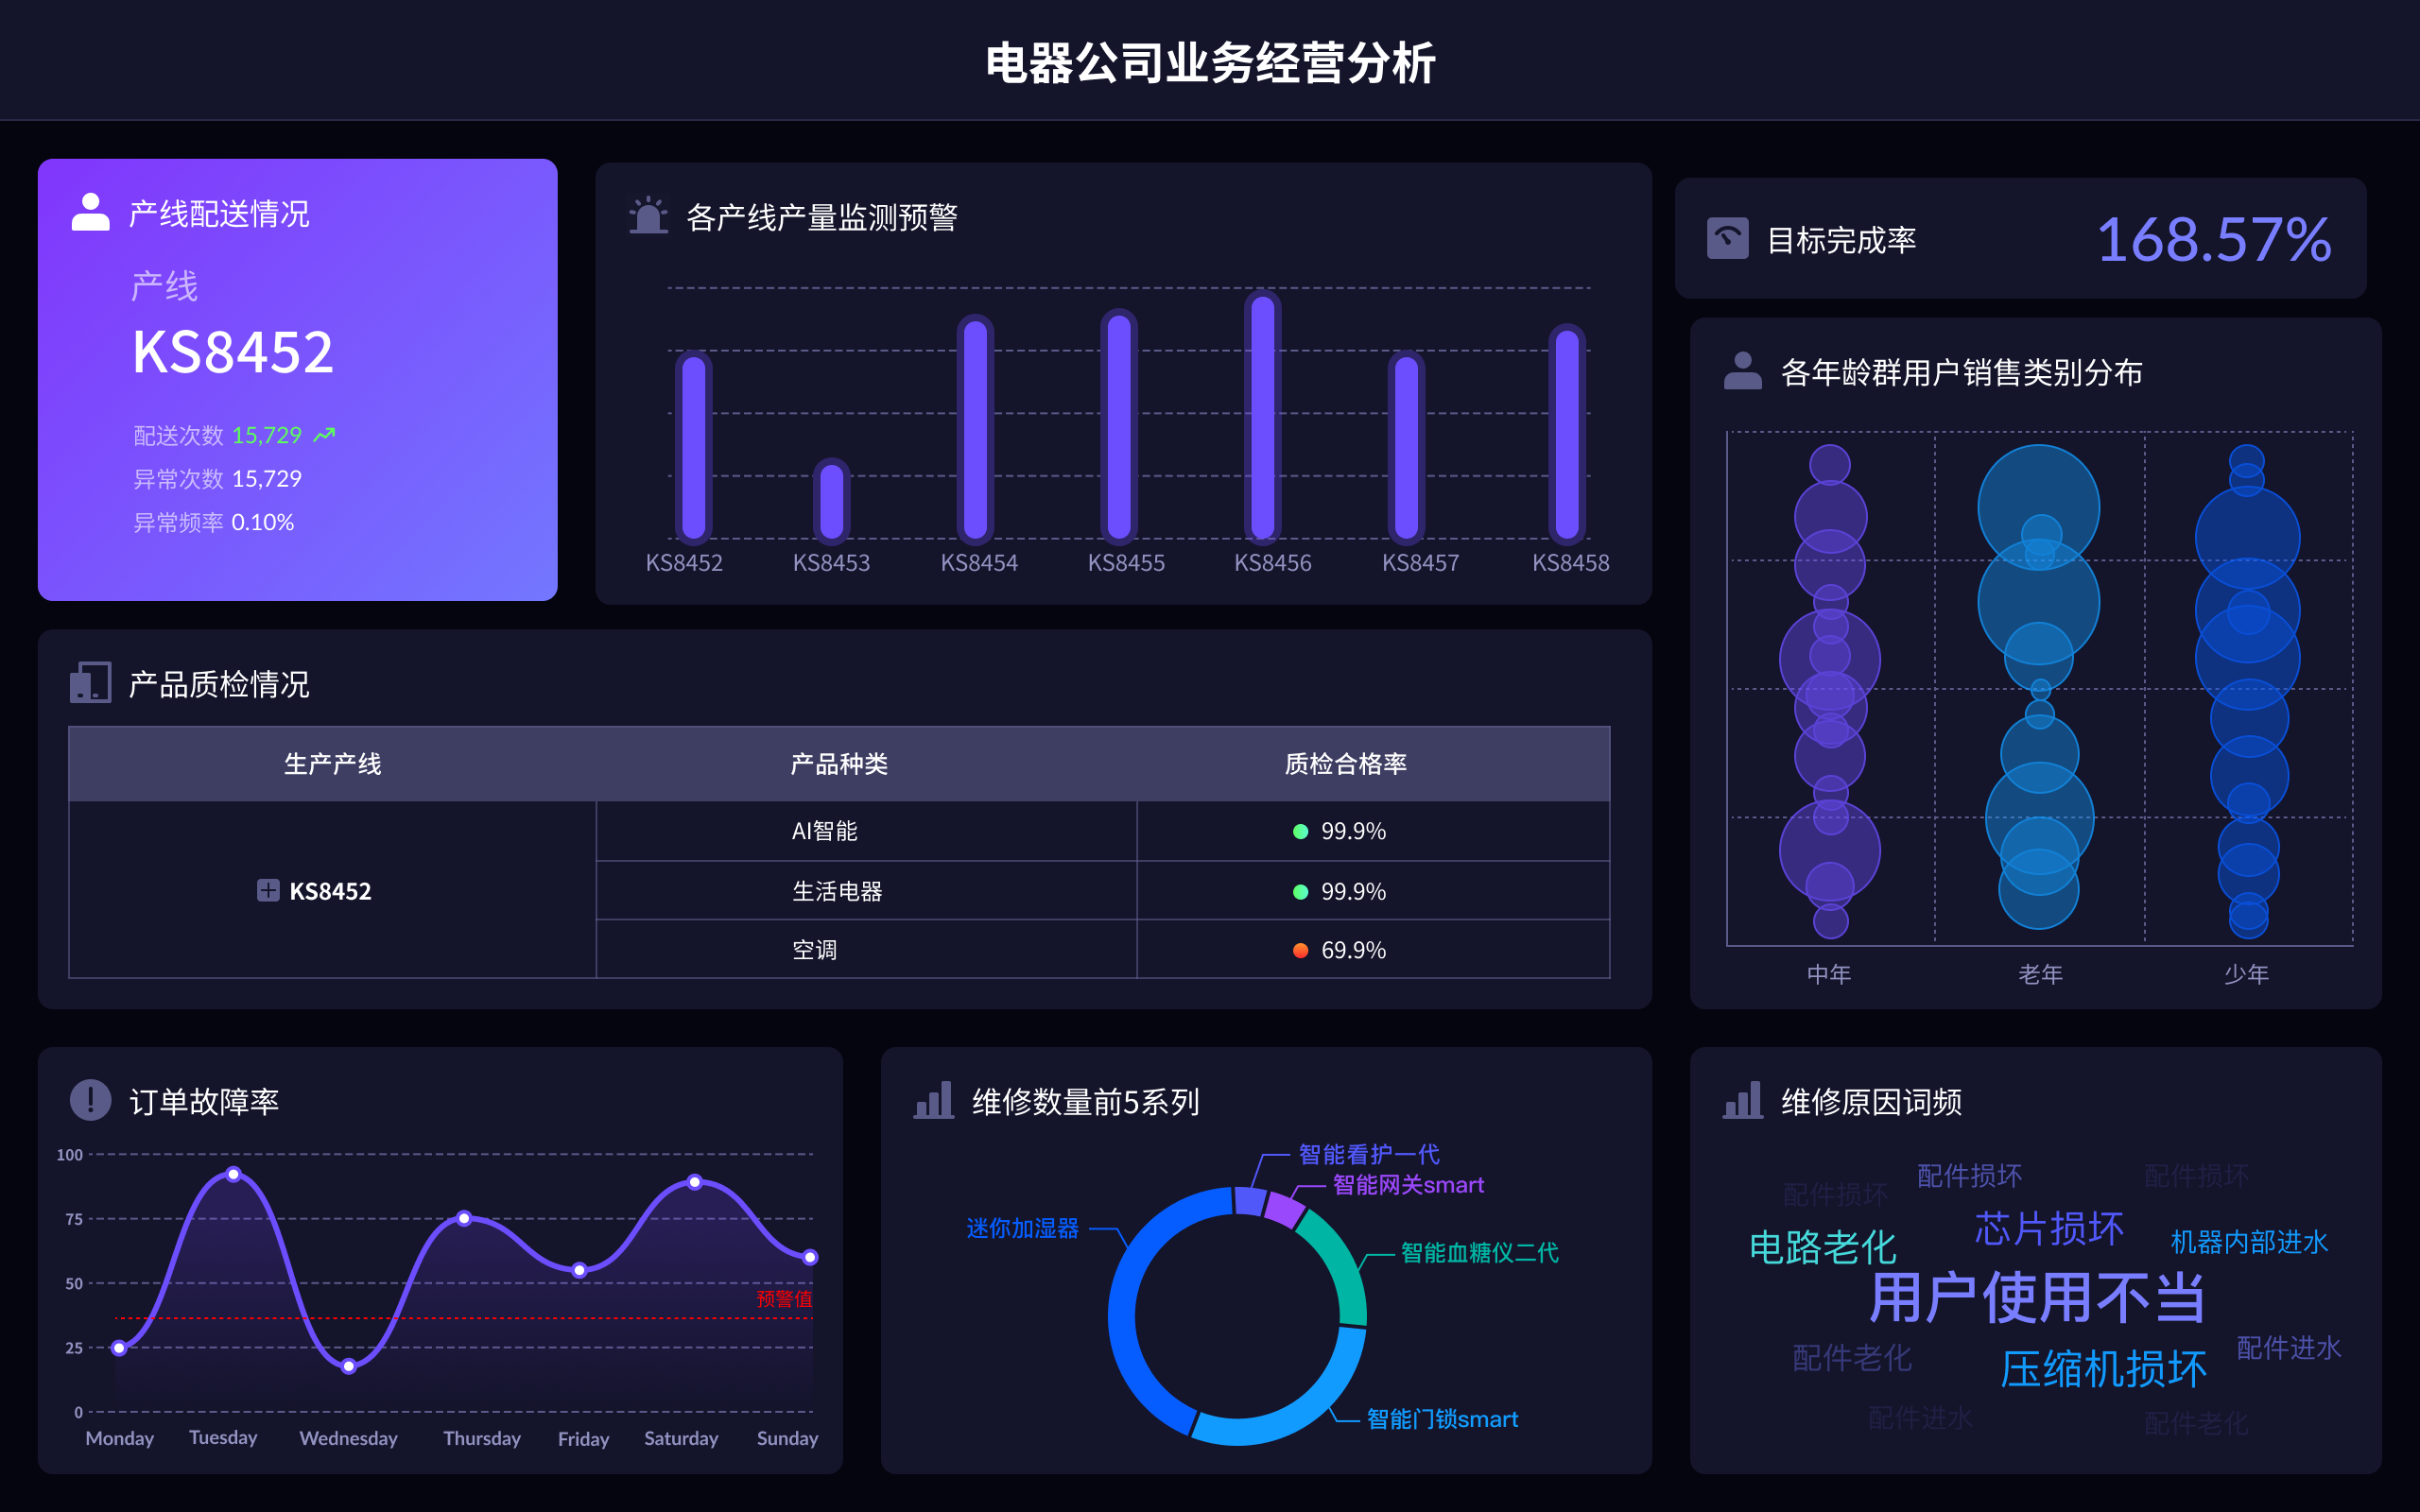
Knowledge visualization tools are essential for transforming complex data into understandable and actionable insights. Some top tools for knowledge visualization include Tableau、Microsoft Power BI、Qlik Sense、Google Data Studio、FineReport、FineVis、Sisense. Each tool has unique features and strengths. For instance, Tableau excels in providing interactive and dynamic visualizations, while Microsoft Power BI integrates seamlessly with other Microsoft products, making it a versatile option for businesses already using the Microsoft ecosystem. Let's dive deeper into these tools to understand their capabilities and how they can be utilized effectively.
一、TABLEAU
Tableau is known for its robust data visualization capabilities and ease of use. It allows users to create interactive and shareable dashboards, which can be integrated into various platforms. Tableau supports a wide range of data sources, making it versatile for different industries and applications. Key features include its drag-and-drop interface, real-time collaboration, and extensive customization options. Tableau's ability to handle big data and provide powerful analytics makes it a favorite among data professionals.
二、MICROSOFT POWER BI
Microsoft Power BI offers a comprehensive suite for business analytics, allowing users to visualize and share insights across their organization. It integrates well with Excel and other Microsoft products, providing a familiar interface for users. Power BI features include interactive dashboards, AI-driven insights, and strong data connectivity. Its affordability and scalability make it suitable for businesses of all sizes. Additionally, Power BI's robust data modeling capabilities allow users to prepare and analyze complex datasets efficiently.
三、QLIK SENSE
Qlik Sense is designed for self-service data analytics, enabling users to explore and visualize data freely. It uses an associative data model that allows users to uncover hidden insights by exploring data relationships. Qlik Sense offers an intuitive interface, mobile accessibility, and powerful analytics capabilities. Users can create customized dashboards and reports with ease, making it a valuable tool for both technical and non-technical users.
四、GOOGLE DATA STUDIO
Google Data Studio provides an accessible platform for creating data visualizations and reports. It integrates seamlessly with other Google services such as Google Analytics and BigQuery, making it an excellent choice for users within the Google ecosystem. Key features include real-time data updates, interactive dashboards, and extensive data source connectivity. Google Data Studio's user-friendly interface and collaborative features enhance its appeal for teams and organizations looking to leverage their data effectively.
五、FINEREPORT
FineReport is a professional reporting tool that excels in enterprise-level data management and visualization. It supports large-scale data integration and provides advanced reporting capabilities. Features include drag-and-drop report design, multi-source data integration, and real-time data updates. FineReport's focus on data accuracy and security makes it a reliable choice for businesses looking to maintain high standards in their reporting processes. More information can be found on the FineReport official website.
六、FINEVIS
FineVis is another powerful tool from FanRuan, designed specifically for creating dynamic and interactive data visualizations. It offers a range of visualization options, including charts, graphs, and dashboards, tailored to meet diverse business needs. FineVis features include easy-to-use interfaces, real-time collaboration, and extensive customization options. It is suitable for both technical and non-technical users aiming to make data-driven decisions. For more details, visit the FineVis official website.
七、SISENSE
Sisense is known for its ability to handle large datasets and provide deep insights through embedded analytics and AI-driven features. It integrates data from various sources and allows users to create interactive dashboards. Key features include end-to-end data management, scalability, and robust integration capabilities. Sisense's advanced analytics and customization options cater to the needs of businesses looking for comprehensive data solutions.
八、OTHER NOTABLE TOOLS
Other notable tools in the knowledge visualization landscape include Looker, Plotly, and Infogram. Looker is praised for its data exploration capabilities and user-friendly interface. Plotly is popular among data scientists for its advanced charting options and customization. Infogram is a web-based tool that allows users to create visually appealing infographics and reports easily.
In summary, the choice of a knowledge visualization tool depends on the specific needs of your organization, including data sources, user expertise, and the type of insights required. Each tool mentioned offers unique strengths, making them suitable for different applications and industries(25 Best Data Visualization Tools for 2024)(10 Best Data Visualization Tools for 2024: Detailed Analysis)( Vegavid).
相关问答FAQs:
知识可视化工具有哪些?
知识可视化工具是用来帮助用户以图形和图表的方式展示和理解信息的工具。它们在教育、商业、科研等多个领域都得到了广泛应用。以下是一些知名的知识可视化工具:
-
MindMeister:这是一款在线思维导图工具,允许用户通过简单的拖放操作创建思维导图。它支持实时协作,适合团队讨论和头脑风暴。用户可以在导图中添加图像、链接和注释,使信息更生动。
-
Lucidchart:这是一款强大的图表创建工具,支持流程图、组织结构图、网络图等多种图形的绘制。它提供了丰富的模板库和形状库,用户可以轻松地创建专业的可视化内容。Lucidchart还支持与Google Drive、Microsoft Office等多种应用集成。
-
Tableau:这是一款数据可视化工具,适用于将复杂数据转化为易于理解的图形。用户可以通过拖放操作创建交互式仪表板和报告。Tableau支持多种数据源,可以处理大量数据,并提供实时分析功能。
-
Canva:虽然Canva主要是一款设计工具,但它也提供了许多数据可视化的功能。用户可以使用它来创建信息图、演示文稿和社交媒体图形等,适合需要快速制作视觉内容的用户。
-
Microsoft Visio:这是微软的一款专业图表软件,适用于创建流程图、网络图、组织结构图等。Visio提供了丰富的模板和形状,适合企业用户进行复杂信息的可视化。
-
Miro:这是一个在线白板平台,支持团队实时协作。用户可以在上面创建思维导图、流程图、用户旅程图等,适合进行头脑风暴和项目管理。
-
Coggle:这是一款简单易用的在线思维导图工具,用户可以通过分支结构展示信息。Coggle支持实时协作,适合团队共同讨论和整理思路。
-
Piktochart:这是一款专注于信息图和演示文稿制作的工具,用户可以通过简单的拖放操作创建视觉内容。Piktochart提供了丰富的模板和图标,适合不具备设计背景的用户。
-
Prezi:与传统幻灯片不同,Prezi使用缩放和平移的方式展示信息,适合创建动态的演示文稿。用户可以在一个大画布上组织内容,呈现出更具视觉冲击力的效果。
-
XMind:这是一款专业的思维导图软件,提供多种布局和样式,用户可以轻松创建复杂的思维导图。XMind支持导出为多种格式,方便用户分享和使用。
如何选择合适的知识可视化工具?
选择合适的知识可视化工具时,首先需要考虑自己的需求和使用场景。不同工具在功能和适用性上都有所不同。以下是一些选择时需要考虑的因素:
-
功能需求:根据你需要创建的可视化类型选择工具。如果需要制作思维导图,MindMeister和XMind都是很好的选择;如果需要处理数据并进行分析,Tableau可能更适合。
-
用户体验:界面的友好程度和操作的简便性也很重要。选择一个易于上手的工具,可以节省学习时间,提高工作效率。
-
协作功能:如果团队成员需要共同编辑和讨论,选择支持实时协作的工具,如Miro或Lucidchart,会更为合适。
-
预算:许多可视化工具提供免费的基础版本,但功能可能有限。如果需要更多高级功能,可以考虑付费版本。评估预算后选择性价比高的工具。
-
集成能力:如果你在日常工作中使用其他软件,选择能够与这些软件集成的可视化工具,可以提高工作效率。例如,Lucidchart可以与Google Drive和Microsoft Office无缝集成。
-
支持和社区:良好的客户支持和活跃的用户社区可以帮助你更快地解决问题。选择那些提供丰富文档和用户支持的工具,会让使用体验更顺畅。
知识可视化工具的应用场景有哪些?
知识可视化工具的应用场景非常广泛,几乎涵盖了教育、商业、科研等各个领域。以下是一些具体的应用场景:
-
教育领域:教师可以使用可视化工具来创建生动的课程内容,帮助学生更好地理解复杂概念。思维导图可以帮助学生整理知识结构,促进学习。
-
项目管理:团队可以使用可视化工具进行项目规划和进度跟踪。流程图可以清晰地展示工作流程,帮助团队成员理清任务。
-
业务分析:企业可以利用数据可视化工具分析市场趋势和业务绩效。通过图表和仪表板,管理层可以快速获取关键信息,做出数据驱动的决策。
-
科研工作:研究人员可以使用可视化工具展示研究结果,帮助同行理解复杂的数据和结论。信息图可以有效地传播研究成果,提高可见性。
-
市场营销:市场营销团队可以利用可视化工具制作吸引人的宣传材料和报告,展示市场调研数据和营销效果,增强说服力。
-
产品设计:产品经理和设计师可以使用可视化工具创建用户体验流程图,帮助团队理解用户需求和产品功能。
-
战略规划:企业在制定战略时,可以使用可视化工具展示市场分析、竞争环境和SWOT分析,帮助团队理清思路。
通过以上的应用场景,可以看出知识可视化工具在各个领域的价值和重要性。它们不仅提高了信息的可理解性,还促进了团队的沟通和协作,推动了工作效率的提升。
知识可视化工具的未来发展趋势是什么?
随着信息时代的不断发展,知识可视化工具也在不断演进和创新。以下是一些未来的发展趋势:
-
智能化:人工智能和机器学习技术的引入,将使知识可视化工具变得更加智能化。未来的工具可能会通过分析用户行为和偏好,自动推荐合适的可视化方式。
-
交互性增强:未来的可视化工具将更加注重用户交互体验。用户可以通过更直观的方式与数据进行交互,深入探索数据背后的故事。
-
移动端优化:随着移动设备的普及,越来越多的可视化工具将提供移动端支持,让用户随时随地进行信息的创建和分享。
-
数据整合能力提升:未来的工具可能会具备更强的数据整合能力,支持多种数据源的接入,实现更全面的数据可视化。
-
社交分享功能:随着社交媒体的流行,未来的可视化工具可能会更注重社交分享功能,用户可以轻松地将自己的可视化作品分享给更广泛的受众。
-
虚拟现实和增强现实:虚拟现实(VR)和增强现实(AR)技术的应用将为知识可视化带来新的可能性。用户可以在沉浸式环境中探索复杂的数据和信息。
知识可视化工具的不断创新与发展,将进一步促进信息的传播与理解,使得各行各业的用户都能更有效地利用数据和知识。
本文内容通过AI工具匹配关键字智能整合而成,仅供参考,帆软不对内容的真实、准确或完整作任何形式的承诺。具体产品功能请以帆软官方帮助文档为准,或联系您的对接销售进行咨询。如有其他问题,您可以通过联系blog@fanruan.com进行反馈,帆软收到您的反馈后将及时答复和处理。


