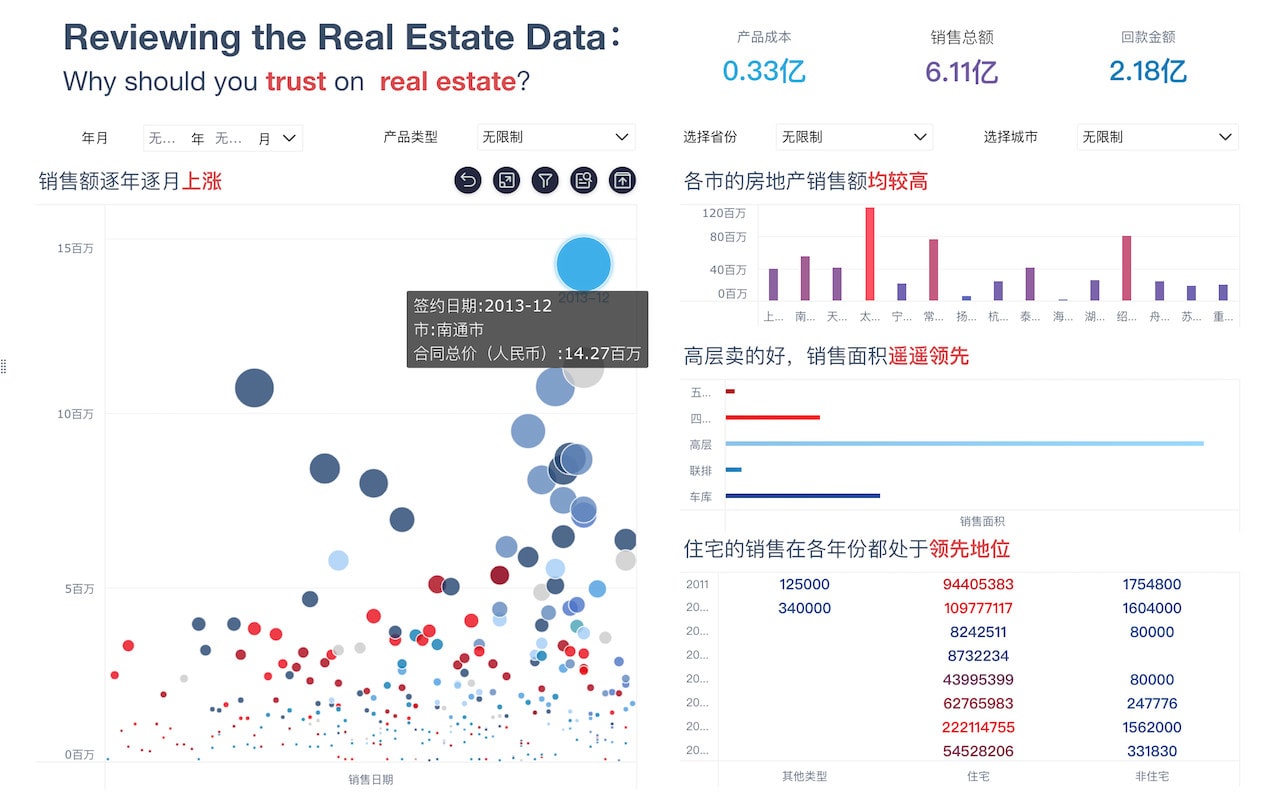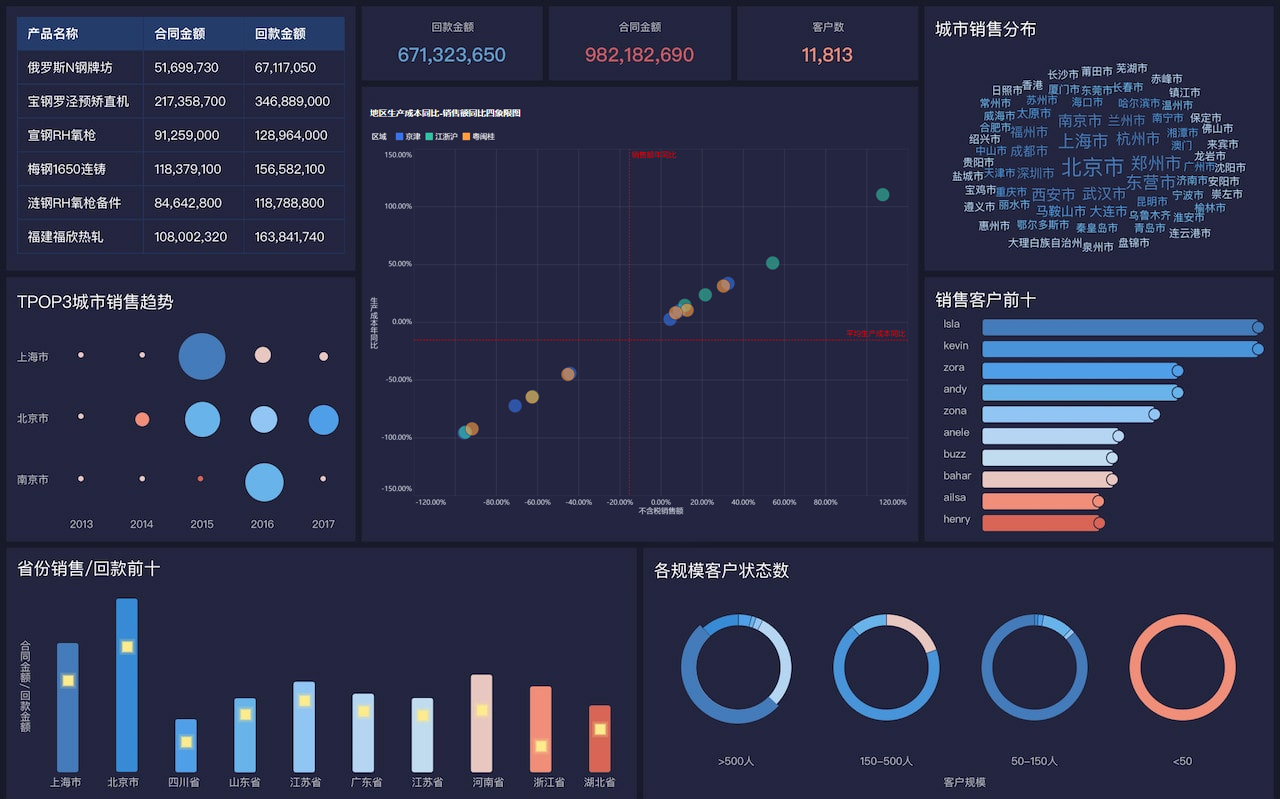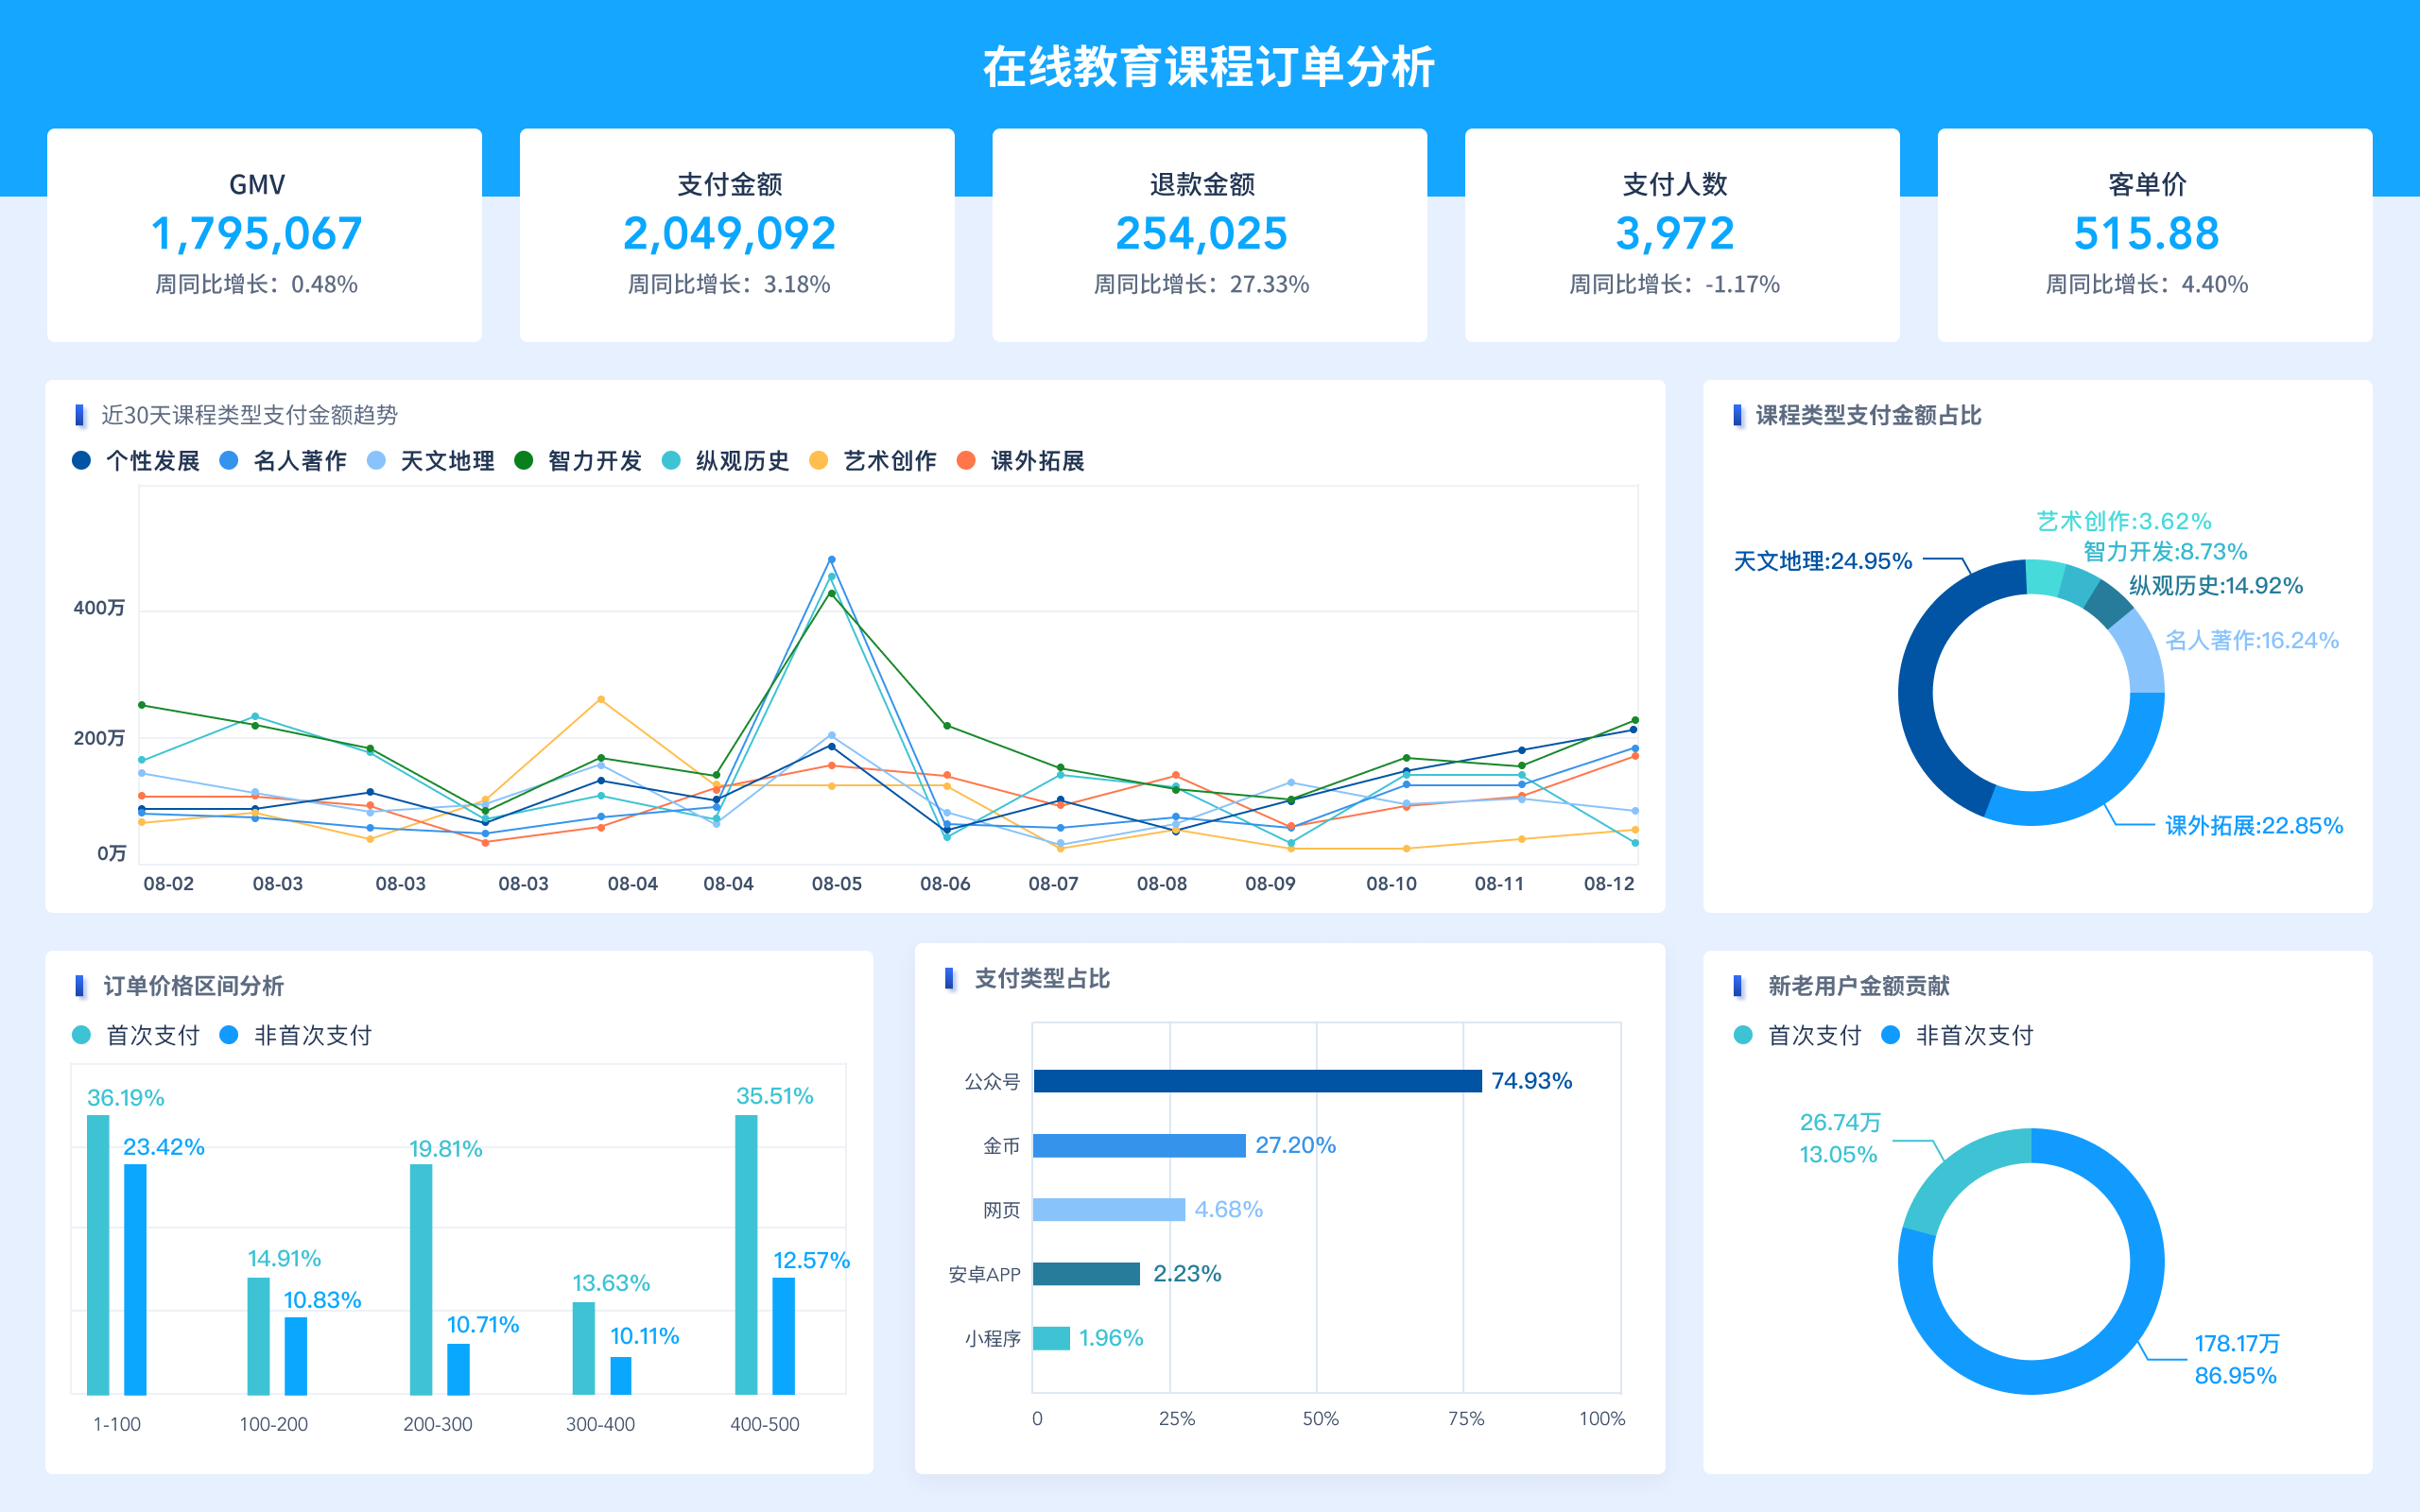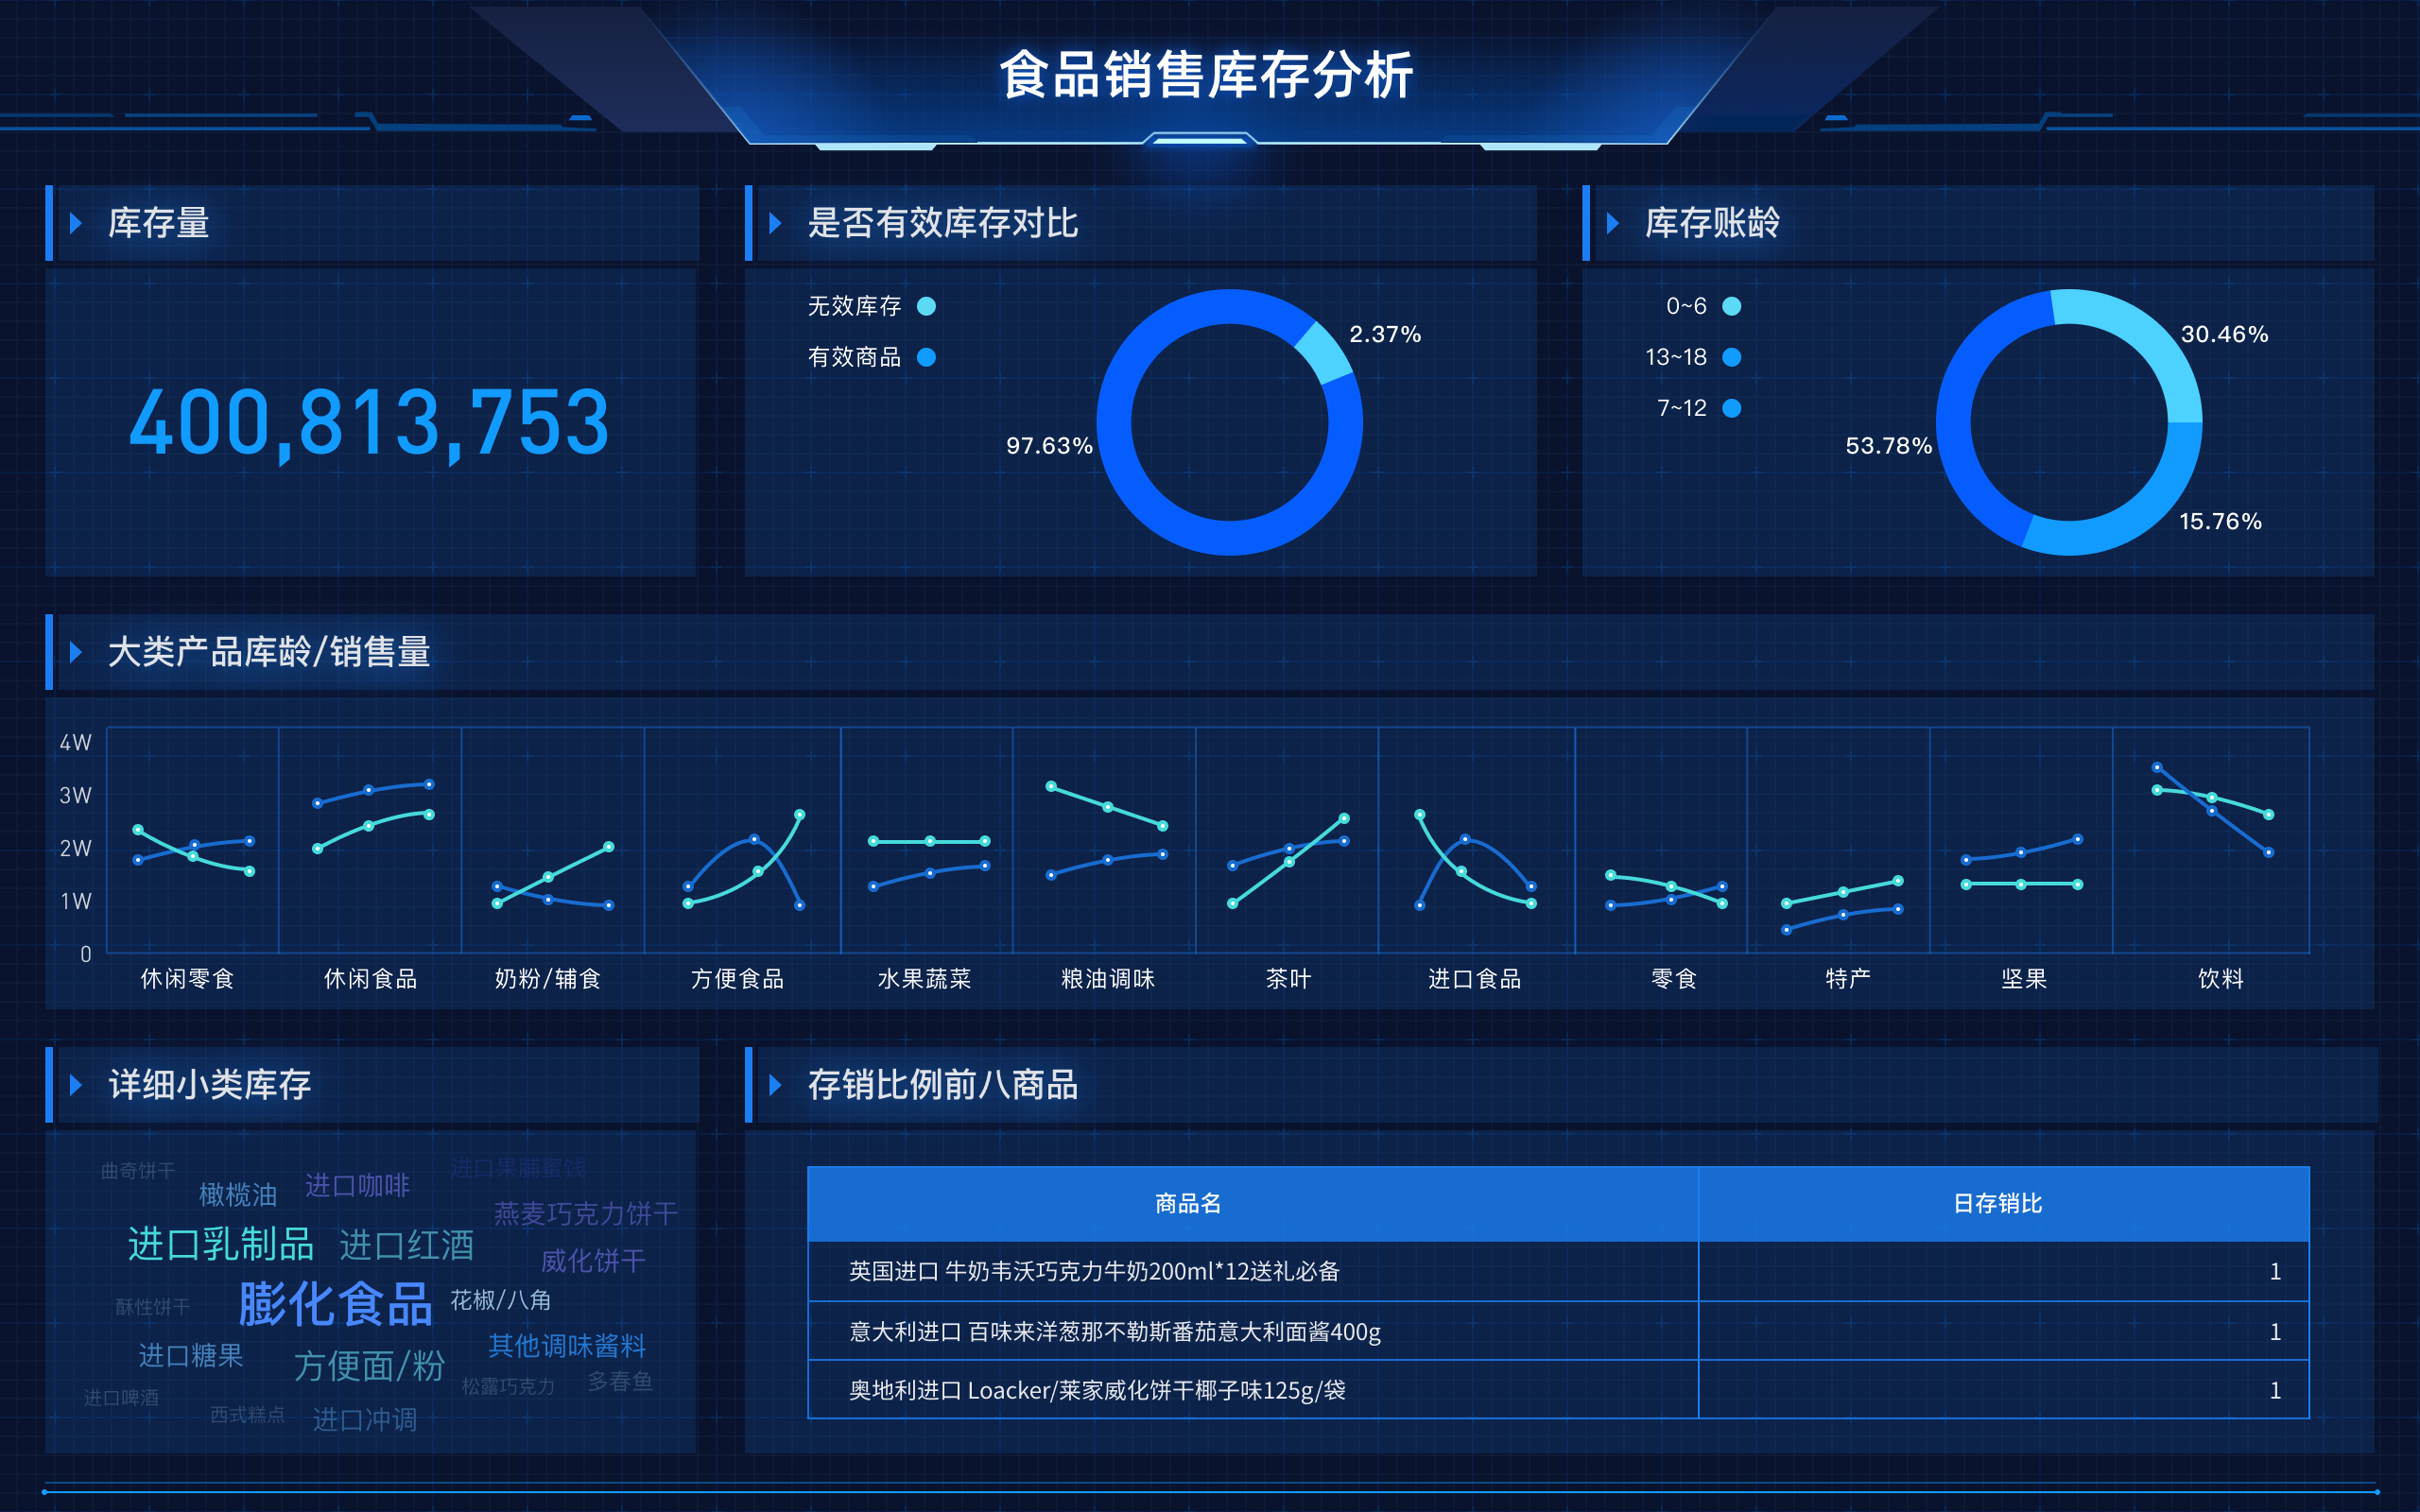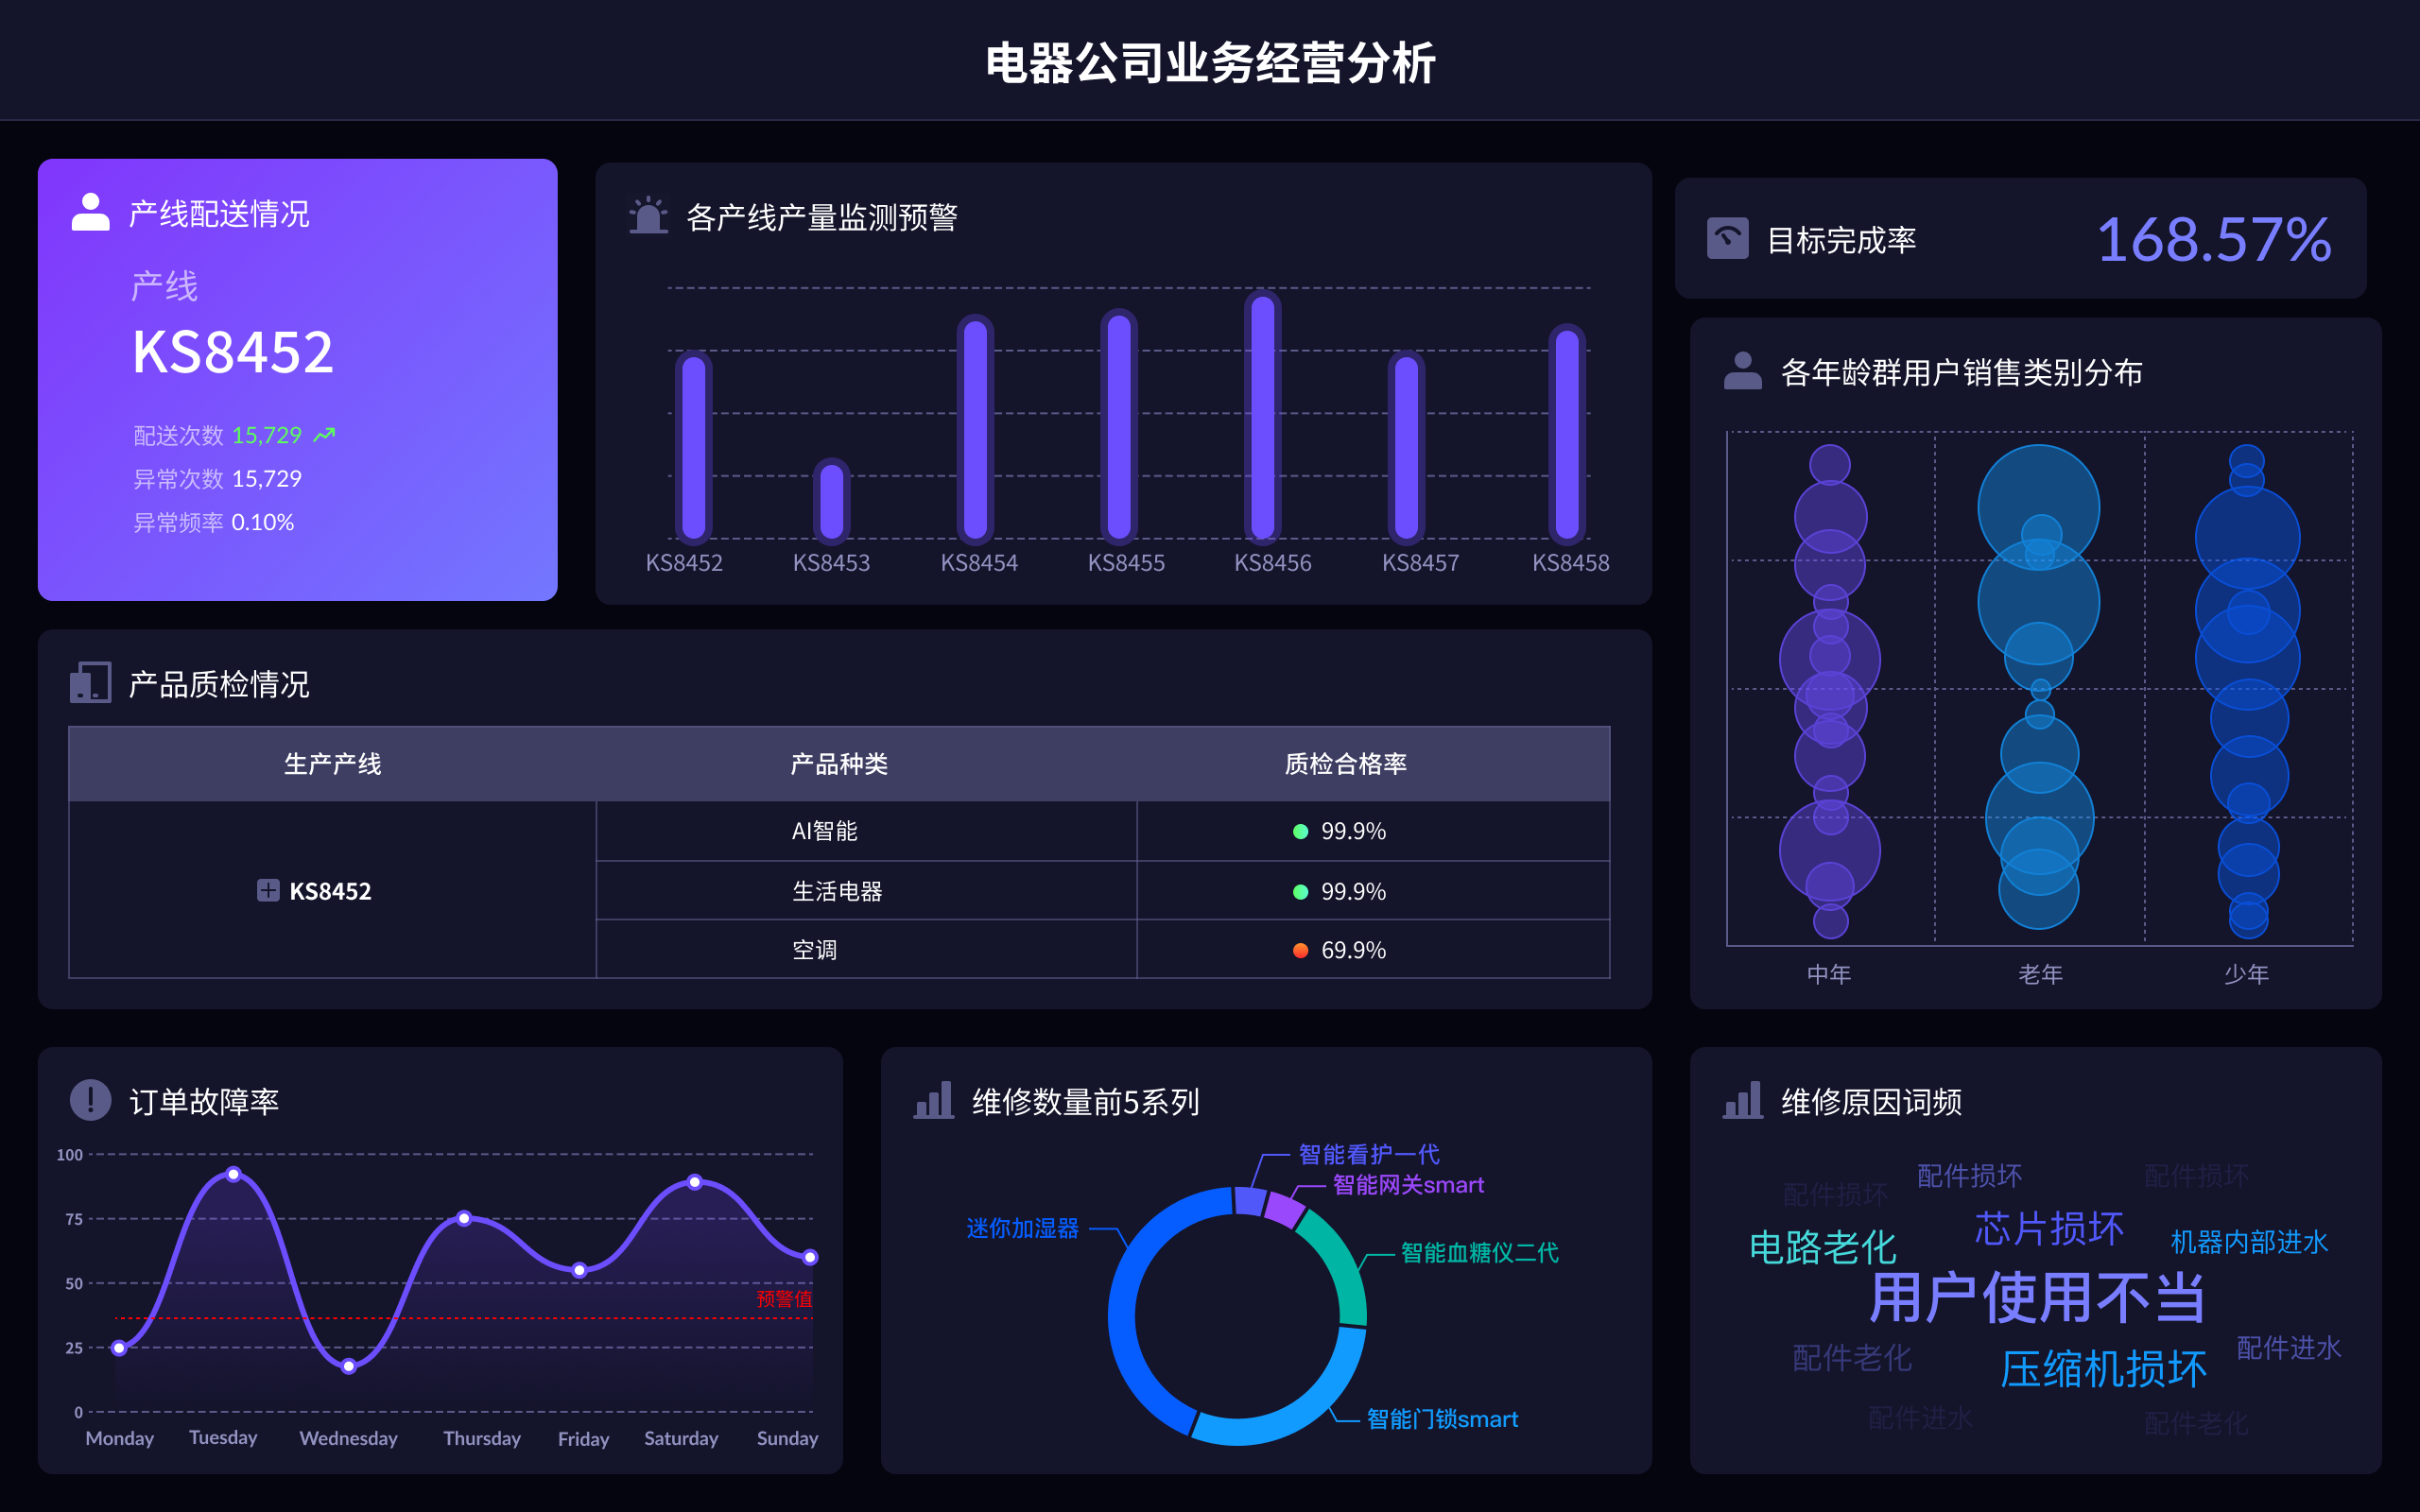
Data worth mining in English includes customer behavior, transaction history, social media interactions, website analytics, product reviews, and demographic information. Customer behavior is particularly valuable as it provides insights into purchasing patterns, preferences, and overall engagement with a brand. By understanding customer behavior, businesses can tailor their marketing strategies, improve product offerings, and enhance customer experience, ultimately driving growth and profitability.
一、CUSTOMER BEHAVIOR
Customer behavior is a goldmine of information for businesses. This data includes purchasing patterns, browsing habits, and engagement metrics. By analyzing customer behavior, companies can identify trends and preferences, allowing them to tailor their marketing strategies to better meet the needs of their audience. For example, if data shows that customers frequently abandon their shopping carts at a specific stage in the checkout process, businesses can take steps to simplify that part of the process, potentially increasing conversion rates. Additionally, understanding what products are often purchased together can help in creating effective cross-selling and upselling strategies. Detailed customer behavior analysis can also reveal the most effective times and channels for marketing communications, ensuring that promotional messages reach the audience when they are most likely to respond.
二、TRANSACTION HISTORY
Transaction history data includes records of all purchases made by customers over time. This data is invaluable as it provides a clear picture of customer spending habits, product popularity, and seasonal trends. By analyzing transaction history, businesses can identify their most valuable customers and create personalized marketing campaigns to retain them. For instance, loyalty programs can be designed to reward frequent buyers, encouraging repeat purchases. Moreover, transaction history can highlight which products are best-sellers and which ones are underperforming, guiding inventory management and product development decisions. Companies can also use this data to forecast future sales and prepare for peak shopping periods, ensuring they have sufficient stock and resources to meet demand.
三、SOCIAL MEDIA INTERACTIONS
Social media interactions provide insights into how customers perceive and engage with a brand online. This data includes likes, shares, comments, and mentions across various social media platforms. Analyzing social media interactions helps businesses understand the sentiment around their brand, identify influencers, and measure the effectiveness of their social media campaigns. For example, a spike in negative comments about a product can signal a quality issue that needs to be addressed. Conversely, a high number of positive interactions can indicate successful marketing efforts. Businesses can also use social media data to engage directly with their customers, responding to feedback and building stronger relationships. This direct interaction can increase customer loyalty and create a community of brand advocates.
四、WEBSITE ANALYTICS
Website analytics data encompasses a wide range of metrics such as page views, bounce rates, session durations, and conversion rates. This data is crucial for understanding how visitors interact with a website and identifying areas for improvement. For instance, high bounce rates on certain pages may indicate that the content is not engaging or that the page is not user-friendly. By analyzing this data, businesses can optimize their website design and content to improve user experience and increase conversions. Website analytics can also reveal the most effective traffic sources, allowing businesses to allocate their marketing budgets more efficiently. For example, if a significant portion of traffic comes from organic search, investing in SEO might yield better returns than paid advertising.
五、PRODUCT REVIEWS
Product reviews are a valuable source of feedback from customers. This data includes ratings, comments, and suggestions about products and services. By analyzing product reviews, businesses can gain insights into customer satisfaction and identify areas for improvement. Positive reviews can be highlighted in marketing materials to build trust with potential customers, while negative reviews can provide actionable insights for product development. For example, if multiple customers mention the same issue with a product, it may indicate a design flaw that needs to be addressed. Additionally, product reviews can help businesses understand the features that customers value most, guiding future product enhancements.
六、DEMOGRAPHIC INFORMATION
Demographic information includes data on customers’ age, gender, income, education, and location. This data is essential for segmenting the market and creating targeted marketing campaigns. By understanding the demographics of their customer base, businesses can tailor their messaging and product offerings to better meet the needs of different segments. For instance, a company targeting young professionals might focus on convenience and innovation, while a brand appealing to retirees might emphasize quality and reliability. Demographic data can also help businesses identify new market opportunities and expand their reach. By analyzing demographic trends, companies can adapt their strategies to cater to emerging customer groups, staying ahead of the competition.
七、COMPETITOR ANALYSIS
Competitor analysis involves gathering and analyzing data on competitors’ strategies, strengths, and weaknesses. This data can include information on their product offerings, pricing, marketing tactics, and customer feedback. By understanding what competitors are doing well and where they are falling short, businesses can identify opportunities to differentiate themselves and gain a competitive edge. For example, if a competitor is successfully targeting a niche market that your business has overlooked, it might be worth exploring that segment. Competitor analysis can also reveal gaps in the market that your business can fill, helping you to develop unique value propositions and stand out from the crowd.
八、CUSTOMER SUPPORT INTERACTIONS
Customer support interactions provide insights into common issues and concerns that customers have with your products or services. This data includes records of support tickets, chat logs, and call transcripts. By analyzing this data, businesses can identify recurring problems and take proactive steps to address them. For instance, if a specific issue is frequently reported, it may indicate a need for better user documentation or a product update. Improving customer support based on data-driven insights can enhance customer satisfaction and reduce churn rates. Additionally, customer support data can help businesses understand the effectiveness of their support teams and identify areas for training and improvement.
九、EMAIL MARKETING METRICS
Email marketing metrics include data on open rates, click-through rates, bounce rates, and conversions. This data is vital for assessing the effectiveness of email marketing campaigns and optimizing future efforts. By analyzing email marketing metrics, businesses can identify which subject lines, content, and calls-to-action resonate most with their audience. For example, if a particular email campaign has a high open rate but a low click-through rate, it may indicate that the content is not compelling enough to drive action. Adjusting the content based on these insights can improve engagement and conversion rates.
十、LOYALTY PROGRAM DATA
Loyalty program data includes information on customer participation, rewards redeemed, and program impact on purchasing behavior. This data is valuable for understanding the effectiveness of loyalty programs and identifying opportunities for improvement. By analyzing loyalty program data, businesses can determine which rewards are most appealing to customers and which aspects of the program drive the most engagement. For example, if data shows that customers are highly motivated by exclusive discounts, businesses can focus on offering more of these incentives. Additionally, loyalty program data can help identify the most loyal customers, enabling businesses to create personalized experiences and strengthen customer relationships.
十一、SURVEY RESPONSES
Survey responses provide direct feedback from customers on various aspects of your business, including product quality, customer service, and overall satisfaction. This data is crucial for understanding customer perceptions and identifying areas for improvement. By analyzing survey responses, businesses can gain insights into customer needs and preferences, guiding strategic decisions. For instance, if survey data reveals that customers are dissatisfied with delivery times, businesses can explore ways to streamline their logistics processes. Additionally, survey responses can help validate assumptions and test new ideas, ensuring that business decisions are aligned with customer expectations.
十二、GEOGRAPHIC DATA
Geographic data includes information on the locations where customers live and shop. This data is essential for businesses with physical stores or those looking to expand their reach. By analyzing geographic data, businesses can identify regional trends and tailor their marketing strategies accordingly. For example, if data shows that a particular product is popular in a specific region, businesses can focus their marketing efforts in that area to maximize sales. Geographic data can also help businesses identify underserved markets and plan new store locations or distribution channels to better serve their customers.
十三、WEARABLE DEVICE DATA
Wearable device data includes information collected from smartwatches, fitness trackers, and other wearable technology. This data provides insights into customer health, activity levels, and daily routines. By analyzing wearable device data, businesses can develop personalized products and services that cater to individual needs. For example, fitness brands can use this data to create customized workout plans, while healthcare providers can offer personalized health advice. Wearable device data can also help businesses understand how their products are used in real-life scenarios, guiding product development and innovation.
十四、MOBILE APP USAGE DATA
Mobile app usage data includes metrics on app downloads, user engagement, and in-app behavior. This data is crucial for businesses with mobile applications, as it provides insights into how users interact with their app. By analyzing mobile app usage data, businesses can identify popular features, user pain points, and opportunities for improvement. For instance, if data shows that users frequently abandon the app during a specific task, businesses can investigate and address the issue to enhance user experience. Additionally, mobile app usage data can inform marketing strategies, helping businesses to target their promotions to the most engaged users.
十五、INTERNET OF THINGS (IOT) DATA
IoT data includes information collected from connected devices such as smart home appliances, vehicles, and industrial equipment. This data provides insights into how products are used and can reveal patterns that inform business decisions. By analyzing IoT data, businesses can optimize product performance, predict maintenance needs, and improve customer satisfaction. For example, a smart thermostat company can use IoT data to understand how customers adjust their heating and cooling settings, allowing them to develop more energy-efficient products. IoT data can also help businesses identify potential product issues before they become widespread, reducing downtime and enhancing reliability.
十六、POINT-OF-SALE (POS) DATA
POS data includes information on sales transactions, payment methods, and customer interactions at the point of sale. This data is valuable for brick-and-mortar retailers as it provides insights into sales performance and customer behavior. By analyzing POS data, businesses can identify peak shopping times, popular products, and effective sales promotions. For example, if data shows that certain products sell well during specific times of the year, businesses can plan their inventory and marketing campaigns accordingly. POS data can also reveal customer preferences for payment methods, enabling businesses to offer convenient options that enhance the shopping experience.
十七、CALL CENTER DATA
Call center data includes records of customer interactions with support representatives, including call duration, resolution rates, and customer satisfaction scores. This data is essential for understanding the effectiveness of customer support and identifying areas for improvement. By analyzing call center data, businesses can identify common issues and train their support teams to handle them more effectively. For example, if data shows that calls about a specific issue are taking longer to resolve, businesses can provide additional training or resources to support representatives. Additionally, call center data can help businesses understand customer sentiment and identify opportunities to enhance the overall support experience.
十八、USER-GENERATED CONTENT (UGC)
UGC includes content created by customers, such as reviews, social media posts, and forum discussions. This data provides valuable insights into customer opinions and brand perception. By analyzing UGC, businesses can identify trends, gather feedback, and engage with their audience. For example, positive UGC can be used in marketing campaigns to build trust and credibility, while negative UGC can highlight areas for improvement. Engaging with customers who create UGC can also strengthen relationships and foster a sense of community around the brand.
十九、MARKET RESEARCH DATA
Market research data includes information collected from studies and surveys conducted to understand market trends, customer preferences, and competitive landscape. This data is critical for strategic decision-making and long-term planning. By analyzing market research data, businesses can identify growth opportunities, assess market demand, and develop effective marketing strategies. For example, if market research indicates a growing demand for eco-friendly products, businesses can invest in sustainable product development to meet this demand. Market research data can also help businesses understand their competitive positioning and identify areas where they can differentiate themselves.
二十、WEATHER DATA
Weather data includes information on temperature, precipitation, and other weather conditions. This data is particularly valuable for businesses in industries such as retail, agriculture, and logistics. By analyzing weather data, businesses can predict its impact on sales, production, and supply chain operations. For instance, retailers can use weather data to anticipate demand for seasonal products and adjust their inventory accordingly. Agricultural businesses can optimize planting and harvesting schedules based on weather patterns, while logistics companies can plan routes to avoid weather-related disruptions.
In conclusion, a wide array of data types is worth mining for businesses to gain insights and drive strategic decisions. By leveraging data such as customer behavior, transaction history, social media interactions, website analytics, product reviews, and demographic information, companies can enhance their marketing strategies, improve product offerings, and create better customer experiences. Each type of data provides unique insights that, when combined, offer a comprehensive understanding of the market and customer needs.
相关问答FAQs:
什么数据值得挖掘?
在当今数据驱动的世界中,数据挖掘已经成为企业和组织决策的重要工具。随着技术的进步,能够分析和从大量数据中提取有价值信息的能力显得尤为重要。以下是一些值得挖掘的数据类型和原因。
1. 客户行为数据:
客户行为数据是指从客户在购买过程中的行为中收集的数据。这类数据包括浏览历史、购物车放弃率、购买频率等信息。通过分析这些数据,企业能够深入了解客户的偏好和需求,从而制定更为精准的营销策略。例如,通过分析客户的购买历史,企业可以推出个性化的推荐系统,提高客户的购买转化率。
此外,客户行为数据还可以用于预测客户流失。通过识别出那些可能流失的客户,企业可以采取针对性的措施,比如提供特别优惠或个性化服务,以留住这些客户。总之,客户行为数据不仅能帮助企业提升销售,还能增强客户忠诚度。
2. 社交媒体数据:
社交媒体平台上生成的数据量庞大,包含了用户的评论、分享、点赞等互动信息。这些数据不仅反映了消费者对品牌的态度,还能揭示出当前的市场趋势和消费者的需求变化。通过对社交媒体数据的分析,企业能够捕捉到用户的情感和偏好,帮助他们调整市场策略。
例如,品牌可以利用社交媒体数据分析工具,监测与品牌相关的关键词和话题,从而及时响应消费者的反馈。此举不仅能提升品牌形象,还能增强用户的参与感。此外,社交媒体数据还可以用于竞品分析,帮助企业了解竞争对手的表现和市场策略。
3. 交易数据:
交易数据是企业运营中不可或缺的部分,涉及到销售额、交易频率、平均订单价值等信息。这些数据可以帮助企业评估其市场表现和盈利能力。通过深入分析交易数据,企业可以发现潜在的销售机会,优化库存管理和供应链流程。
例如,企业可以通过分析不同时间段的销售数据,找出销售高峰和低谷,从而合理安排促销活动和库存。此外,交易数据还能够帮助企业识别出最有价值的客户群体,进而制定差异化的营销策略,提升客户的终身价值。
4. 竞争对手数据:
了解竞争对手的动态对于企业来说至关重要。竞争对手数据可以包括其市场份额、价格策略、产品发布信息等。通过分析这些数据,企业能够识别出市场机会和威胁,并据此调整自身的市场定位和策略。
例如,企业可以通过竞品分析工具,监测竞争对手的广告投放策略和市场反应,以便及时调整自己的营销策略。同时,了解竞争对手的客户反馈和产品评价,也能帮助企业改进自身产品和服务,从而在市场中占据更有利的地位。
5. 市场趋势数据:
市场趋势数据是指与市场变化相关的信息,包括行业报告、消费者调查、经济指标等。这类数据能够帮助企业把握市场动态,预测未来的市场走向。通过分析市场趋势数据,企业可以制定长远的发展战略,增强其市场竞争力。
例如,企业可以关注行业发展报告,了解行业内的新兴趋势和技术变革,从而及时调整产品研发方向。此外,消费者调查数据也能提供有关消费者偏好的深刻见解,帮助企业识别新的市场机会。
6. 地理数据:
地理数据是指与地理位置相关的信息,包括客户的地理分布、市场覆盖范围等。这类数据对于企业的市场拓展和营销策略制定至关重要。通过分析地理数据,企业能够识别出潜在的市场区域,优化资源配置。
例如,企业可以利用地理信息系统(GIS)工具,分析不同地区的市场潜力和消费者行为,从而制定针对性的区域营销策略。此外,地理数据还可以帮助企业选择最佳的分销渠道和物流方案,提高运营效率。
7. 反馈与评价数据:
消费者的反馈和评价是企业改进产品和服务的重要依据。这类数据通常来自于用户评论、评分、调查问卷等。通过对反馈与评价数据的深入分析,企业能够识别出产品的优缺点,进而进行针对性的改进。
例如,企业可以通过文本分析技术,提取出用户评论中的关键词和情感倾向,从而了解消费者对产品的真实感受。同时,及时响应消费者的反馈,不仅能提升用户满意度,还能增强品牌的信任感。
总结
在数据挖掘的过程中,企业需要根据自身的业务需求和市场环境,选择最具价值的数据类型进行分析。通过深入挖掘这些数据,企业能够获得重要的市场洞察,优化决策过程,从而在激烈的市场竞争中立于不败之地。数据的价值在于它能够为决策提供依据,帮助企业更好地理解客户、市场和竞争对手。
本文内容通过AI工具匹配关键字智能整合而成,仅供参考,帆软不对内容的真实、准确或完整作任何形式的承诺。具体产品功能请以帆软官方帮助文档为准,或联系您的对接销售进行咨询。如有其他问题,您可以通过联系blog@fanruan.com进行反馈,帆软收到您的反馈后将及时答复和处理。


