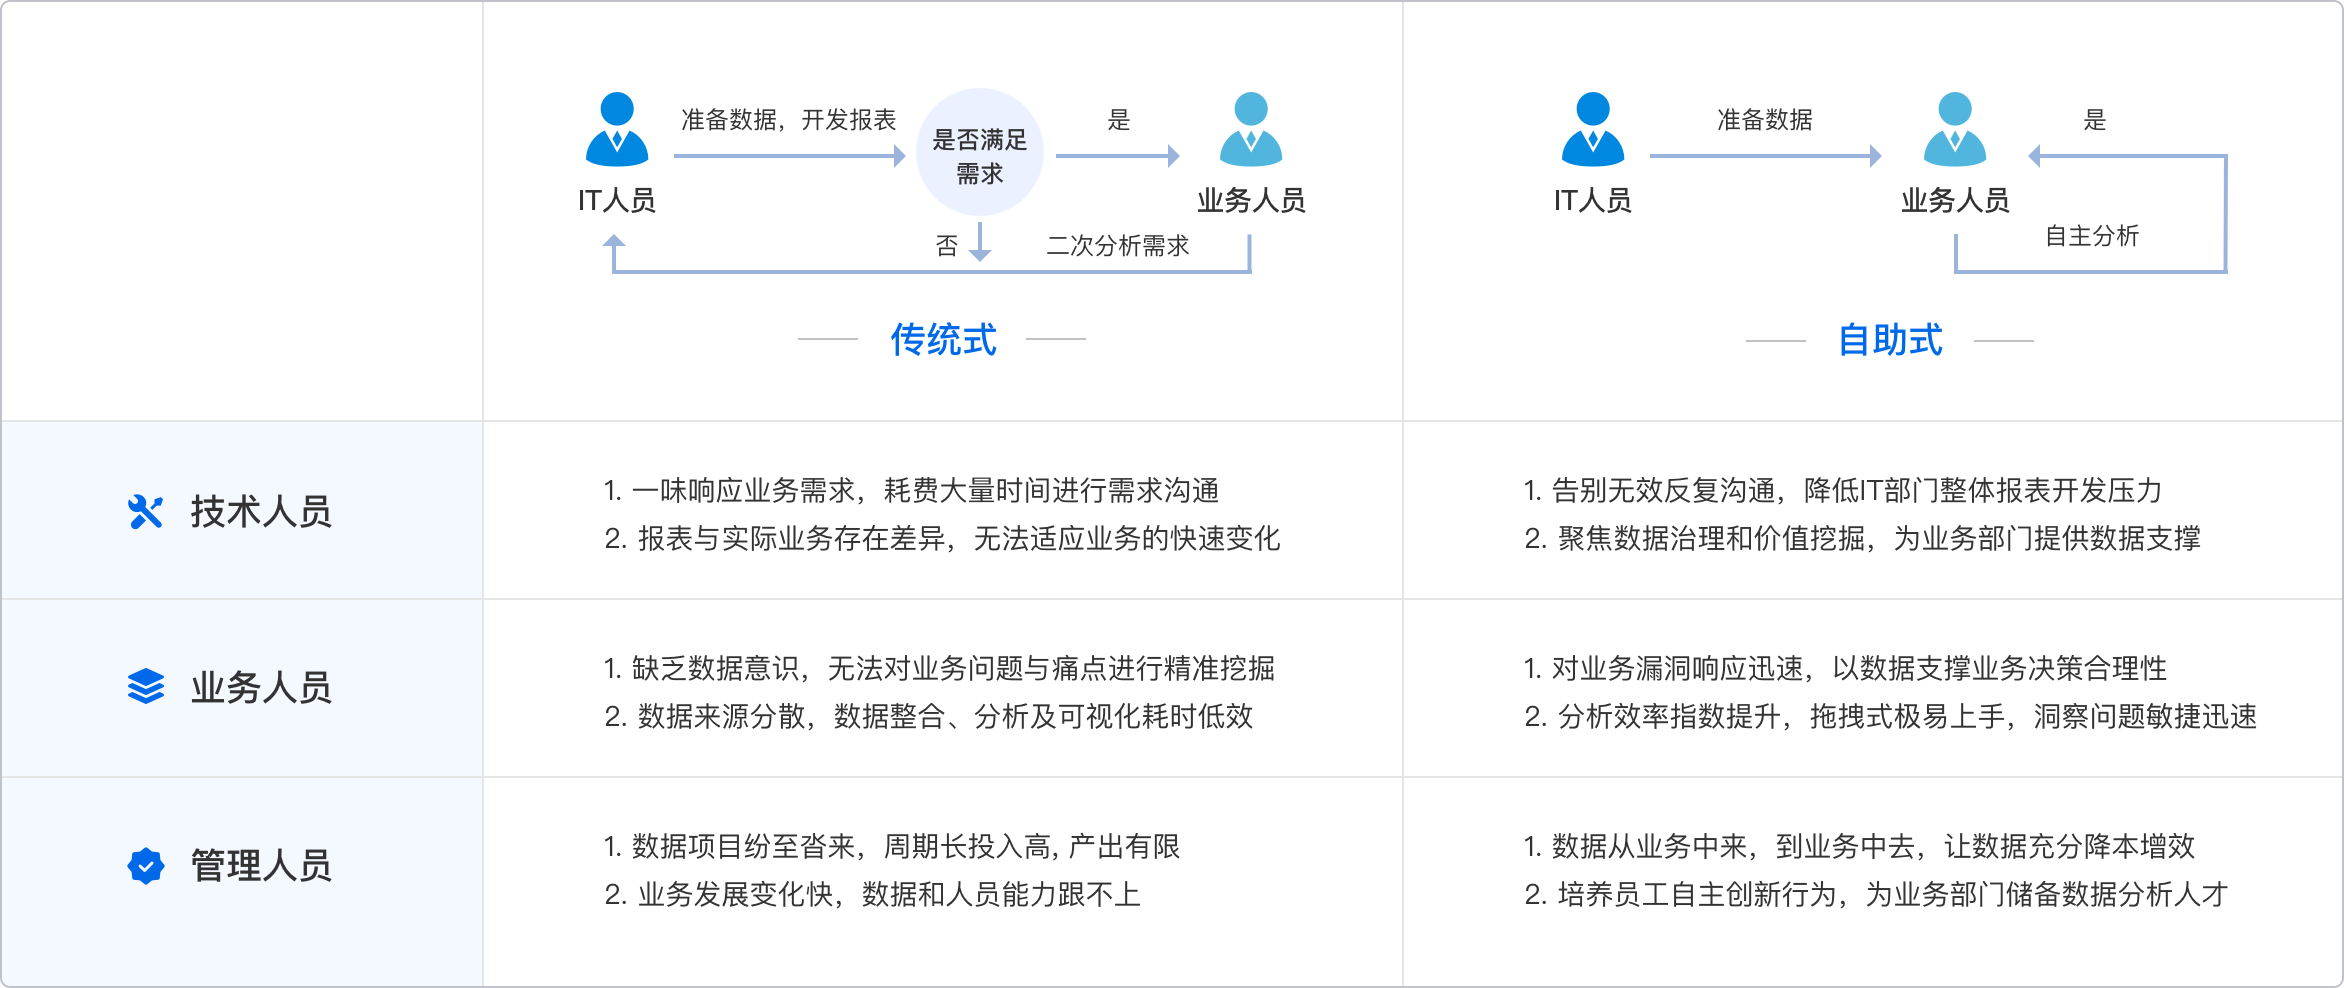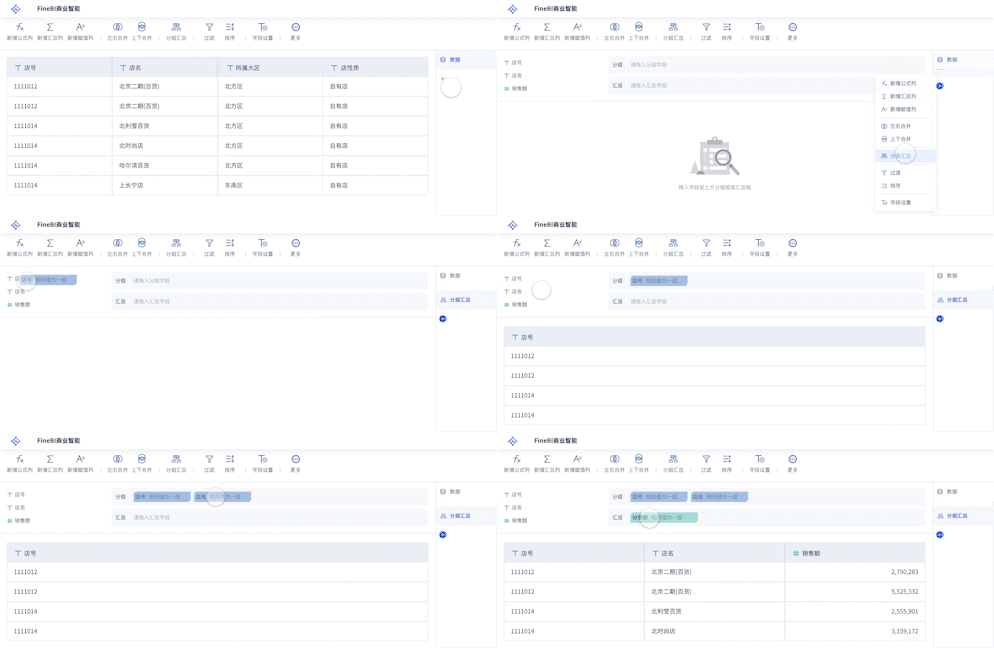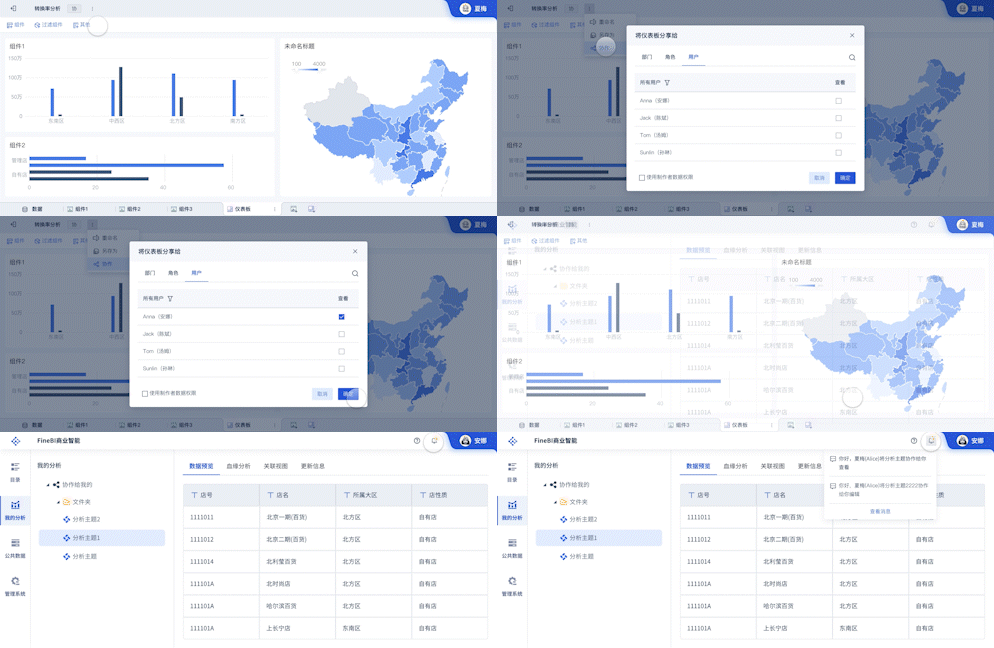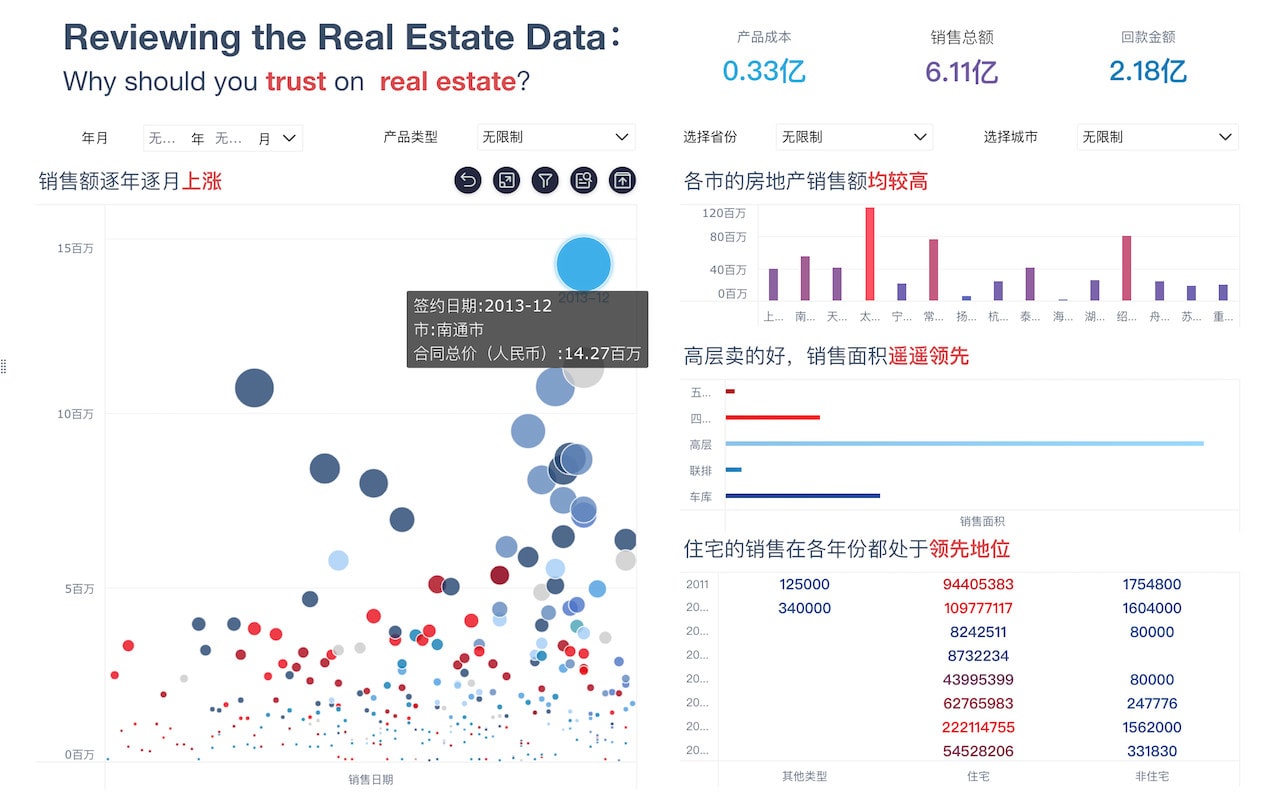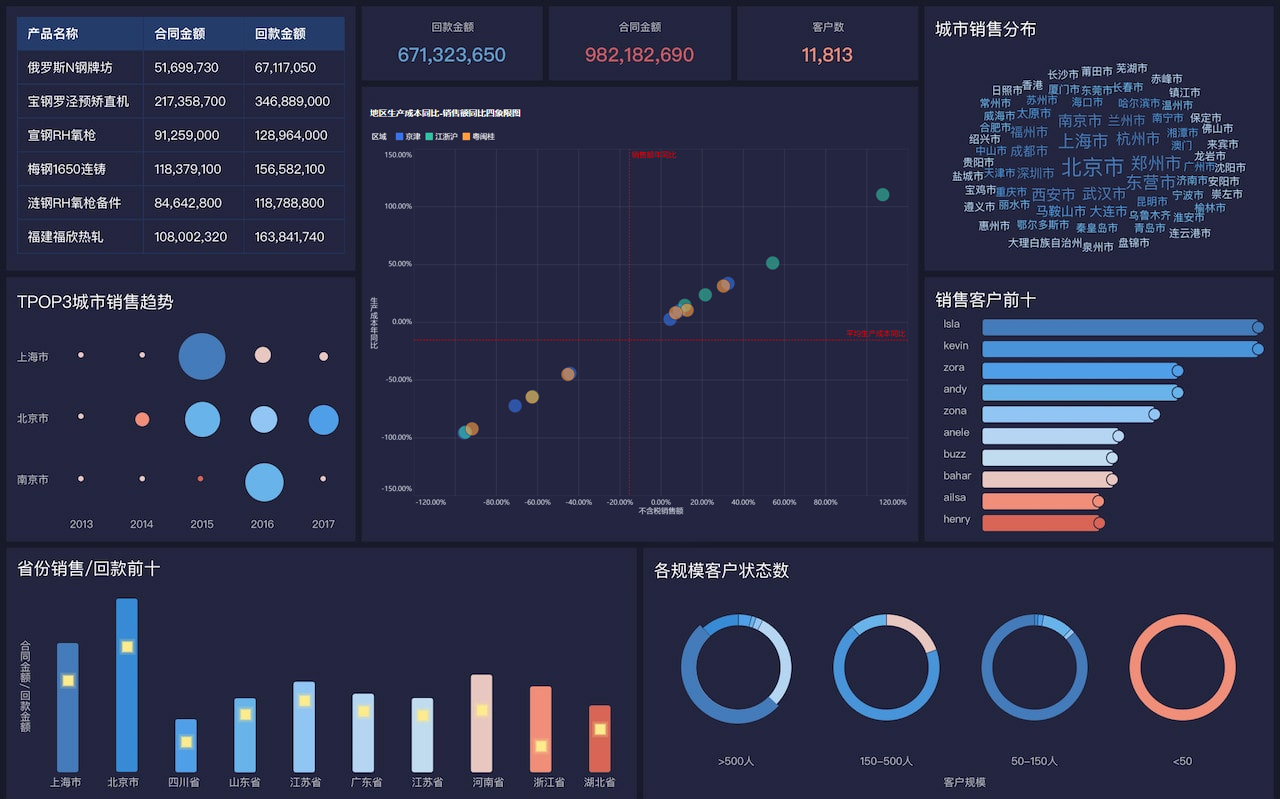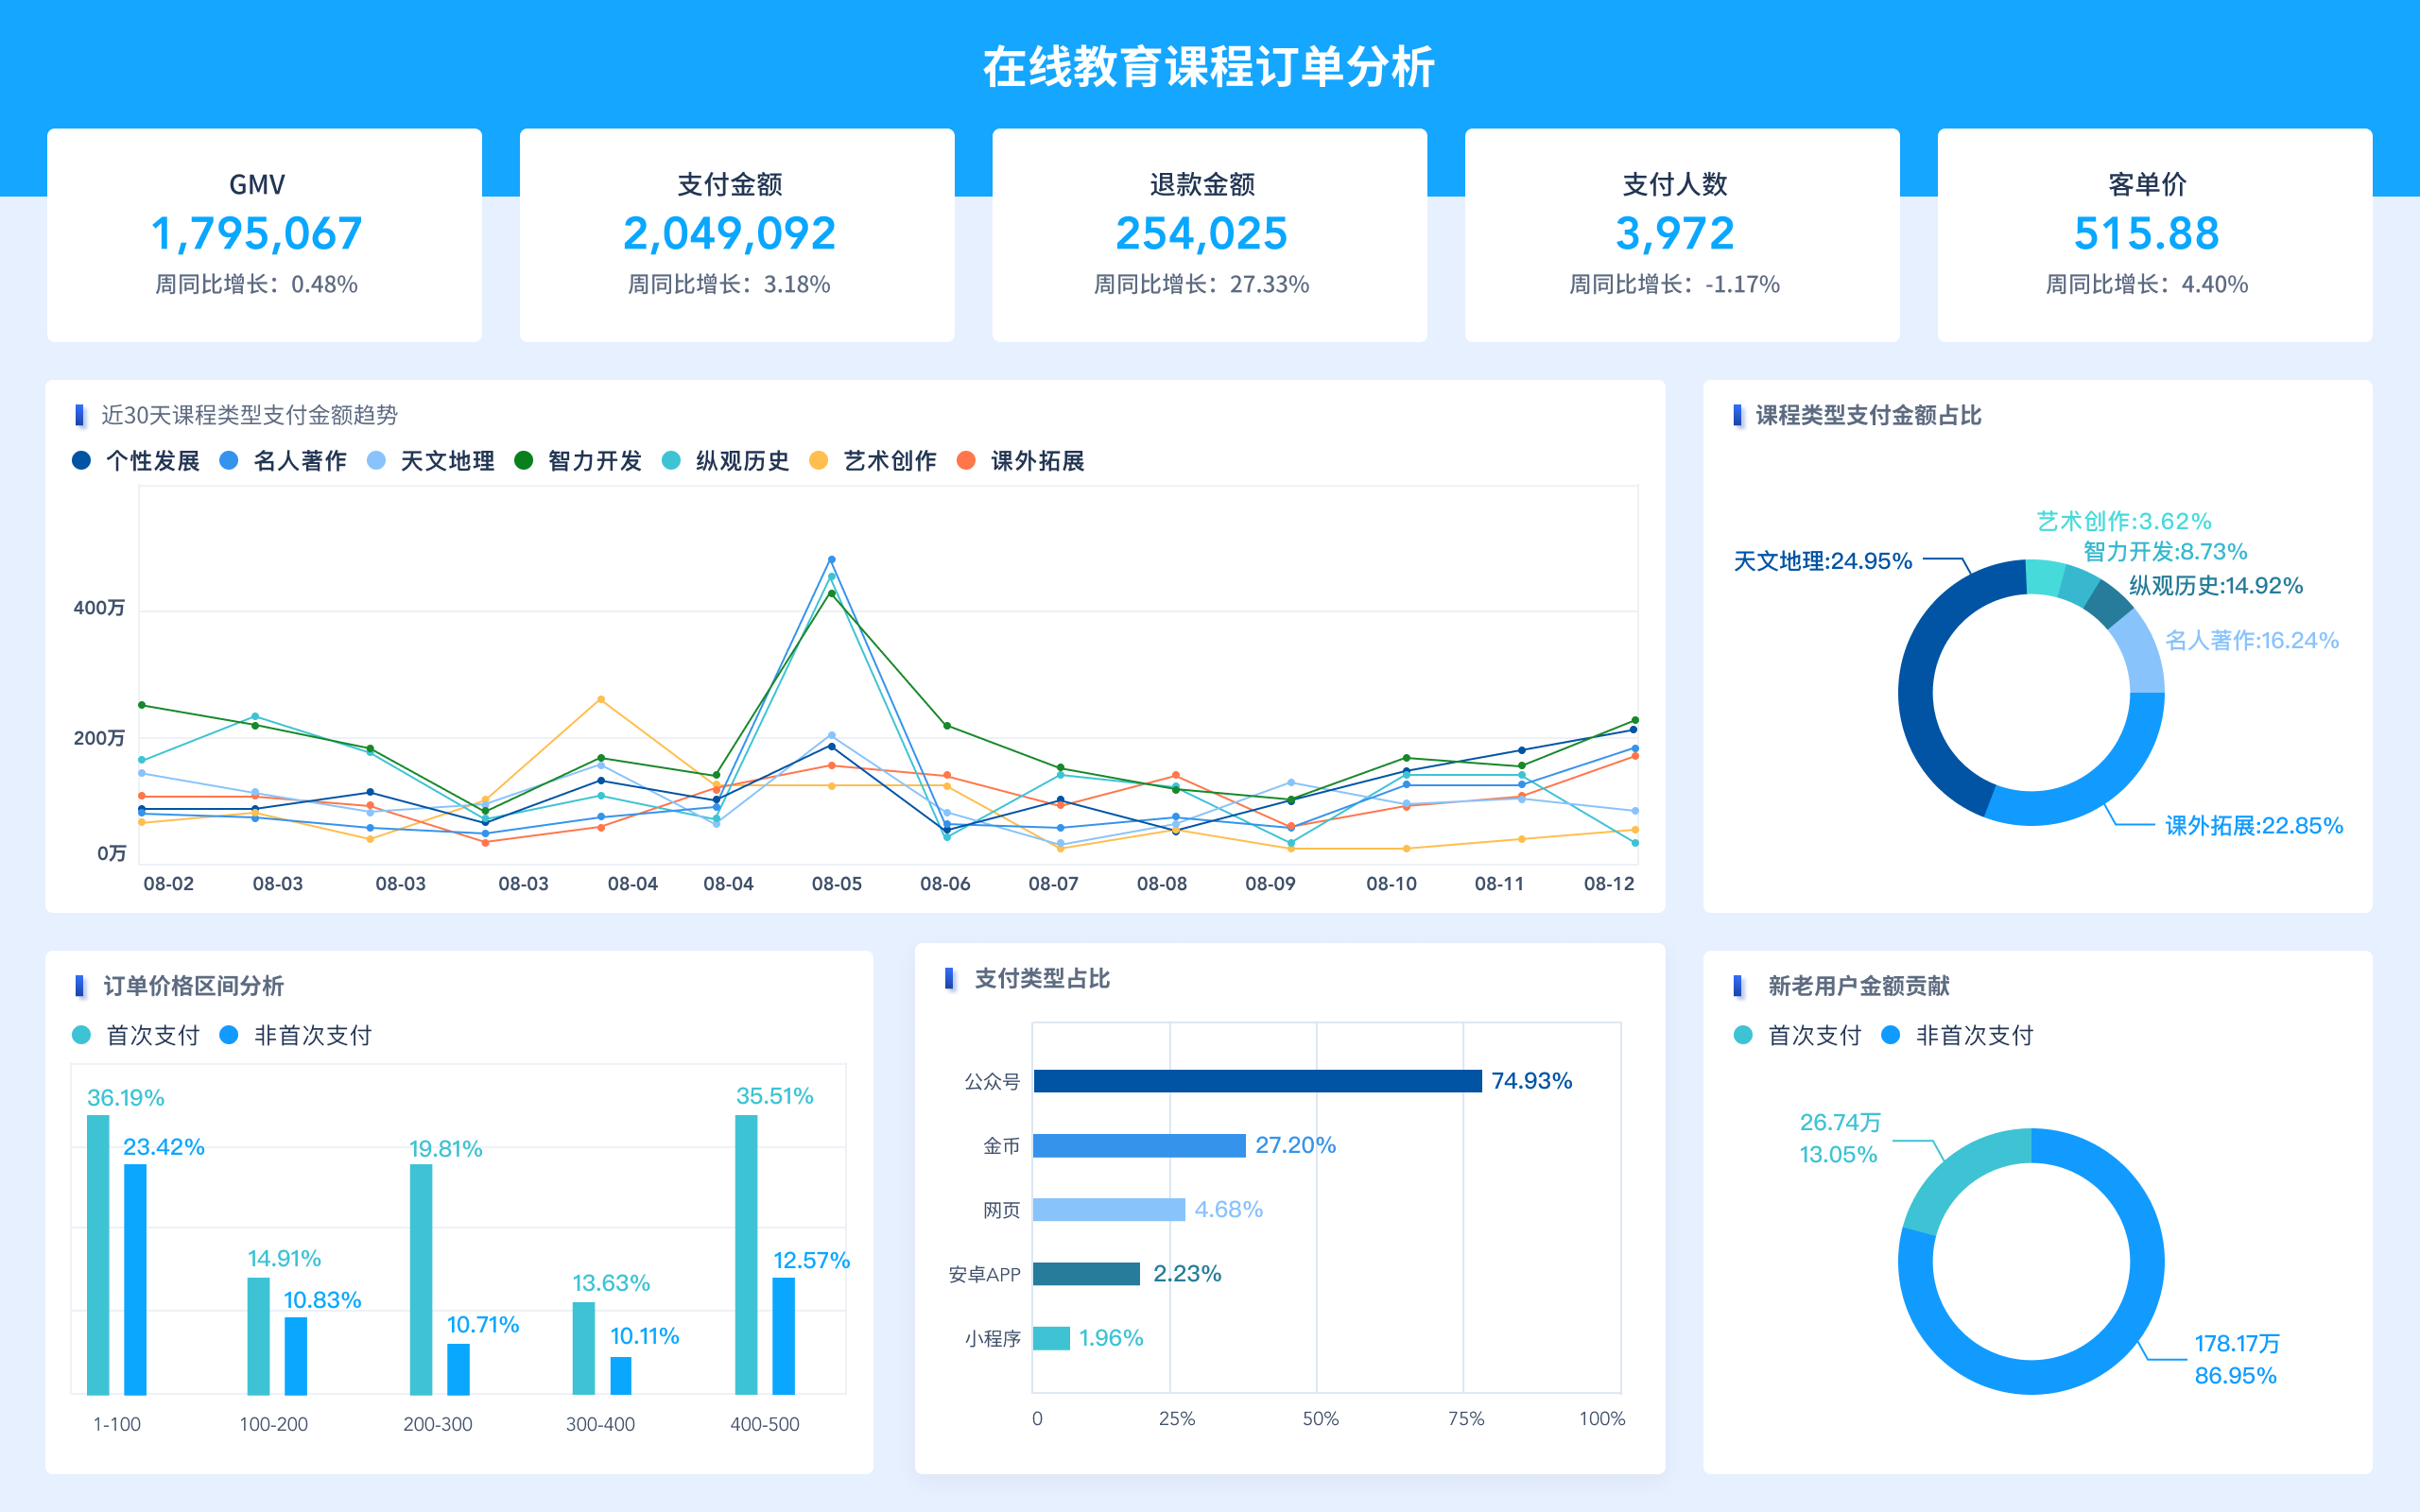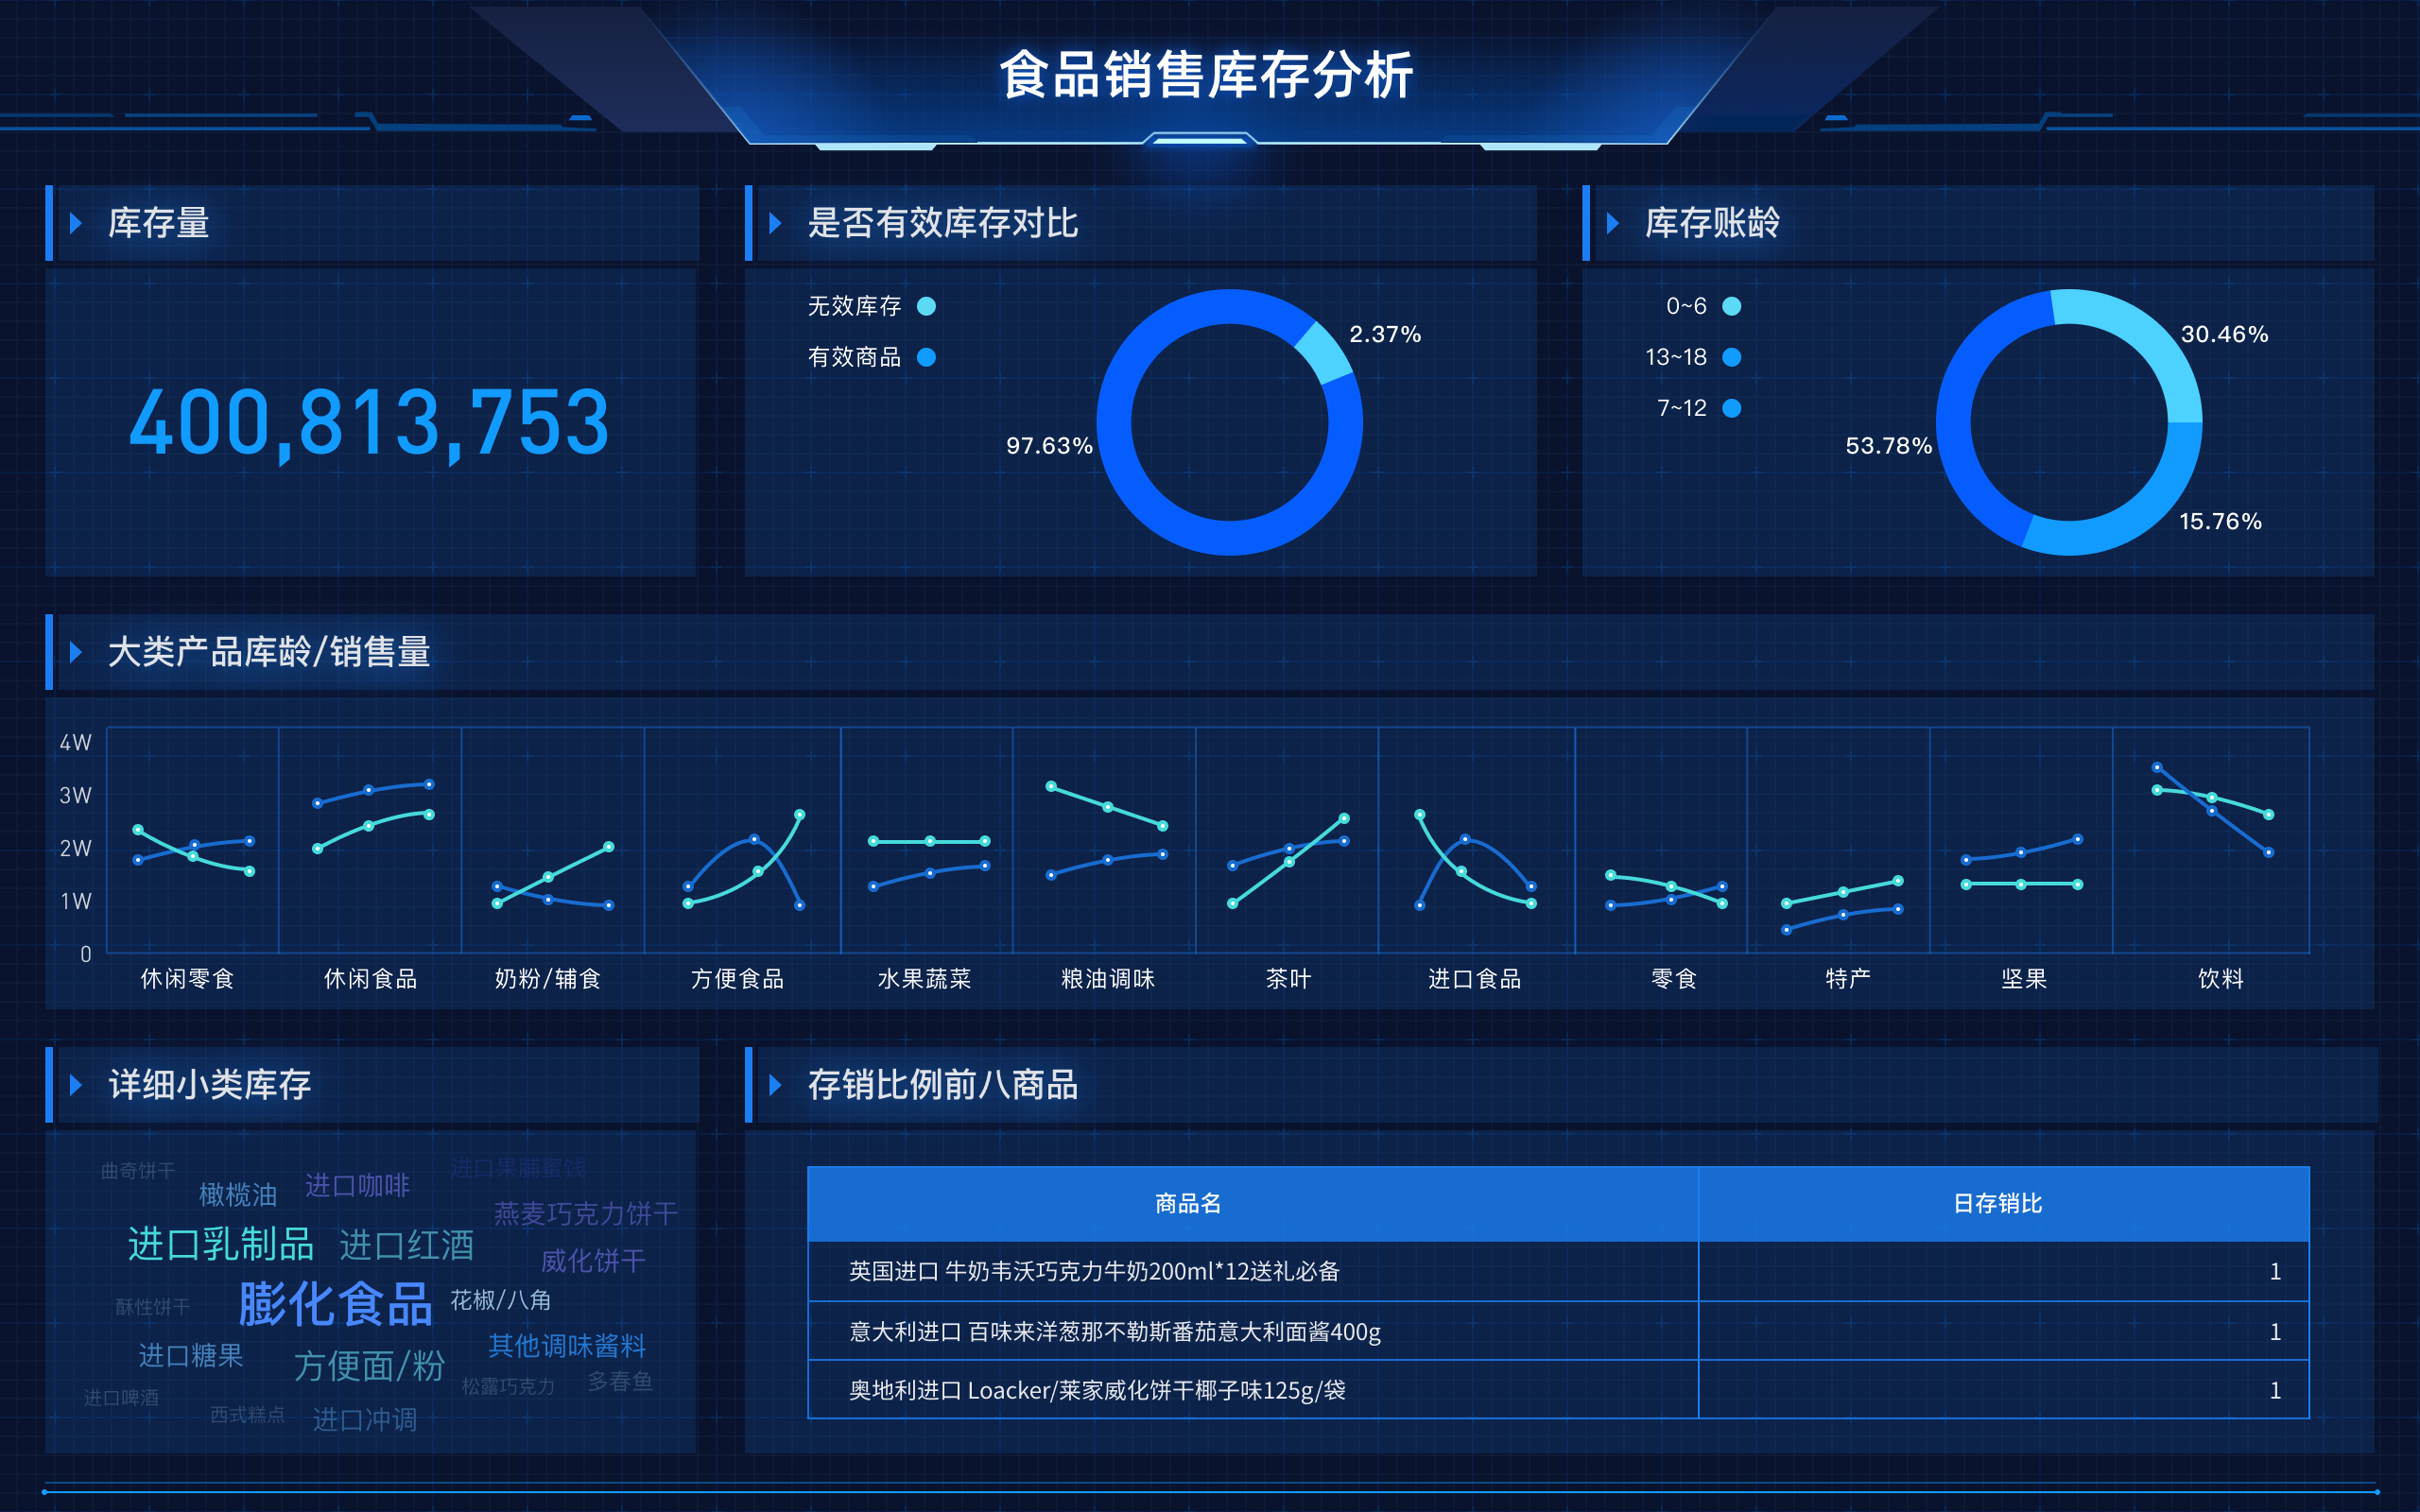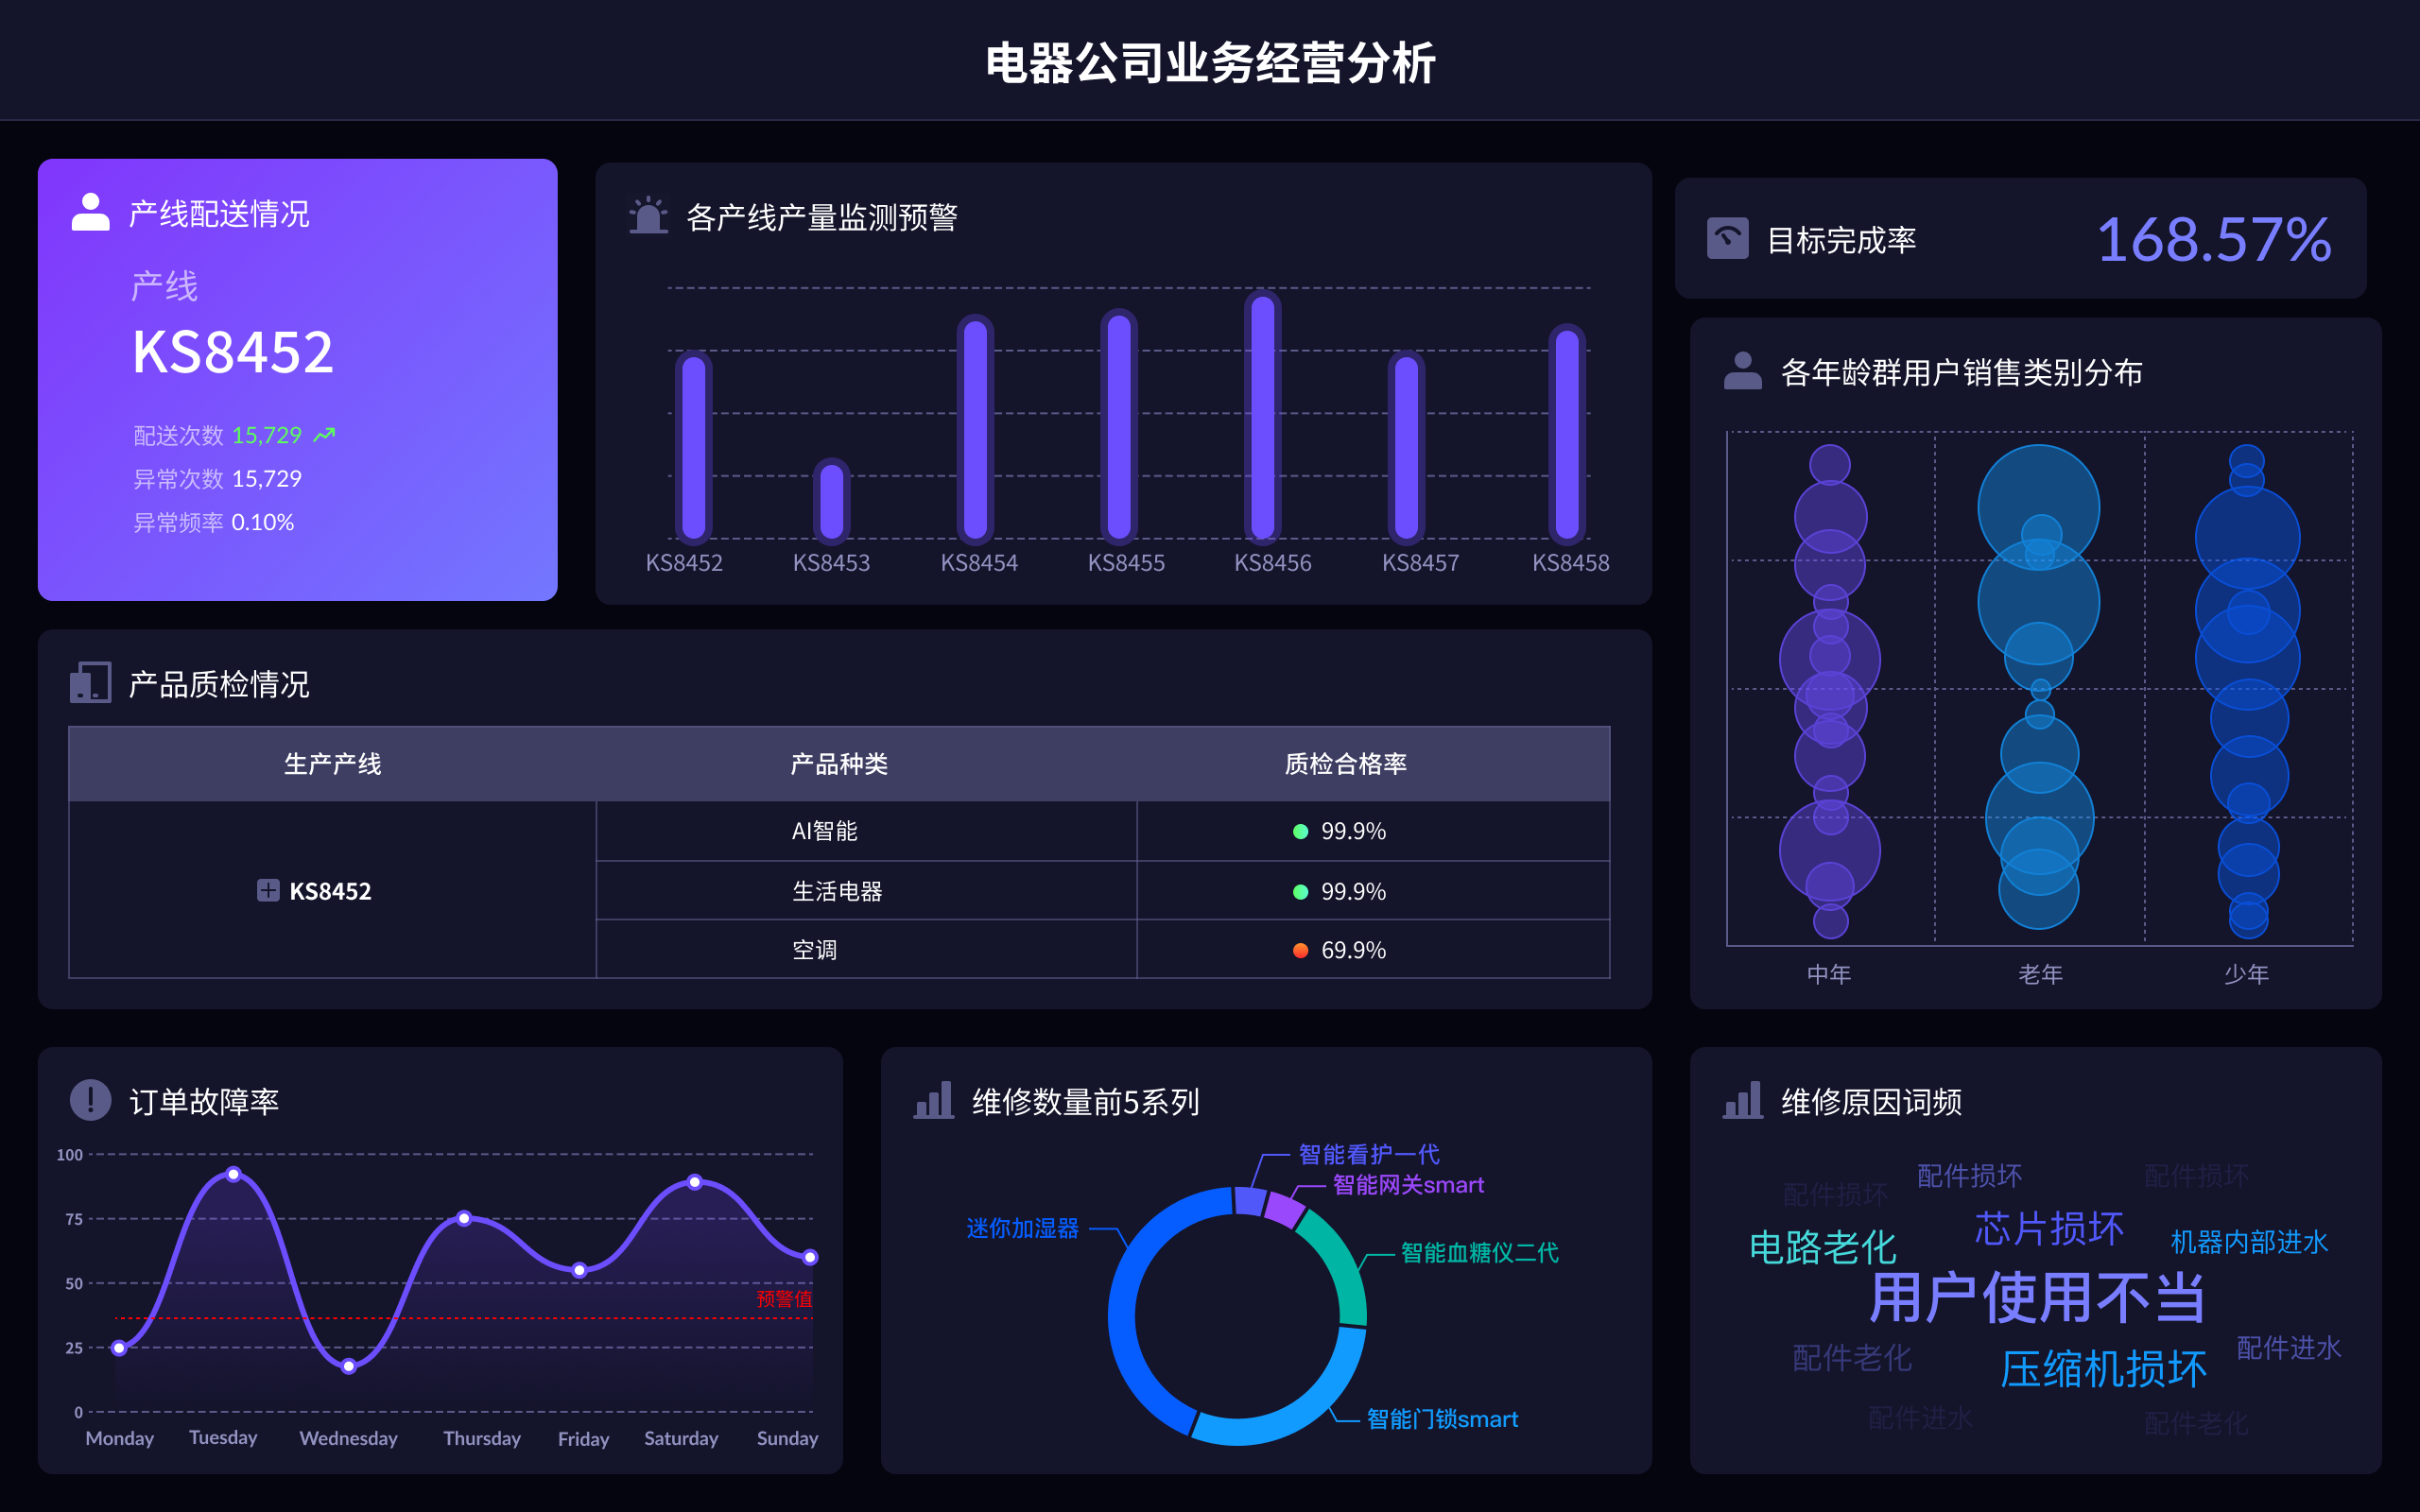
免费的开源BI报表工具包括:Metabase、Redash、Superset、FineReport、FineVis。 Metabase是一个简单易用的BI工具,支持多种数据源,可以通过图形界面进行数据分析,适合中小型企业使用。Metabase的最大优点在于其简单直观的用户界面和易于部署的特性,用户无需掌握复杂的编程语言即可进行数据查询和报表制作。此外,Metabase还支持多种图表类型和自定义仪表盘,满足用户的多样化需求。
一、METABASE
Metabase是一个开源的BI工具,主要特点是简单易用。用户通过直观的图形界面,可以轻松进行数据查询、报表制作和仪表盘创建。Metabase支持多种数据源,包括MySQL、PostgreSQL、MongoDB等,用户只需简单配置即可连接数据源。Metabase还具有强大的查询功能,用户可以通过自然语言进行查询,也可以使用其内置的查询生成器进行复杂查询。此外,Metabase支持多种图表类型,如柱状图、饼图、线图等,用户可以根据需要进行选择和自定义。Metabase还提供了丰富的插件和扩展功能,用户可以根据需求进行功能扩展,以满足特定的业务需求。
二、REDASH
Redash是一个开源的BI工具,主要特点是支持多种数据源和丰富的可视化选项。Redash的设计目标是帮助用户快速创建和分享数据查询和可视化报表。用户可以通过其简单的界面轻松进行数据查询和报表制作。Redash支持多种数据源,包括SQL、NoSQL、API等,用户可以根据需要选择合适的数据源进行连接。Redash还具有强大的查询功能,用户可以通过其内置的查询编辑器进行复杂查询,并将查询结果以多种图表形式进行展示。Redash还支持团队协作,用户可以将查询结果和报表分享给团队成员,促进数据驱动的决策和协作。
三、SUPERSET
Superset是一个开源的数据可视化和探索工具,主要特点是强大的数据可视化功能和灵活的扩展性。Superset由Airbnb开发,旨在帮助用户进行数据探索和可视化。用户可以通过其直观的界面轻松进行数据查询和报表制作。Superset支持多种数据源,包括SQL、NoSQL等,用户可以根据需要选择合适的数据源进行连接。Superset具有强大的数据可视化功能,用户可以通过其内置的图表库创建丰富的可视化报表。Superset还支持自定义仪表盘,用户可以根据需求进行布局和配置。Superset还提供了丰富的扩展功能,用户可以通过插件和自定义代码进行功能扩展,以满足特定的业务需求。
四、FINE REPORT
FineReport是帆软旗下的一款专业BI报表工具,虽然其主要是商业软件,但也提供了免费的社区版。FineReport支持多种数据源,包括关系型数据库、NoSQL数据库和大数据平台。用户可以通过其直观的报表设计器,轻松创建和定制各种复杂的报表和仪表盘。FineReport还支持多种图表类型和丰富的交互功能,如钻取、联动、过滤等,满足用户的多样化需求。FineReport还具有强大的数据处理能力,用户可以通过其内置的数据处理工具进行数据清洗、转换和聚合。FineReport官网: https://s.fanruan.com/ryhzq
五、FINEVIS
FineVis是帆软旗下另一款专业的数据可视化工具,主要特点是强大的数据可视化和探索功能。FineVis支持多种数据源,用户可以通过其直观的界面轻松进行数据查询和可视化报表制作。FineVis具有丰富的图表类型和强大的自定义功能,用户可以根据需求进行选择和配置。FineVis还支持多种交互功能,如联动、过滤、钻取等,帮助用户深入探索数据。FineVis还提供了丰富的扩展功能,用户可以通过插件和自定义代码进行功能扩展,以满足特定的业务需求。FineVis官网: https://s.fanruan.com/7z296
六、KEY BENEFITS OF OPEN SOURCE BI TOOLS
Open source BI tools offer several key benefits that make them attractive to organizations of all sizes. Firstly, the cost-effectiveness of these tools is a major advantage. Unlike proprietary software, open source tools are usually free to use, which can significantly reduce the overall IT expenditure. Additionally, since the source code is accessible, organizations can customize the tool to meet their specific needs without incurring additional costs.
Another major benefit is the flexibility and customization options available with open source tools. Organizations can modify the software to suit their unique requirements, whether it's adding new features, integrating with other systems, or tweaking the user interface. This level of customization is often not possible with commercial software, which tends to be more rigid and less adaptable.
Community support is another significant advantage. Open source projects often have large, active communities of users and developers who contribute to forums, create documentation, and develop plugins and extensions. This community-driven support can be invaluable for troubleshooting issues, learning best practices, and staying up-to-date with the latest developments.
Security is another critical aspect where open source tools often excel. With many eyes on the code, vulnerabilities are more likely to be spotted and fixed quickly. Additionally, organizations can audit the code themselves to ensure it meets their security standards.
Lastly, open source BI tools often offer interoperability with a wide range of data sources and other software systems. This makes it easier to integrate them into existing IT infrastructures, allowing for seamless data flow and more cohesive data management strategies.
In conclusion, the benefits of using open source BI tools—cost-effectiveness, flexibility, community support, security, and interoperability—make them a compelling choice for organizations looking to enhance their data analytics capabilities.
七、HOW TO CHOOSE THE RIGHT OPEN SOURCE BI TOOL
Selecting the right open source BI tool for your organization requires careful consideration of several factors. One of the most important aspects to evaluate is the ease of use. A tool with an intuitive user interface and comprehensive documentation can significantly reduce the learning curve, making it easier for team members to adopt and use effectively.
Scalability is another crucial factor. As your organization grows, your BI tool should be able to handle increasing amounts of data and more complex queries without compromising performance. It's essential to choose a tool that can scale horizontally and vertically, ensuring that it can meet your future needs.
Integration capabilities are also vital. The chosen BI tool should seamlessly integrate with your existing data sources, whether they are relational databases, NoSQL databases, or data warehouses. This ensures that you can leverage all your data for comprehensive analytics and insights.
Customization and flexibility are also key considerations. The tool should allow you to tailor its features to meet your specific business requirements. This includes the ability to create custom visualizations, dashboards, and reports, as well as the ability to add new functionalities through plugins or custom code.
Another important factor is community and support. A large, active community can be a valuable resource for troubleshooting, best practices, and staying updated with the latest features and improvements. Additionally, some open source BI tools offer commercial support options, which can be beneficial for organizations that require guaranteed service levels.
Security is a non-negotiable aspect. Ensure that the tool has robust security features, including data encryption, user authentication, and access control. It's also a good idea to check if the tool has undergone security audits and has a track record of promptly addressing vulnerabilities.
Finally, consider the total cost of ownership (TCO). While open source tools are generally free, there may be costs associated with implementation, customization, training, and ongoing maintenance. It's important to factor in these costs to get a complete picture of the investment required.
By carefully evaluating these factors, you can choose the open source BI tool that best fits your organization's needs, helping you unlock the full potential of your data and drive informed decision-making.
八、CASE STUDIES OF SUCCESSFUL OPEN SOURCE BI IMPLEMENTATIONS
Several organizations have successfully implemented open source BI tools to enhance their data analytics capabilities. One notable example is a mid-sized e-commerce company that chose Metabase to streamline its reporting process. Before Metabase, the company relied on manual data extraction and Excel spreadsheets, which were time-consuming and error-prone. By implementing Metabase, the company was able to automate its reporting processes, create interactive dashboards, and enable real-time data access for its team members. This not only improved the accuracy of their reports but also saved significant time and resources.
Another success story involves a healthcare provider that implemented Redash to improve its patient care analytics. The organization needed a flexible and robust BI tool to analyze large volumes of patient data from various sources. Redash's ability to connect to multiple data sources and its powerful querying capabilities allowed the healthcare provider to gain valuable insights into patient outcomes, treatment effectiveness, and resource utilization. This enabled the organization to make data-driven decisions that improved patient care and operational efficiency.
A financial services firm also saw significant benefits from using Superset. The firm needed a scalable solution to handle its growing data needs and provide real-time analytics to its analysts and decision-makers. Superset's extensive visualization options and customizable dashboards allowed the firm to create detailed financial reports and monitor key performance indicators (KPIs) effectively. The firm's analysts could explore data more freely, identify trends and anomalies quickly, and make informed decisions that positively impacted the business.
FineReport has been successfully adopted by several organizations for its robust reporting capabilities. A manufacturing company, for example, used FineReport to consolidate its production data from various sources into a single platform. This allowed the company to create comprehensive reports that provided insights into production efficiency, equipment performance, and supply chain management. FineReport's ability to handle complex data transformations and its intuitive report designer made it easier for the company's analysts to generate accurate and actionable reports.
Similarly, FineVis has been instrumental in helping organizations with their data visualization needs. A retail chain implemented FineVis to enhance its sales analytics and customer insights. By leveraging FineVis's rich visualization options and interactive dashboards, the retail chain was able to track sales performance, understand customer preferences, and optimize inventory management. This led to improved sales strategies, better customer satisfaction, and increased profitability.
These case studies demonstrate the versatility and effectiveness of open source BI tools in various industries. Whether it's improving operational efficiency, enhancing patient care, or driving business growth, open source BI tools have proven to be valuable assets for organizations looking to leverage their data for strategic decision-making.
九、FUTURE TRENDS IN OPEN SOURCE BI TOOLS
The landscape of open source BI tools is continually evolving, with several trends shaping their future. One significant trend is the increased focus on artificial intelligence (AI) and machine learning (ML). Open source BI tools are increasingly incorporating AI and ML capabilities to provide advanced analytics, predictive modeling, and automated insights. This integration allows organizations to uncover deeper insights, identify patterns, and make more accurate predictions, ultimately driving more informed decision-making.
Real-time analytics is another growing trend. As the demand for real-time data continues to rise, open source BI tools are evolving to support real-time data processing and analytics. This enables organizations to make timely decisions based on the most current data, enhancing their agility and responsiveness to market changes.
Enhanced data visualization capabilities are also on the horizon. Open source BI tools are continuously improving their visualization options, providing more interactive and immersive ways to explore and present data. Advanced visualizations, such as augmented reality (AR) and virtual reality (VR), are being explored to offer users a more engaging and intuitive data analysis experience.
Cloud-native solutions are gaining traction as well. With the increasing adoption of cloud computing, open source BI tools are being designed to be more cloud-friendly, offering seamless integration with cloud platforms and services. This not only provides scalability and flexibility but also reduces the complexity and cost of managing on-premises infrastructure.
Collaborative analytics is another emerging trend. Open source BI tools are incorporating features that facilitate collaboration among team members, such as shared dashboards, annotations, and real-time collaboration. This fosters a more collaborative data culture within organizations, enabling teams to work together more effectively and make data-driven decisions collectively.
Data governance and security are becoming more critical as organizations handle increasing volumes of sensitive data. Open source BI tools are enhancing their data governance features, including data lineage, audit trails, and compliance checks, to help organizations manage their data more securely and comply with regulatory requirements.
Finally, the integration of natural language processing (NLP) is a trend to watch. NLP capabilities are being embedded into open source BI tools to enable users to interact with data using natural language queries. This makes data analysis more accessible to non-technical users, allowing them to ask questions and gain insights without needing to write complex queries.
These trends indicate that open source BI tools will continue to evolve, offering more advanced features and capabilities to meet the growing demands of organizations. By staying abreast of these trends, organizations can leverage the latest advancements in open source BI tools to enhance their data analytics strategies and drive better business outcomes.
相关问答FAQs:
什么是免费开源BI报表工具?
免费开源BI(商业智能)报表工具是一类软件应用程序,旨在帮助用户从各种数据源中提取、分析和可视化数据,以支持业务决策和管理。这些工具通常以开源方式提供,意味着用户可以自由地访问其源代码、自定义和分发,而无需支付许可费用。
功能和特点
免费开源BI报表工具通常具备以下功能和特点:
-
数据连接和整合: 能够连接多种数据源,如关系型数据库、NoSQL数据库、文件(如CSV、Excel等)、API等,将数据整合到一个统一的平台中进行分析。
-
数据分析和查询: 提供强大的数据分析功能,包括复杂的查询、过滤、聚合、计算等操作,以便用户可以从数据中提取有价值的见解。
-
报表和可视化: 支持创建各种类型的报表和可视化图表,如柱状图、折线图、饼图等,使用户能够直观地理解数据背后的趋势和模式。
-
自定义和扩展性: 提供灵活的定制选项和插件机制,允许用户根据特定需求调整和扩展功能。
-
安全性和权限控制: 具备数据安全性功能,如用户认证、权限管理、数据加密等,确保数据只能被授权用户访问和操作。
常见的免费开源BI报表工具
-
Metabase
Metabase 是一个简单易用的开源BI工具,支持用户通过直观的界面进行数据探索和可视化。它支持多种数据源的连接,并提供丰富的报表和图表选项。
-
Apache Superset
Apache Superset 是由Airbnb开发的现代化BI工具,支持SQL查询和交互式数据探索。它具有强大的可视化能力和丰富的仪表板功能。
-
Redash
Redash 是一个支持SQL查询的开源BI工具,可以将查询结果转换为各种图表和仪表板。它支持多种数据源,如数据库、API和文件。
如何选择适合的免费开源BI报表工具?
选择适合的免费开源BI报表工具需要考虑以下几个关键因素:
1. 数据源支持和整合能力
确保选择的工具能够连接和整合你的数据源,包括当前使用的数据库、文件格式以及其他数据来源。这可以确保你能够在一个平台上统一管理和分析数据。
2. 用户友好的界面和操作
一个直观和用户友好的界面可以显著提高工具的使用效率。查看工具提供的数据探索和报表创建功能,并确保其操作对你的团队成员来说是可接受和易学习的。
3. 报表和可视化的灵活性
不同的业务需求可能需要不同类型和格式的报表和可视化。选择一个能够支持多种图表类型,并允许用户进行自定义和调整的工具是很重要的。
4. 扩展性和定制化
考虑到未来业务的发展和变化,选择一个具有良好扩展性和定制化选项的工具可以确保你能够根据需要进行功能扩展和调整。
5. 社区支持和更新频率
开源项目通常依赖于活跃的社区来提供支持和更新。查看工具的社区活跃程度、文档完整性以及最近的更新频率,可以帮助评估其可持续性和未来发展的潜力。
免费开源BI报表工具的优缺点是什么?
优点:
-
成本低廉或免费: 开源工具通常无需支付许可费用,对预算有限的组织和个人来说成本优势明显。
-
灵活性和定制化: 可以根据具体需求自由定制和扩展功能,满足不同用户的特定需求。
-
活跃的社区支持: 通常有大量的开发者和用户参与,提供广泛的技术支持和解决方案。
缺点:
-
技术支持和维护责任: 使用开源工具需要组织或个人能够自行承担技术支持和维护的责任,可能需要更多的时间和资源投入。
-
功能和性能限制: 开源工具在某些高级功能、性能优化和企业级支持方面可能不如商业BI工具成熟和完善。
-
安全性风险: 开源工具的安全性取决于社区的反馈和更新频率,可能存在一些潜在的安全风险需要注意和管理。
综上所述,选择适合的免费开源BI报表工具需要综合考虑其功能特性、用户体验、定制化能力以及社区支持等方面,以确保能够最大化地满足你的业务需求和预算限制。
本文内容通过AI工具匹配关键字智能整合而成,仅供参考,帆软不对内容的真实、准确或完整作任何形式的承诺。具体产品功能请以帆软官方帮助文档为准,或联系您的对接销售进行咨询。如有其他问题,您可以通过联系blog@fanruan.com进行反馈,帆软收到您的反馈后将及时答复和处理。


