An asana dashboard shows your work and team progress in one spot. You can follow each project and see updates right away. You can also notice where someone needs help. Dashboards help new users learn tasks and make teamwork simple. Many teams use dashboards to report faster and with fewer mistakes. FineReport lets you add more data and see important details with better pictures. The table below explains how asana dashboards help you see projects and work together better.
| Evidence Description | Impact on Project Visibility and Collaboration |
|---|---|
| All work tracked in Asana | Makes it easier to pass work and track tasks, so teams work together better. |
| Dashboards provide visibility across the operations team | Weekly reports are faster and more correct, so project managers save time. |
Try using a dashboard for your next project. You will see how much easier it is to stay organized.
What Is an Asana Dashboard?
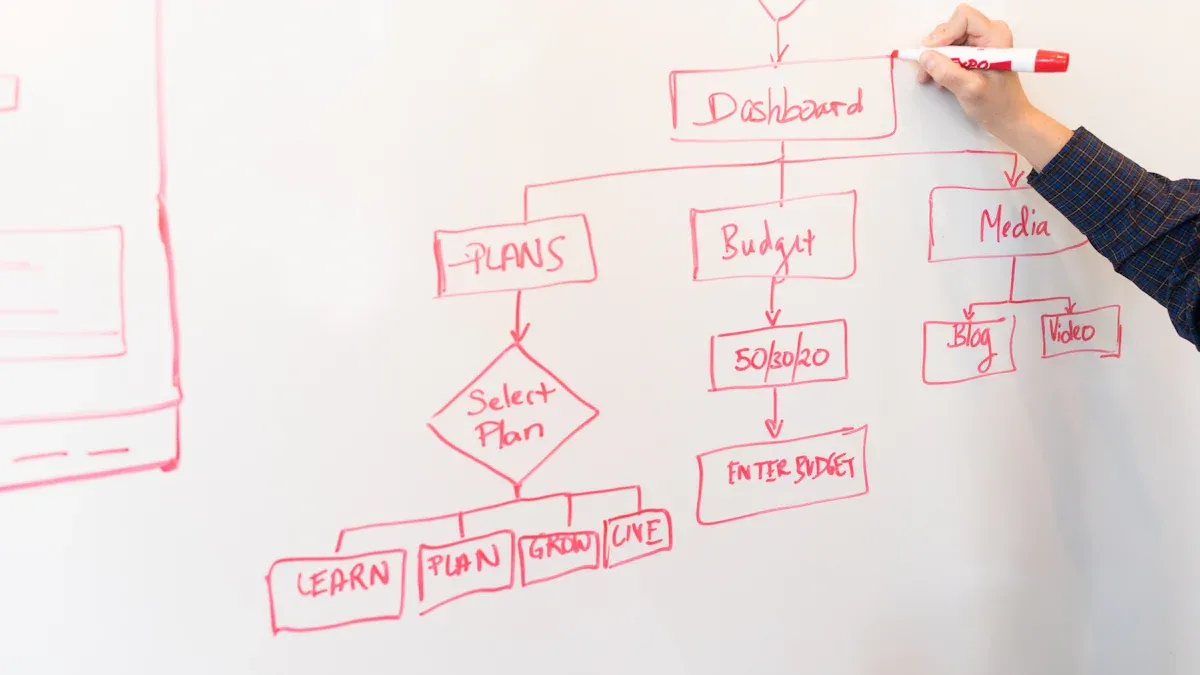
Asana Dashboard Overview
When you use asana, you see your work in one place. The project overview dashboard shows what your team is doing. You can watch each task move forward. Updates appear right away, so you know what is happening. The dashboard helps you track progress and find problems early.
The project overview dashboard has a few main parts:
- A picture display that is simple to use
- Metrics you can change for your needs
- Data from many places and teams
- A setup that lets you get current data fast
You can check your team’s work anytime with the dashboard view. This makes asana good for new users and teams with experience.
Tip: The project overview dashboard keeps you organized and helps everyone work together.
Key Features and Benefits
The asana dashboard is easy and simple to use. You do not need much training to start. You can set up your dashboard fast and begin tracking your team’s work.
There are four main reporting dashboards in asana:
- Strategic: Looks at long-term plans with big metrics.
- Analytical: Has lots of data for finding trends.
- Operational: Shows short time frames and work steps.
- Tactical: Tracks how people or projects are doing.
With these dashboards, you can:
- See your team’s progress quickly
- Change what you see for your goals
- Get data from different teams for a full view
- Make better choices with fresh information
Asana dashboards are easier to use than some other tools. Some platforms, like Teamhub.com, let you change more things and have built-in Data Apps. But asana makes dashboards simple and quick to set up. You can use integrations for more advanced reports if you want extra features.
Note: If you want a dashboard that is easy and helps your team work together, asana is a good pick.
FineReport Integration for Enhanced Dashboards
You can make your asana dashboard stronger by adding FineReport. FineReport lets you connect data from many places and build advanced dashboards. You can pull in info from databases, Excel, and other systems. This gives you a full project overview dashboard with all the details you need.
With FineReport, you can:
- Build custom dashboards with drag-and-drop tools
- Use 3D charts and interactive pictures for better insights
- See your dashboards on any device, like phones and tablets
- Set up reports and alerts for your team
FineReport helps you turn your asana dashboard into a smart project tool. You can spot trends, track key numbers, and share results with your team. Many companies use FineReport to make their dashboards better and help them make good choices every day.
Pro Tip: Try using asana with FineReport to get the most out of reporting dashboards for your team.
Set Up Your Asana Dashboard
Creating a Custom Asana Dashboard
You can make a dashboard in asana to watch your project and team. First, get your accounts ready. You need an asana account and at least one project. If you want more data, make a Geckoboard account. Then, link asana to Geckoboard. Pick the asana integration and set up a safe connection. Choose the project you want to show. Decide what details you want to display. Add your first widget to show live data. You can add more widgets for extra details. When you are done, share your dashboard with your team by clicking the share button.
Tip: Change your dashboard so it fits your team. This helps you see updates and makes tasks easier to manage.
New users sometimes forget to give out tasks or set due dates. You can stop this by making sure everyone knows what to do. If you think the dashboard is hard to use, try training sessions. These sessions help your team learn faster. Making dashboards your own may look hard. A quick lesson on making and changing charts can help.
Connecting Data Sources with FineReport
FineReport lets you link asana data from many places. You can make a dashboard that gets info from databases, Excel files, and other systems. FineReport uses safe connections and strong protection for your data. Only people who should see the dashboard can view it. Vendor risk plans and incident response plans keep your info safe.
FineReport makes it easy to build your own asana dashboard. You can use drag-and-drop tools to design it. You can see your dashboards on any device, like phones and tablets. This helps you manage your project from anywhere.

Choosing Metrics and Visual Elements
When you make a dashboard, pick metrics that show how your project is going. Common metrics are project progress percentage, team member completion status, and custom fields for special tracking. You can use number custom fields to add up story points and watch progress.
| Metric | Description |
|---|---|
| Project Progress Percentage | Shows how much of the project is done. |
| Team Member Completion Status | Shows each team member's finished tasks. |
| Custom Fields | Lets you track details special to your project. |
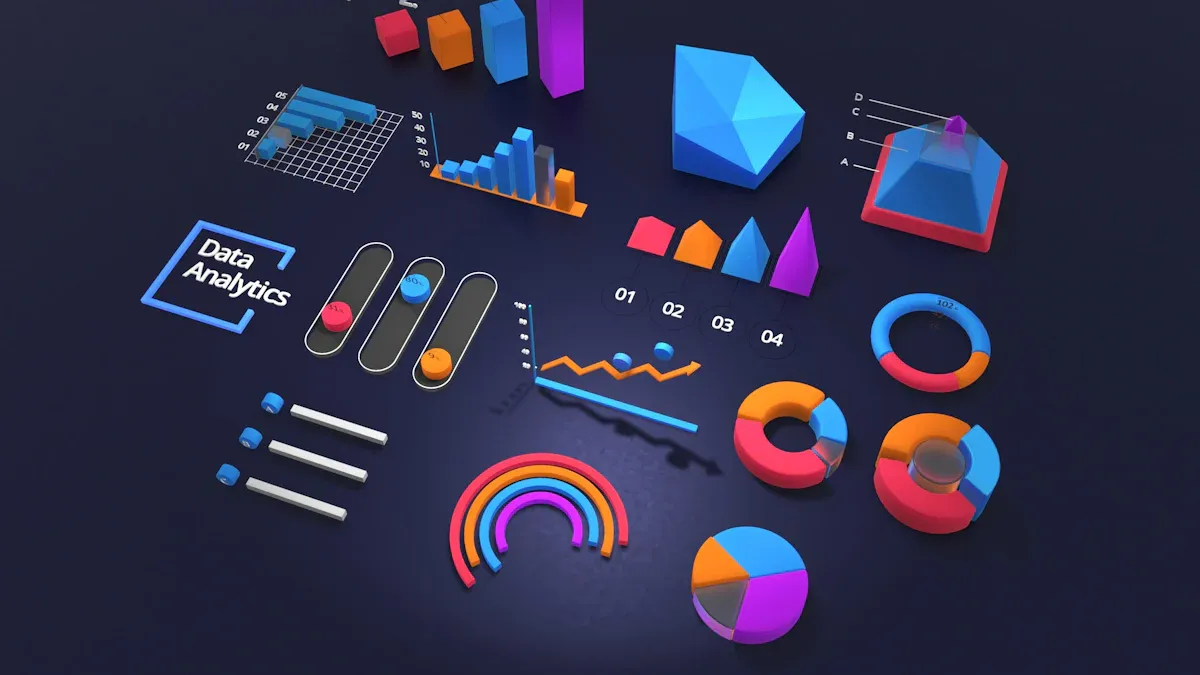
Pick charts and graphs that are easy to read. Bar charts are good for comparing things. Line charts show changes over time. Pie charts show parts of a whole. Use colors and sizes to make important metrics stand out. Do not use charts that are too hard to understand.
Note: Simple visual elements help everyone get the dashboard fast. This makes project management and task tracking better.
Using Asana Dashboards for Project Success
Tracking Progress and KPIs
Asana dashboards help you watch projects as they happen. You set up a dashboard for your team to see updates. Everyone gets the same info, even if they work somewhere else. The dashboard shows KPIs that help you check how well things are going. You do not need to send updates by hand because the dashboard does it for you. This means fewer mistakes and everyone knows what is happening.
You should look at KPI data often, not just when the project ends. Watching KPIs in real time helps you find problems early and make good choices. Here are some KPIs you should watch:
| KPI | Description |
|---|---|
| Project Timeline | Checks if tasks finish when they should. |
| Project Budget | Watches the money used for the project. |
| S.M.A.R.T KPIs | Looks at goals that are clear, can be measured, can be reached, matter, and have a time limit. |
Making Data-Driven Decisions with FineReport
FineReport helps you use your asana dashboard better. You can connect data from places like databases and Excel files. This lets you see everything about your project. FineReport gives you 3D charts and pictures you can click, so you spot trends fast. You can look at your dashboard on any device, so you can make choices anywhere. FineReport helps your team work together and make smart choices using real data.

Sharing Dashboards and Setting Notifications
It is easy to share your dashboard in asana. You can use Universal Reporting to make a Leadership Dashboard for your team. Add team members so everyone sees updates. Start with easy charts and change them as your team gets bigger.
Notifications help your team know what is new. Project owners can set notifications for new users. This makes sure everyone gets the right news and not too many messages. If you set up notifications well, new team members learn faster and do not miss important things.
Tip: Keep your dashboard easy to use and make notifications simple. This helps your team stay on track and finish projects on time.
You can make your project better by using asana dashboards with FineReport. This mix lets you see updates as they happen and watch your team’s progress. It also helps you make good decisions. Build your own dashboard to keep projects moving forward. When you are ready, try new tools like workload, capacity planning, and AI integration. The table below lists more choices you can use for better project management.
| Feature | Description |
|---|---|
| Workload | See each person’s tasks and change resources fast. |
| Capacity Planning | Look at staffing on projects to plan better. |
| AI Integration | Get smart updates and workflows for easier work. |
| Customizable Charts | Show progress and milestones in many ways. |
| Cross-Project Visibility | Watch many projects at once for a bigger view. |
| Resource Management | Check and balance workloads so no one gets too tired. |
| Universal Reporting | Find insights from your whole organization. |
| Shareable PDF Reports | Share progress with others in a simple way. |
Tip: Try these features to help your team grow and handle more projects easily.


FAQ

The Author
Lewis
Senior Data Analyst at FanRuan
Related Articles

How to Build an Investment Portfolio Reporting Dashboard for Executives: KPIs, Benchmarks, and Drill-Down Views
Investment portfolio reporting for executives is not about showing every holding, transaction, and chart your investment team can produce. It is about giving CEOs, CFOs, CIOs, boards, and investment committees a fast, re
Yida YIn
Jun 25, 2026

12 KPI Reporting Examples for Executive Dashboards: What to Show in Weekly, Monthly, and Quarterly Reviews
Executive leaders do not need more data. They need decision ready $1 examples that match how often they review the business and what actions they are expected to take. A weekly $1 should surface fast moving risks and per
Yida YIn
Jun 25, 2026

How to Build a Digital Marketing Reports Dashboard: Executive Examples, KPIs, and Templates
A $1 is the control layer that helps executives and marketing leaders turn scattered channel data into fast, confident decisions. If you are a CEO, CMO, operations director, or marketing analytics lead, the real problem
Yida Yin
May 07, 2026