In 2025, businesses rely on KPI tracking software to stay competitive in a fast-paced market. This software enables you to monitor performance through real-time dashboards, ensuring your team aligns with organizational goals. With centralized data, you can make faster decisions and adapt strategies instantly to meet customer needs or market shifts. Tools like FineBI and FineReport excel in providing dynamic dashboards and seamless data integration, offering a significant edge over traditional solutions.
The following are the Top 10 KPIs Tracking Software to Boost Performance in 2025:
These platforms simplify KPI tracking, helping you allocate resources effectively and focus on initiatives that deliver the most value.
The data panel and system construction of the cases in this article are implemented by FanRuan's products. Click the button below to use the functions of the latest version of FanRuan's products for free, come and try it!
KPI tracking software is a tool that helps organizations define, monitor, and manage their key performance indicators. These indicators are measurable metrics used to evaluate progress toward strategic goals. The software consolidates data from multiple sources into a centralized platform, enabling you to visualize and analyze performance metrics through interactive dashboards. With features like real-time tracking and custom dashboards, KPI software empowers you to make informed decisions and align your strategies with organizational objectives.
FineBI and FineReport excel in this domain by offering seamless integration capabilities and advanced visualization tools. FineBI’s self-service analytics and FineReport’s pixel-perfect reporting make them ideal for businesses seeking comprehensive KPI tracking solutions. Unlike traditional tools, these platforms simplify complex data analysis, ensuring that even non-technical users can access actionable insights.
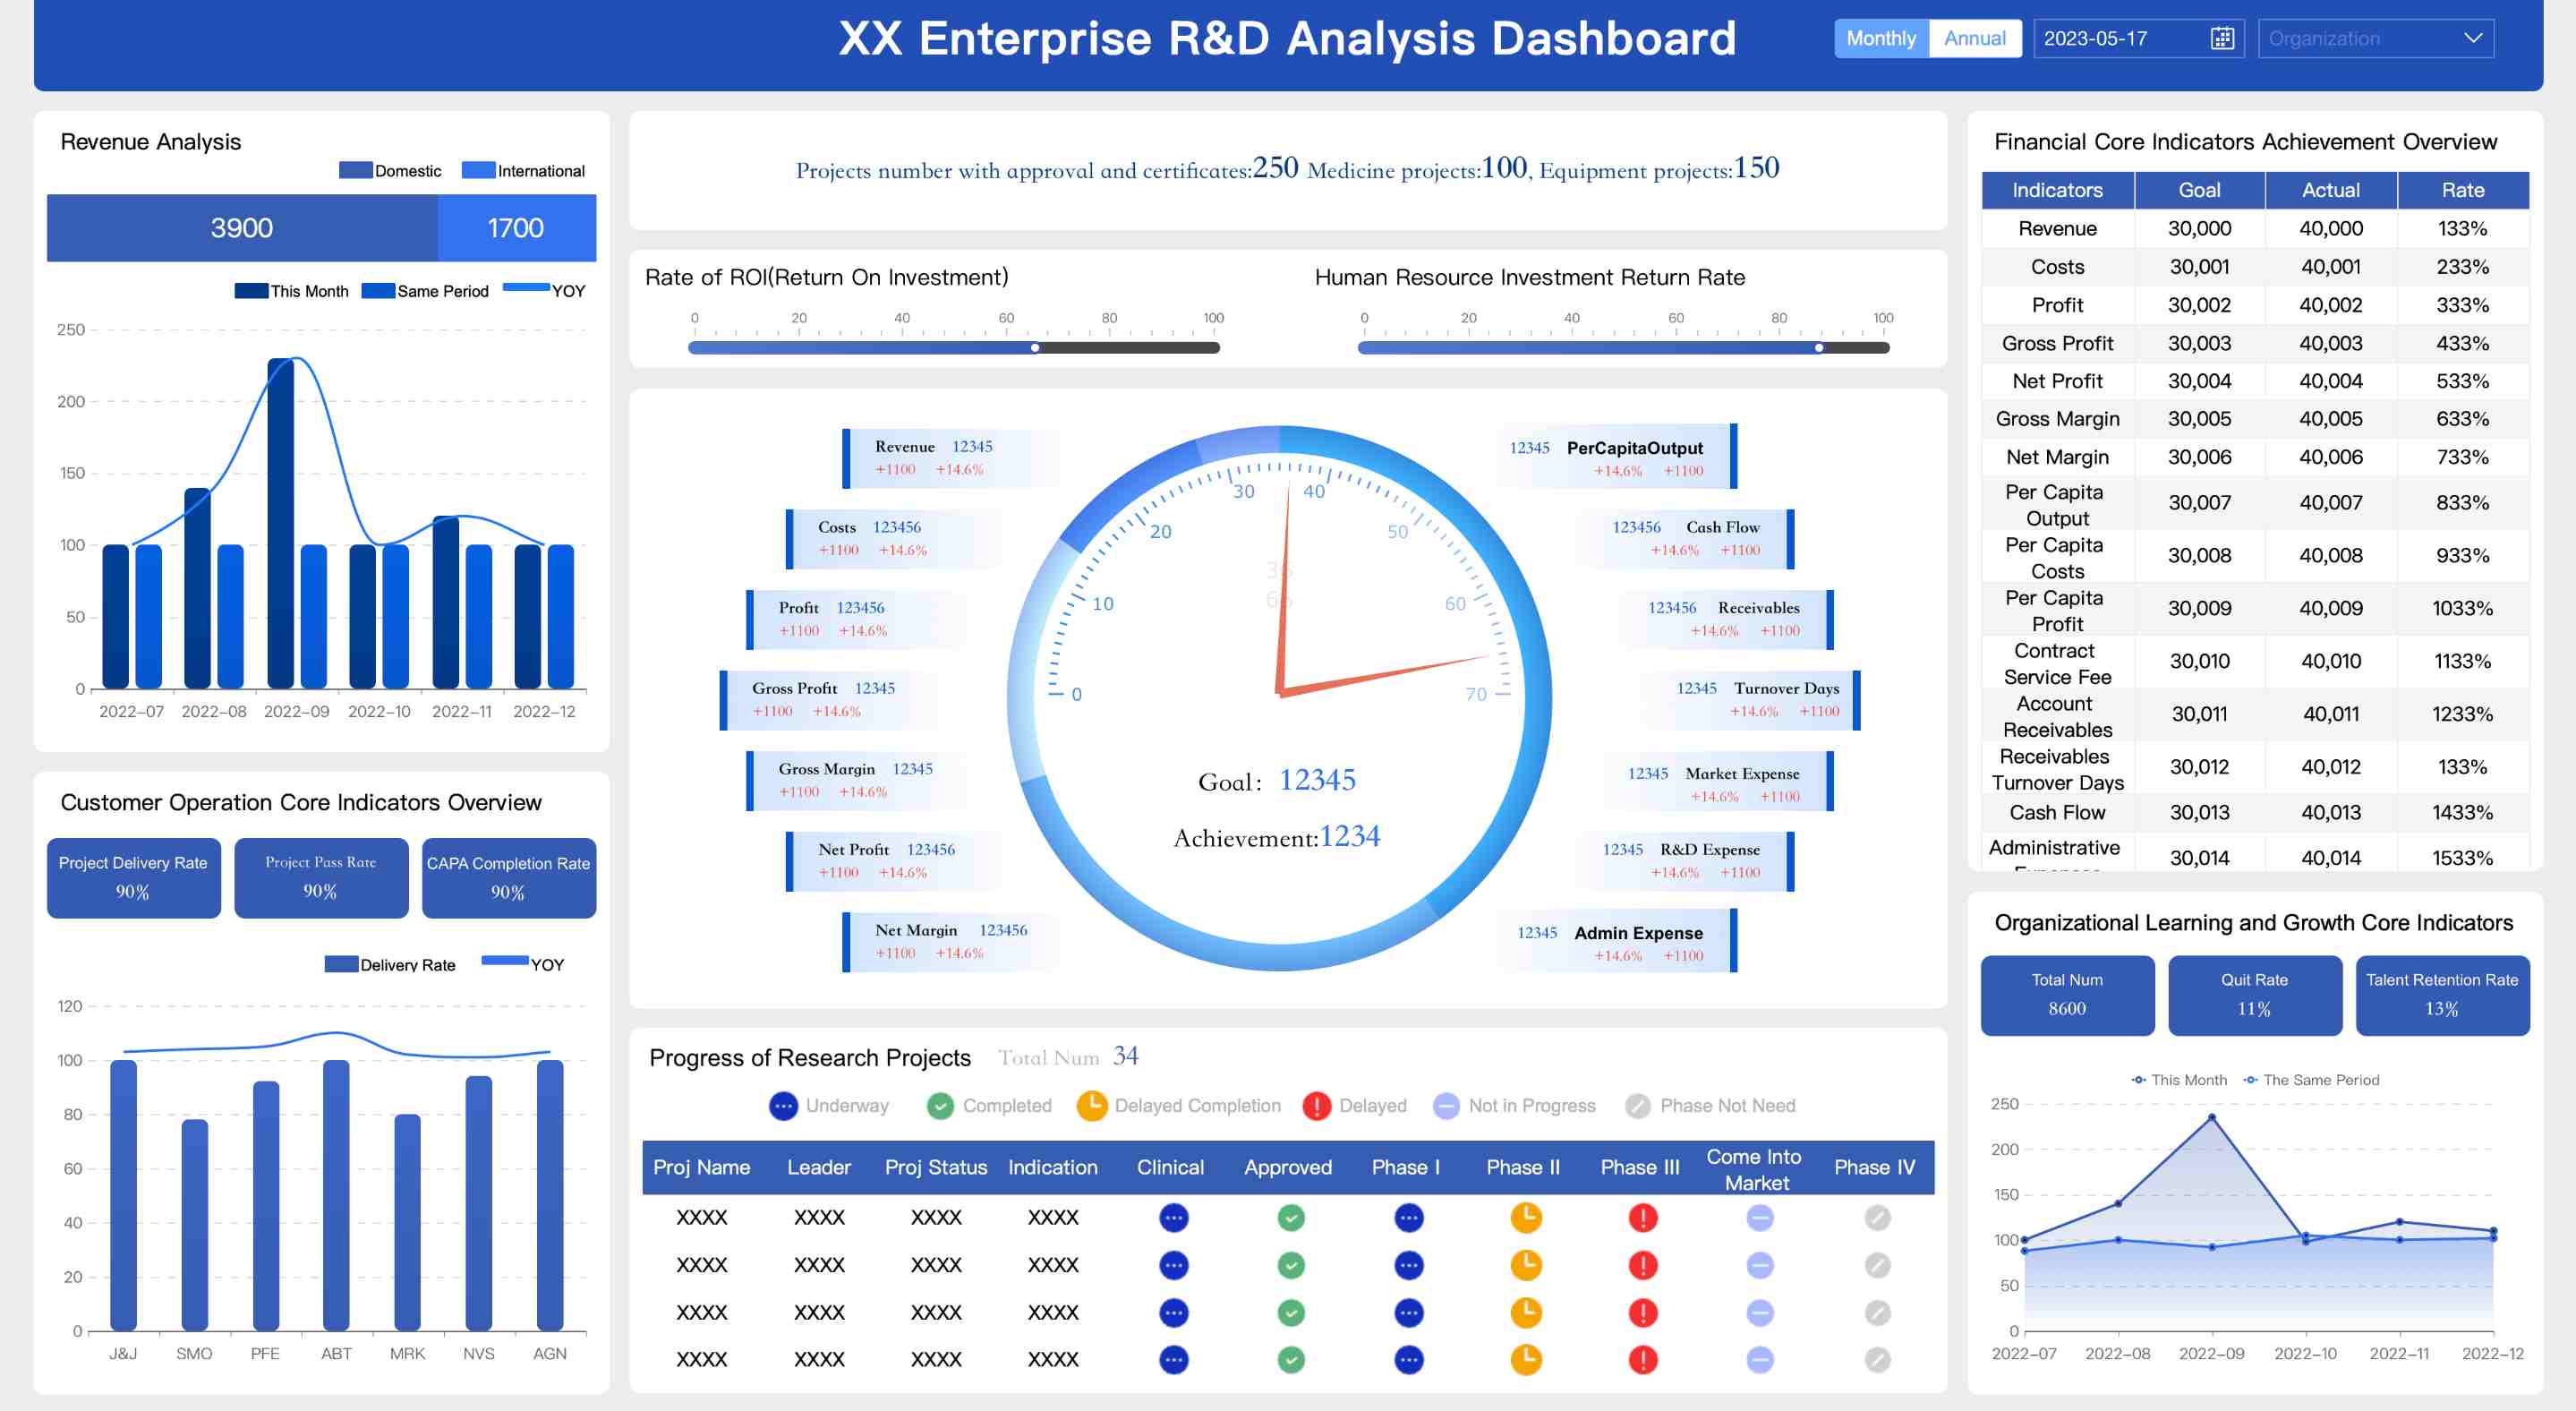
KPI tracking software provides real-time insights into your organization’s performance. This capability ensures you can identify trends, address issues, and seize opportunities as they arise. For example, FineReport’s automated dashboards allow you to monitor KPIs like sales growth or customer retention instantly, reducing the time spent on manual reporting. Real-time data integration also enhances decision-making by keeping your team updated with the latest metrics.
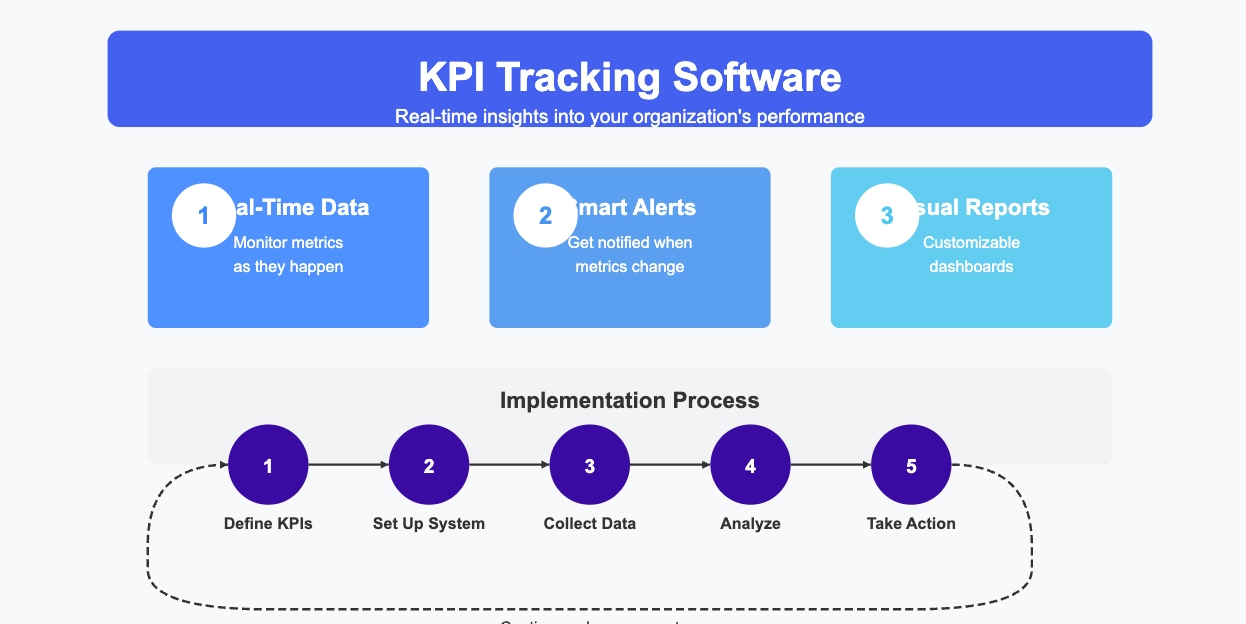
With KPI software, you can base decisions on solid data rather than assumptions. Tools like FineBI offer predictive analytics, helping you anticipate future trends and adjust strategies proactively. Additionally, centralized dashboards promote accountability by providing a transparent view of performance across departments. This visibility ensures that everyone stays aligned with organizational goals.
KPI tracking software fosters collaboration by aligning individual and team objectives with company-wide goals. FineBI’s role-based access control ensures that each team member views only the data relevant to their responsibilities. This feature enhances focus and reduces distractions, making it easier to track progress and achieve targets.
KPI tracking software plays a crucial role in monitoring sales and marketing metrics. For instance, you can track KPIs like lead conversion rates, customer acquisition costs, and campaign ROI. FineBI simplifies this process with its drag-and-drop interface, enabling marketing teams to analyze data without relying on IT support. By visualizing these metrics, you can identify areas for improvement and optimize your marketing strategies.
In finance, KPI software helps you monitor budgets, cash flow, and profitability. FineReport’s ability to integrate data from multiple sources ensures accurate financial reporting, reducing errors and saving time. Operationally, you can track metrics like production efficiency and resource utilization. FineReport’s automated scheduling feature ensures that KPI reports are delivered to stakeholders on time, enhancing operational efficiency.
Understanding customer behavior is vital for long-term success. KPI tracking software enables you to measure customer satisfaction through metrics like Net Promoter Score (NPS) and churn rate. FineBI’s advanced analytics allow you to drill down into customer data, uncovering insights that help improve retention strategies. By addressing customer pain points proactively, you can build stronger relationships and foster loyalty.
Tip: Choosing the right KPI tracking software can significantly impact your business performance. FineBI and FineReport stand out for their user-friendly interfaces, robust integration capabilities, and advanced analytics, making them excellent choices for businesses of all sizes.
Choosing the right KPI tracking software can significantly impact your ability to monitor and achieve your business goals. Here are the key factors you should consider:
A user-friendly interface ensures that your team can quickly adapt to the software without extensive training. The System Usability Scale (SUS) is a reliable benchmark for evaluating software usability. A score of 68 or higher indicates above-average ease of use. Look for features like intuitive navigation, drag-and-drop functionality, and customizable dashboards. These elements simplify the process of tracking performance metrics and creating KPI reports.
FineBI and FineReport excel in usability. FineBI’s drag-and-drop interface allows even non-technical users to analyze data effortlessly. FineReport’s spreadsheet-like design ensures that report developers can create pixel-perfect dashboards with minimal effort. Compared to other tools, these platforms reduce the learning curve, enabling faster adoption across teams.

Tip: Prioritize software with high usability ratings to ensure smooth implementation and user satisfaction.
Integration capabilities are critical for seamless KPI tracking. The software should connect with your existing tools, such as CRM, ERP, and financial systems, to consolidate data into a unified platform. This ensures accurate and real-time performance metrics without manual data entry.
FineReport stands out with its ability to integrate over 100 data sources, including relational databases and big data platforms. FineBI complements this by enabling real-time data synchronization, ensuring that your dashboards always reflect the latest information. Unlike many competitors, these tools offer robust API support, making them ideal for businesses with complex data ecosystems.
| Criteria | Weighting Score | Description |
|---|---|---|
| Software Integration | N/A | Ability to integrate with other tools for seamless KPI management. |
| Data Security | N/A | Compliance with data protection standards to secure sensitive business data. |
Your KPI software should grow with your business. Customizable dashboards and scalable architecture ensure that the software remains relevant as your data volume and complexity increase. Recent trends show that users demand tailored dashboards to enhance interaction and usability.
FineBI and FineReport lead in customization and scalability. FineBI offers customizable dashboards that adapt to specific user needs, while FineReport supports large-scale deployments with its enterprise-grade architecture. These features make them suitable for businesses of all sizes, from startups to multinational corporations.
| Trend | Description |
|---|---|
| Customizable Dashboards | Users are increasingly demanding dashboards that can be tailored to their specific needs, enhancing user experience and interaction. |
| Scalability | The software is designed to handle increasing data volumes and complexities, ensuring it meets evolving business requirements. |
Note: Scalable and customizable software ensures long-term value, saving you from frequent upgrades or replacements.
By focusing on usability, integration capabilities, and scalability, you can select a KPI tracking software that aligns with your business needs. FineBI and FineReport offer a perfect balance of these features, making them top choices for businesses aiming to streamline KPI tracking and reporting.
When selecting KPI tracking software, pricing plays a crucial role in determining its overall value. You want a solution that balances cost with features, ensuring you get the most out of your investment. Here's a breakdown of typical pricing tiers and what they offer:
| Plan Type | Average Price Range | Common Features Included |
|---|---|---|
| Basic | Free to $20/user/month | Essential KPI tracking, basic reporting, limited integrations |
| Professional | $20 to $50/user/month | Advanced analytics, increased integration options, additional user accounts |
| Enterprise | $50 to $150/user/month | Customizable dashboards, full integration capabilities, premium support |
| Free Option | $0 | Access to core features, limited data sources, basic support |
FineBI and FineReport stand out in terms of value for money. FineBI offers a self-service analytics platform that simplifies data exploration and KPI tracking without requiring extensive IT support. Its professional and enterprise plans provide advanced features like real-time dashboards and role-based access control, making it ideal for growing businesses. FineReport, on the other hand, excels in creating pixel-perfect reports and integrating data from over 100 sources, ensuring accurate and comprehensive performance monitoring. Compared to competitors, these tools deliver exceptional scalability and customization at competitive prices.
Tip: Opt for software that aligns with your business size and needs. FineBI and FineReport offer flexible pricing plans, ensuring you only pay for the features you use.
Effective customer support and training resources are essential for maximizing the benefits of KPI software. Without proper guidance, teams may struggle to utilize the software's full potential. FineBI and FineReport excel in this area by providing comprehensive support and training programs.
Organized training sessions and workshops help your team understand the software better. These sessions cover everything from defining KPIs to using dashboards effectively. FineBI’s intuitive interface reduces the learning curve, while FineReport’s spreadsheet-like design ensures quick adoption. Both tools also offer role-specific training, addressing the unique needs of different departments.
Here’s how strong training programs can empower your team:
Additionally, FineBI and FineReport provide robust customer support. Their dedicated teams assist with technical issues, ensuring minimal downtime. For example, a financial services provider improved their Customer Satisfaction Score (CSAT) by addressing training gaps, leading to repeat business. Similarly, a hotel chain used FineBI’s dashboards to streamline booking processes, enhancing customer reviews.
Note: Comprehensive training and responsive support ensure your team can fully leverage the software, driving better performance and decision-making.
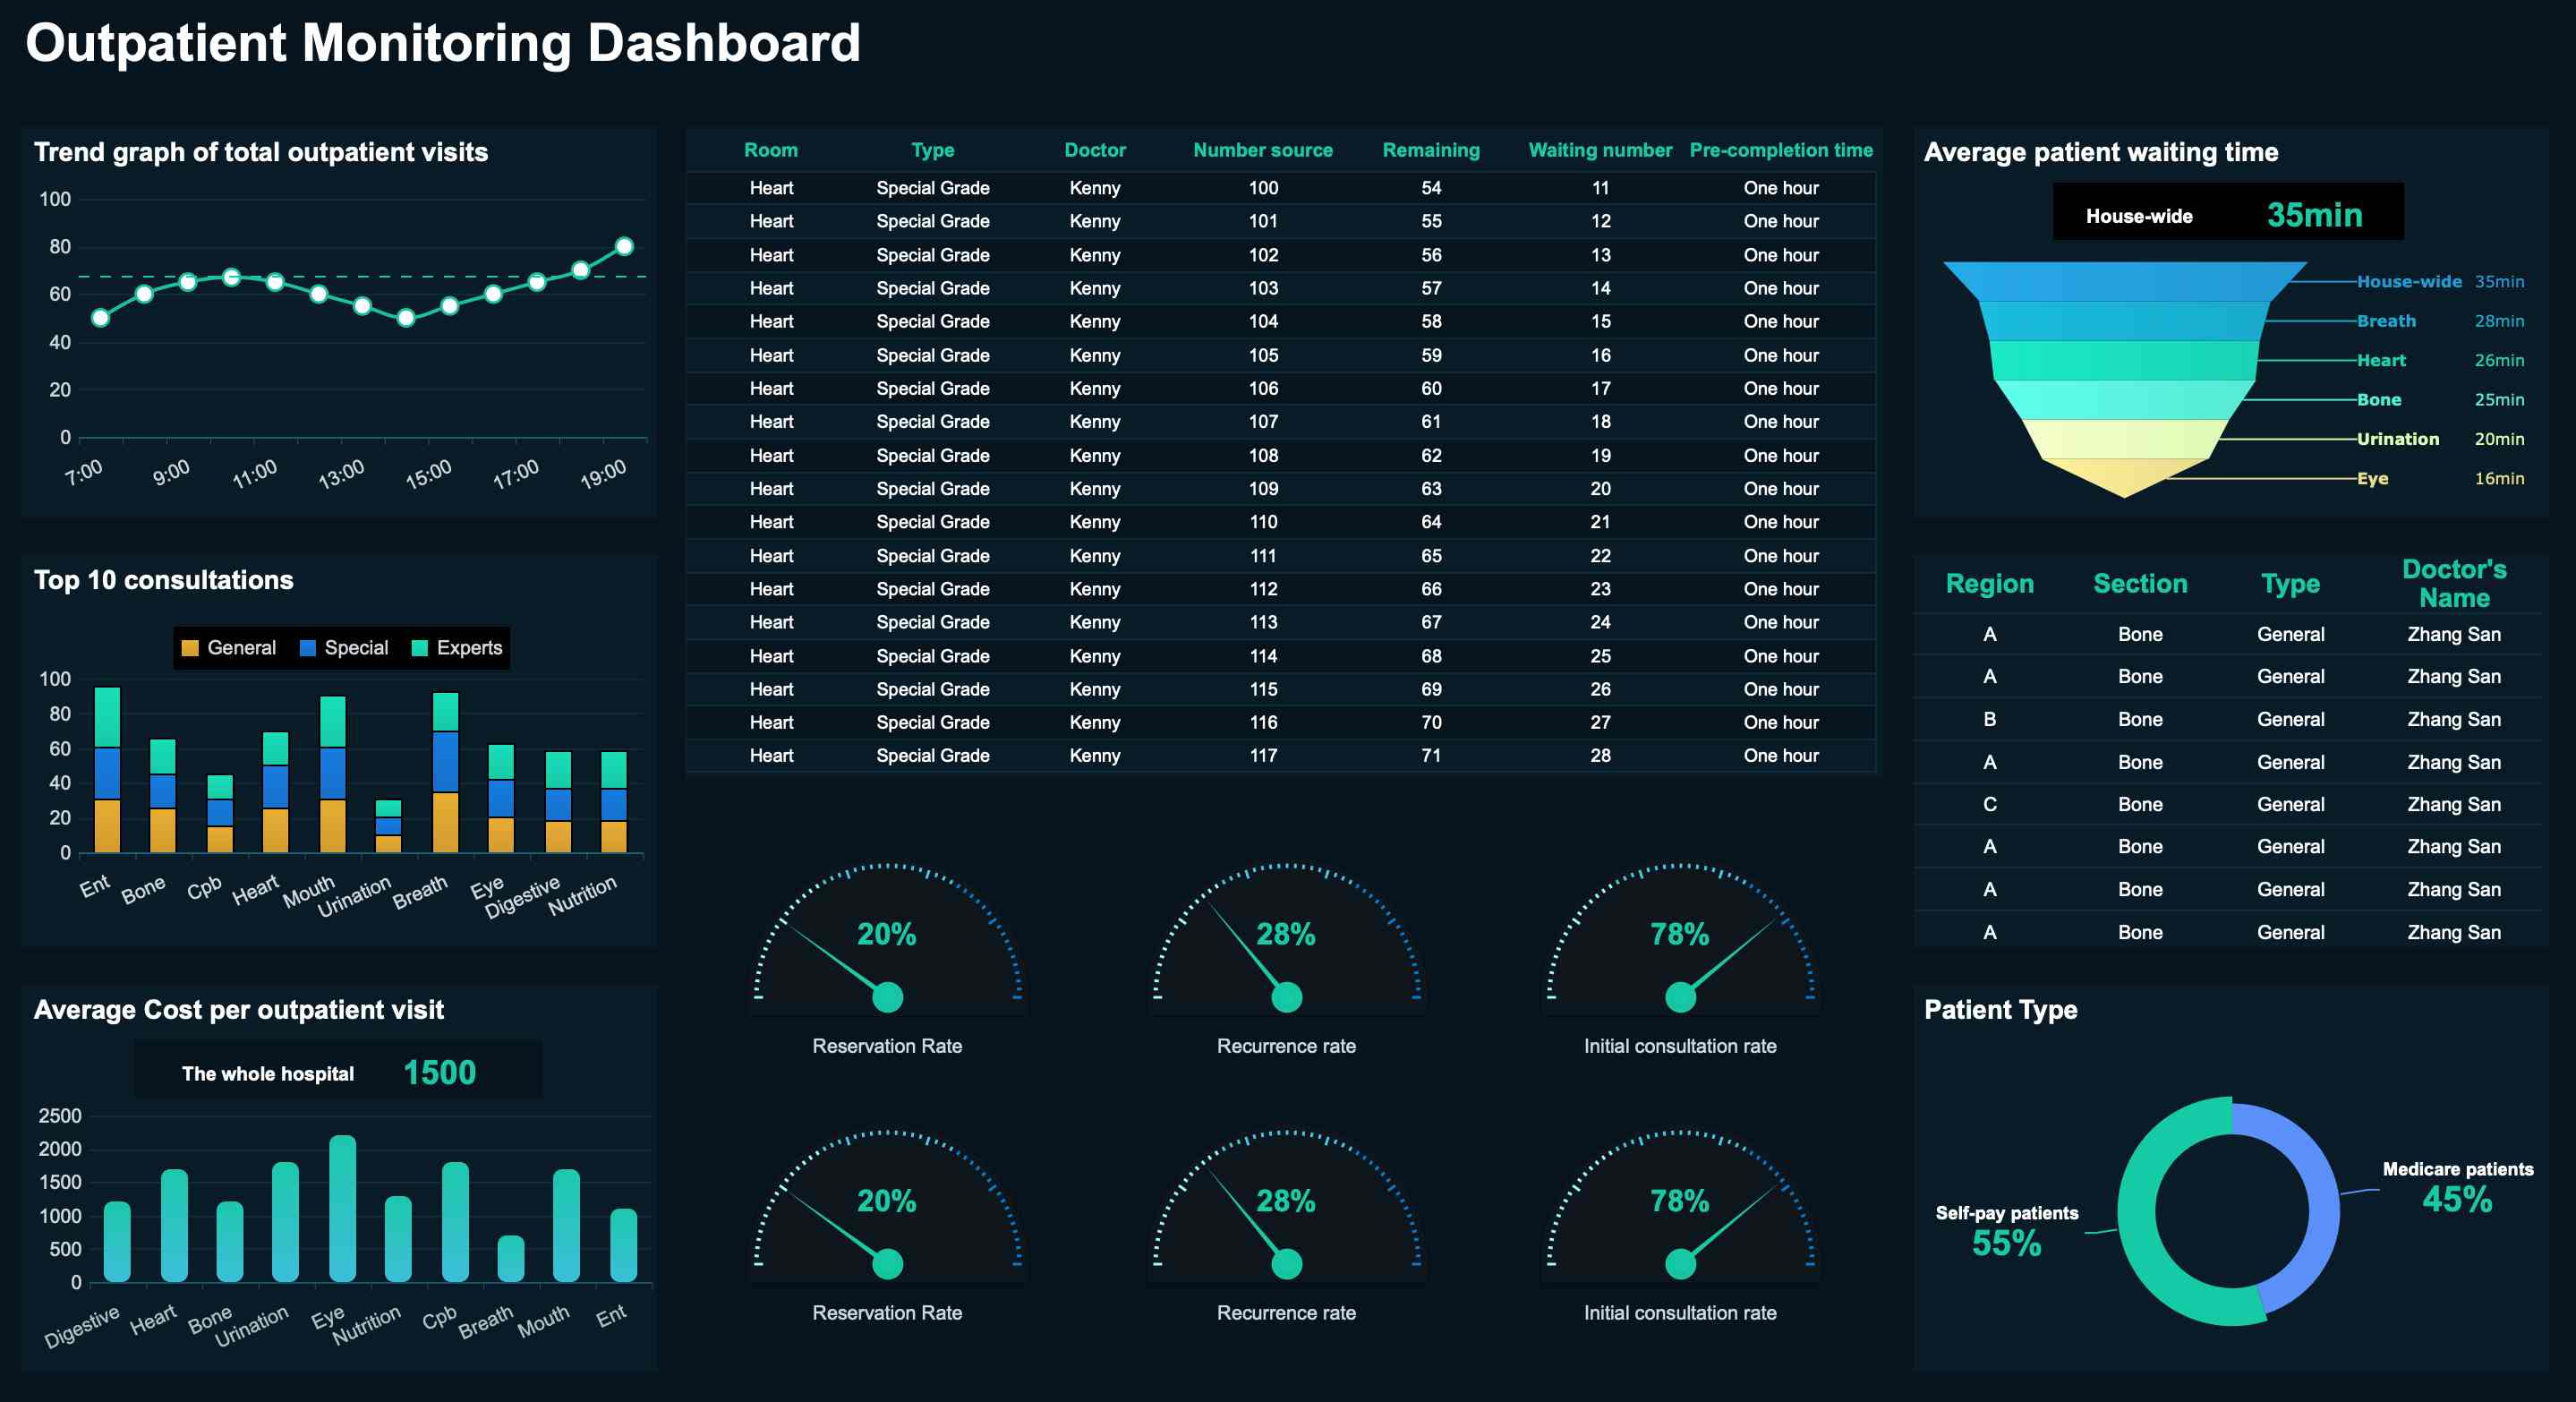
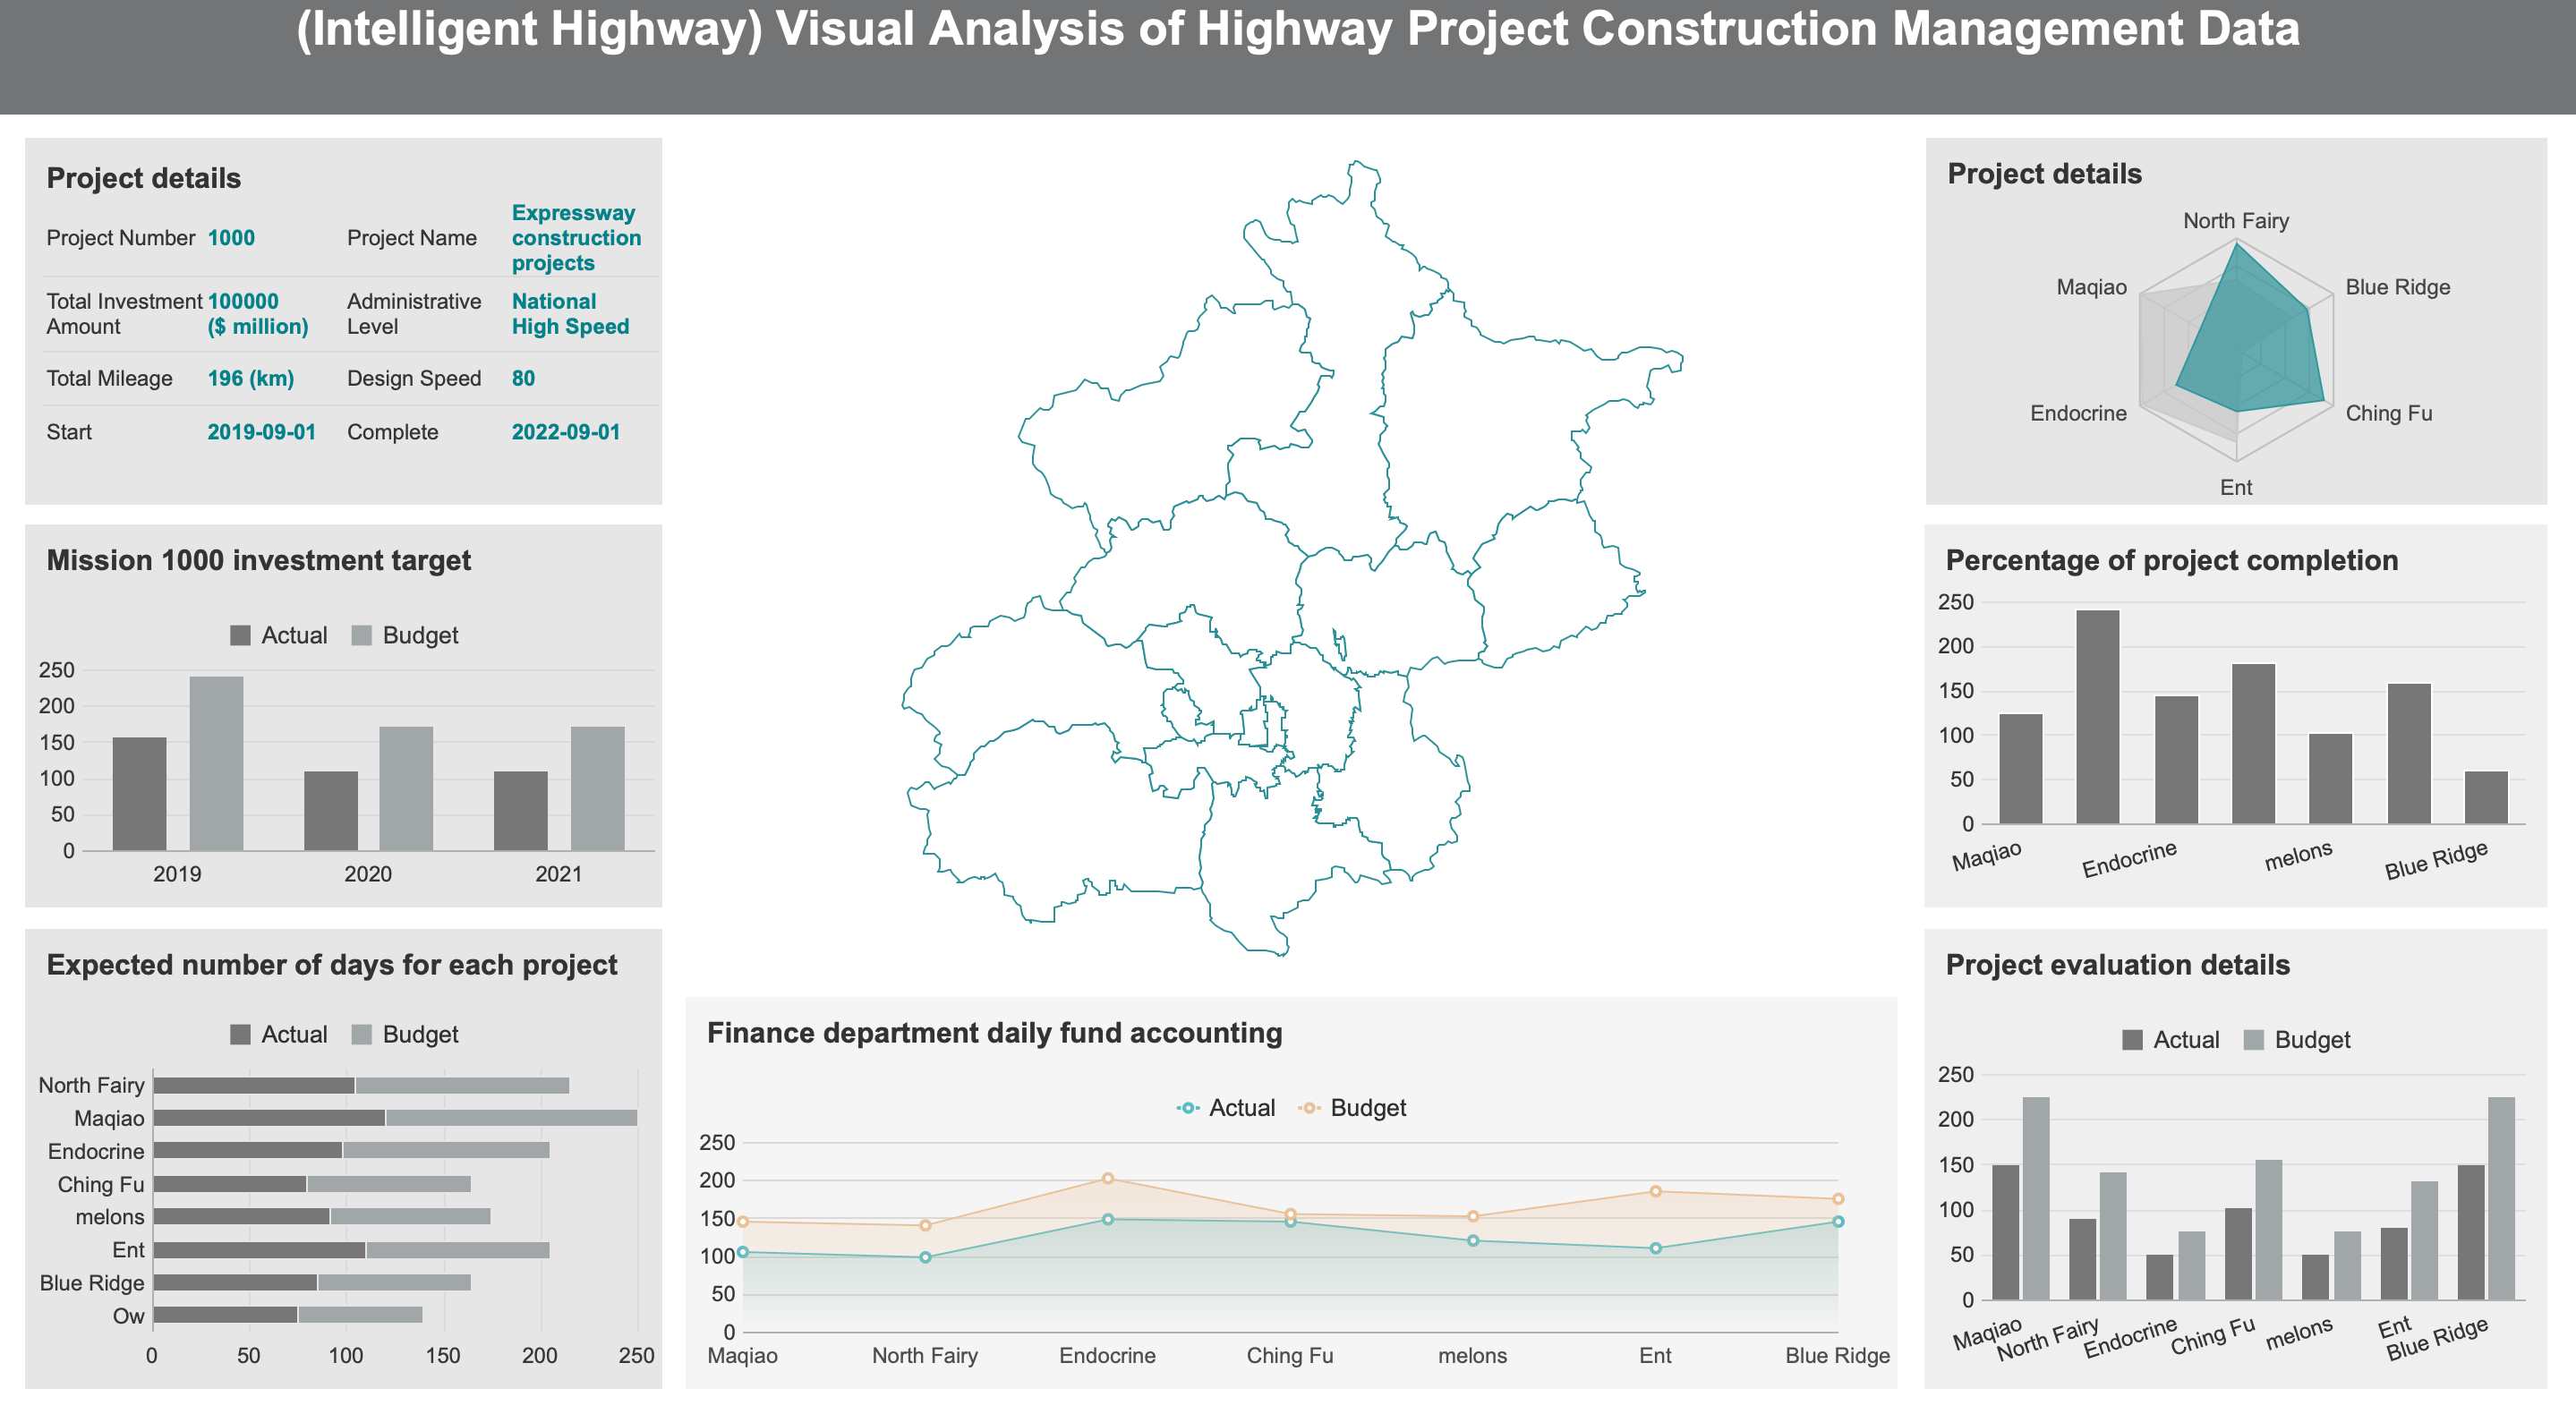
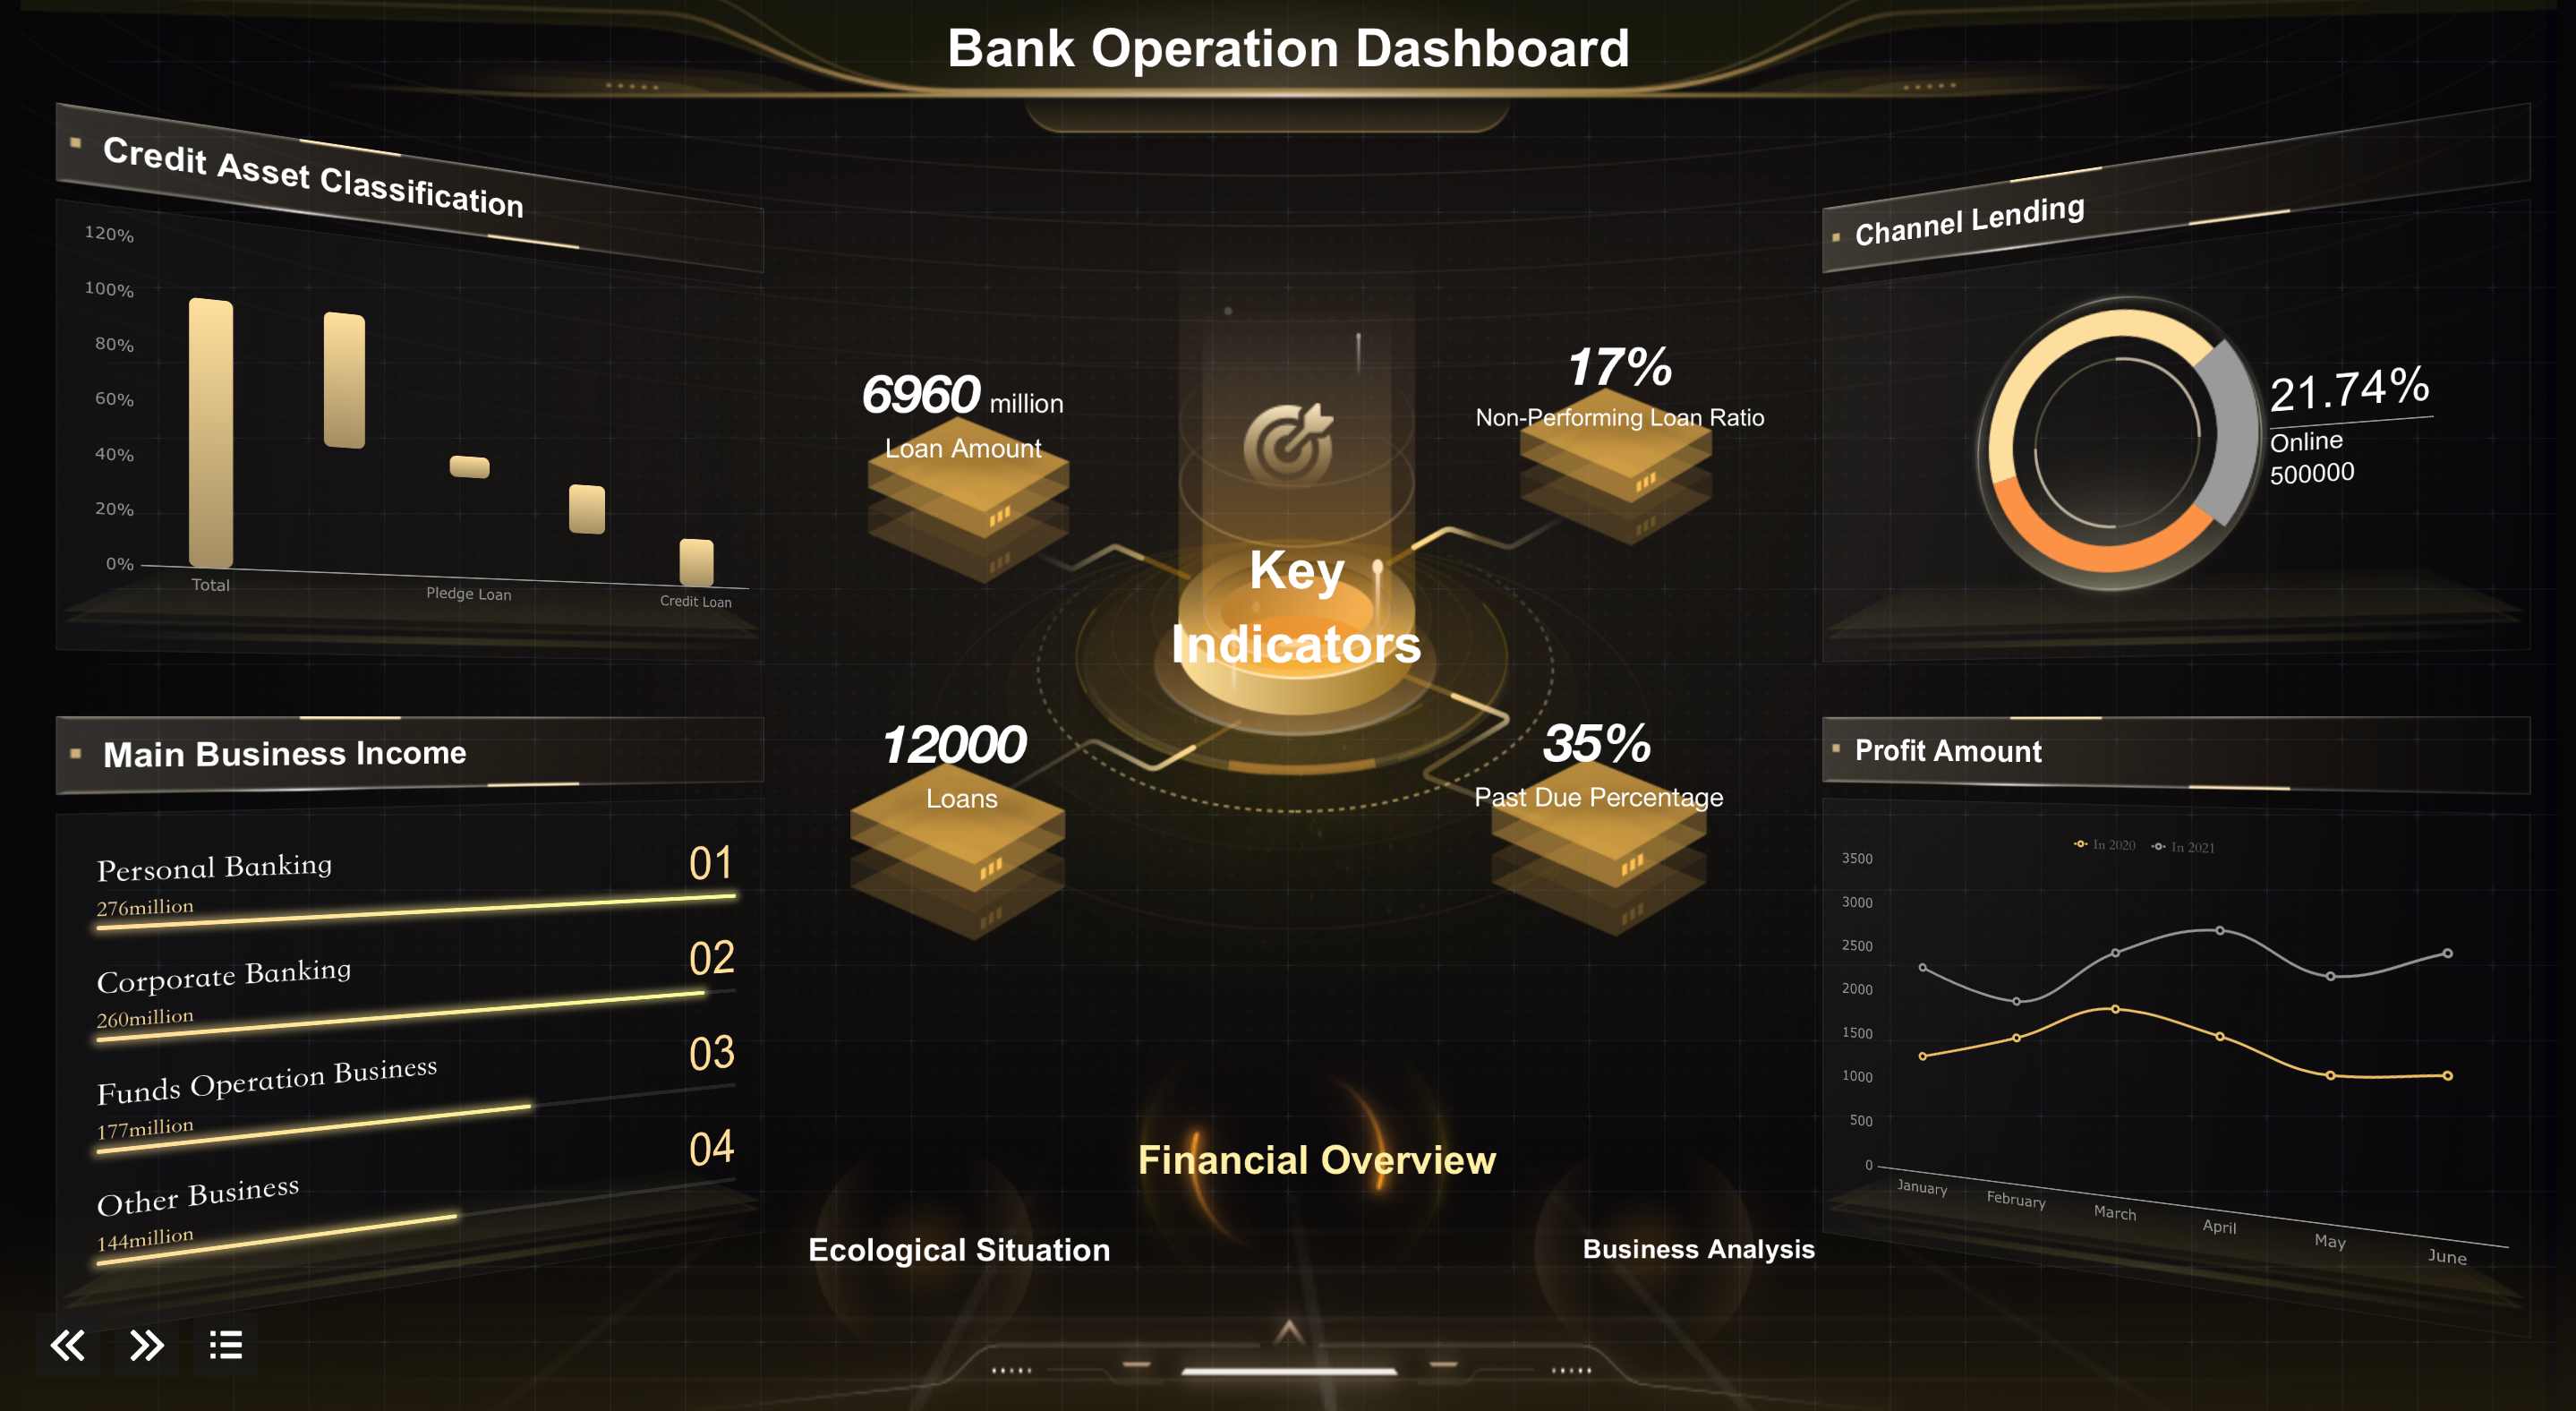
FineReport offers a robust suite of features tailored for enterprise-level KPI tracking. Its customizable dashboards allow you to display critical metrics in a visually appealing format. The software integrates seamlessly with over 100 data sources, ensuring comprehensive data consolidation. FineReport also excels in real-time data updates, enabling you to monitor performance metrics instantly. Its pixel-perfect reporting capabilities make it ideal for creating detailed KPI reports that meet professional standards.
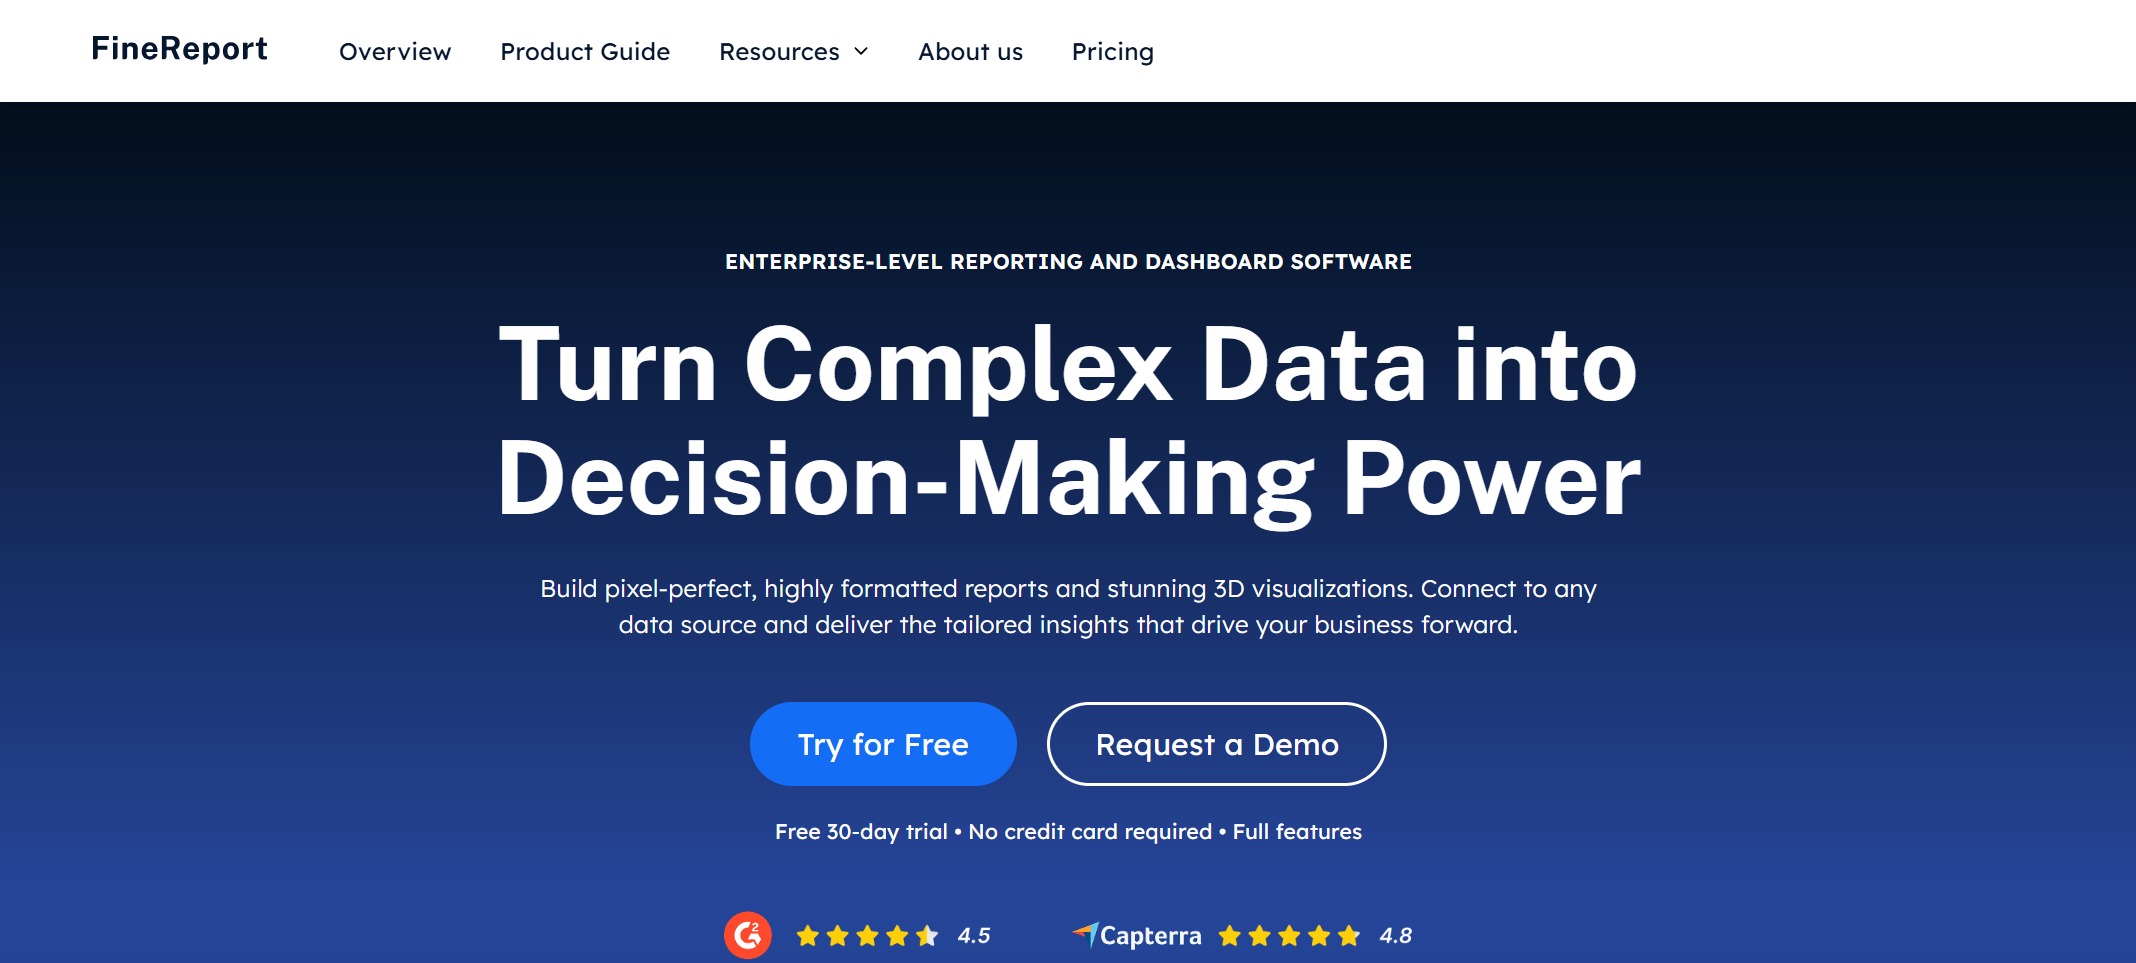
Website: https://www.fanruan.com/en/finereport
| Key Feature | Description |
|---|---|
| Customizable dashboards | Tailor dashboards to display the most critical metrics for your business. |
| Real-time data updates | Instantaneous data feeds for faster, better-informed decisions. |
| Integration capabilities | Seamless connectivity with other applications and tools already in use. |
| Data visualization tools | Transform complex data into easy-to-understand graphs and charts. |
FineReport simplifies KPI tracking by automating report generation and providing real-time insights. You can track metrics like sales growth, operational efficiency, and customer satisfaction with ease. Its user-friendly interface reduces the learning curve, making it accessible even for non-technical users. The software’s advanced visualization tools help you identify trends and make data-driven decisions. Compared to other tools, FineReport stands out for its ability to handle large-scale deployments, making it a top choice for enterprises.
FineReport offers flexible pricing plans tailored to different business needs. While specific pricing details are available upon request, the software provides excellent value for money with its extensive features and scalability.
Note: FineReport has received a high user satisfaction rating of 4.3, reflecting its effectiveness in KPI tracking and performance monitoring.
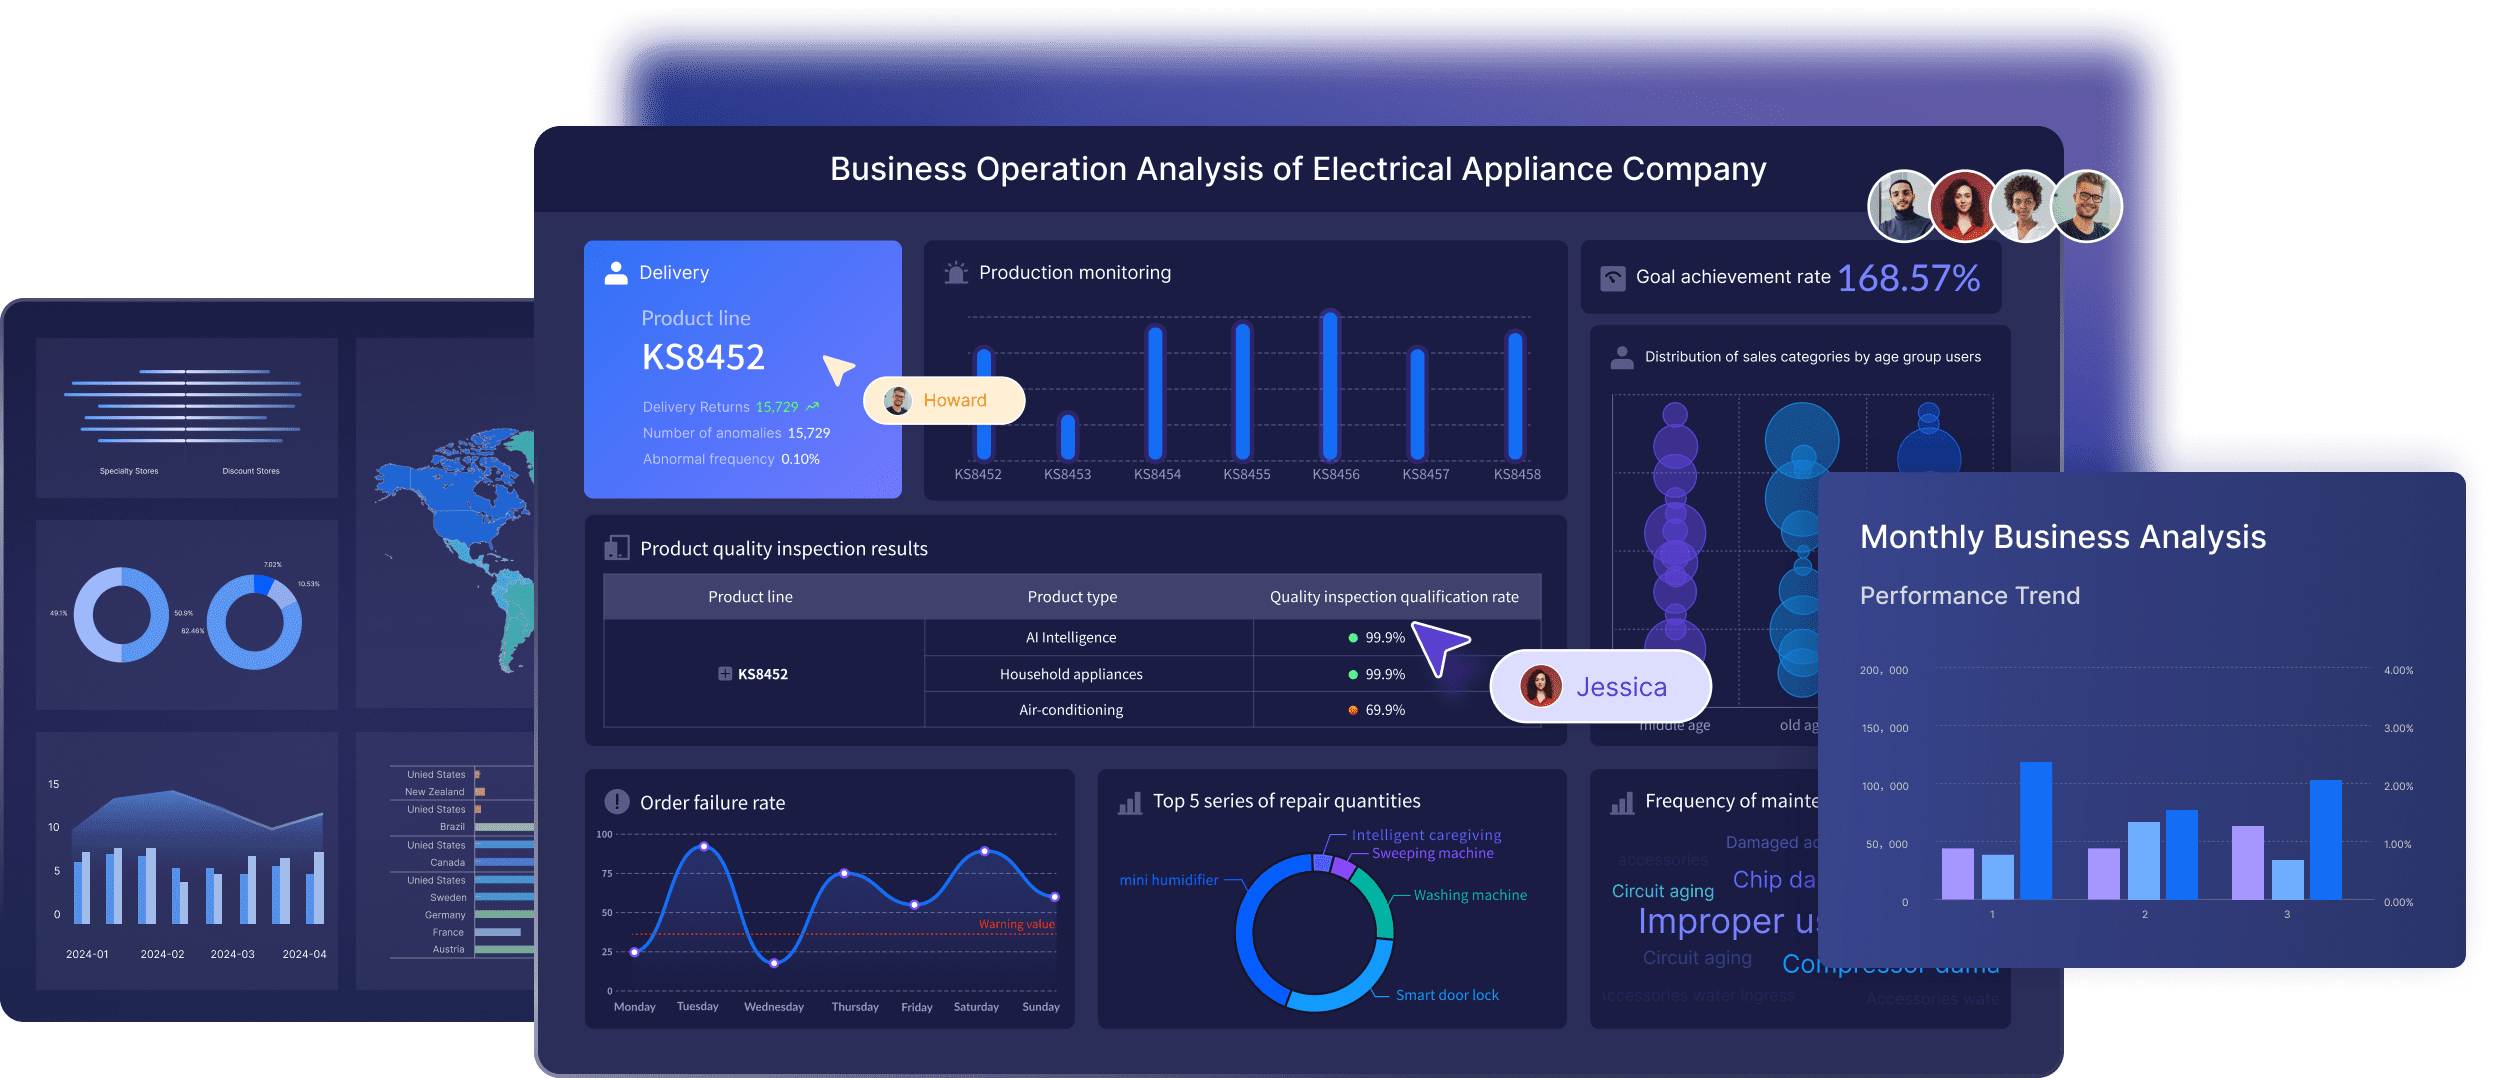
FineBI is a self-service BI tool designed to empower business users with advanced analytics capabilities. Its real-time data visualization enables you to monitor KPIs through dynamic charts and graphs. The software supports comprehensive analysis, allowing you to dive deep into sales data and uncover trends. FineBI also integrates seamlessly with existing systems, ensuring a smooth workflow. Predictive insights further enhance its utility by helping you forecast performance and identify growth opportunities.
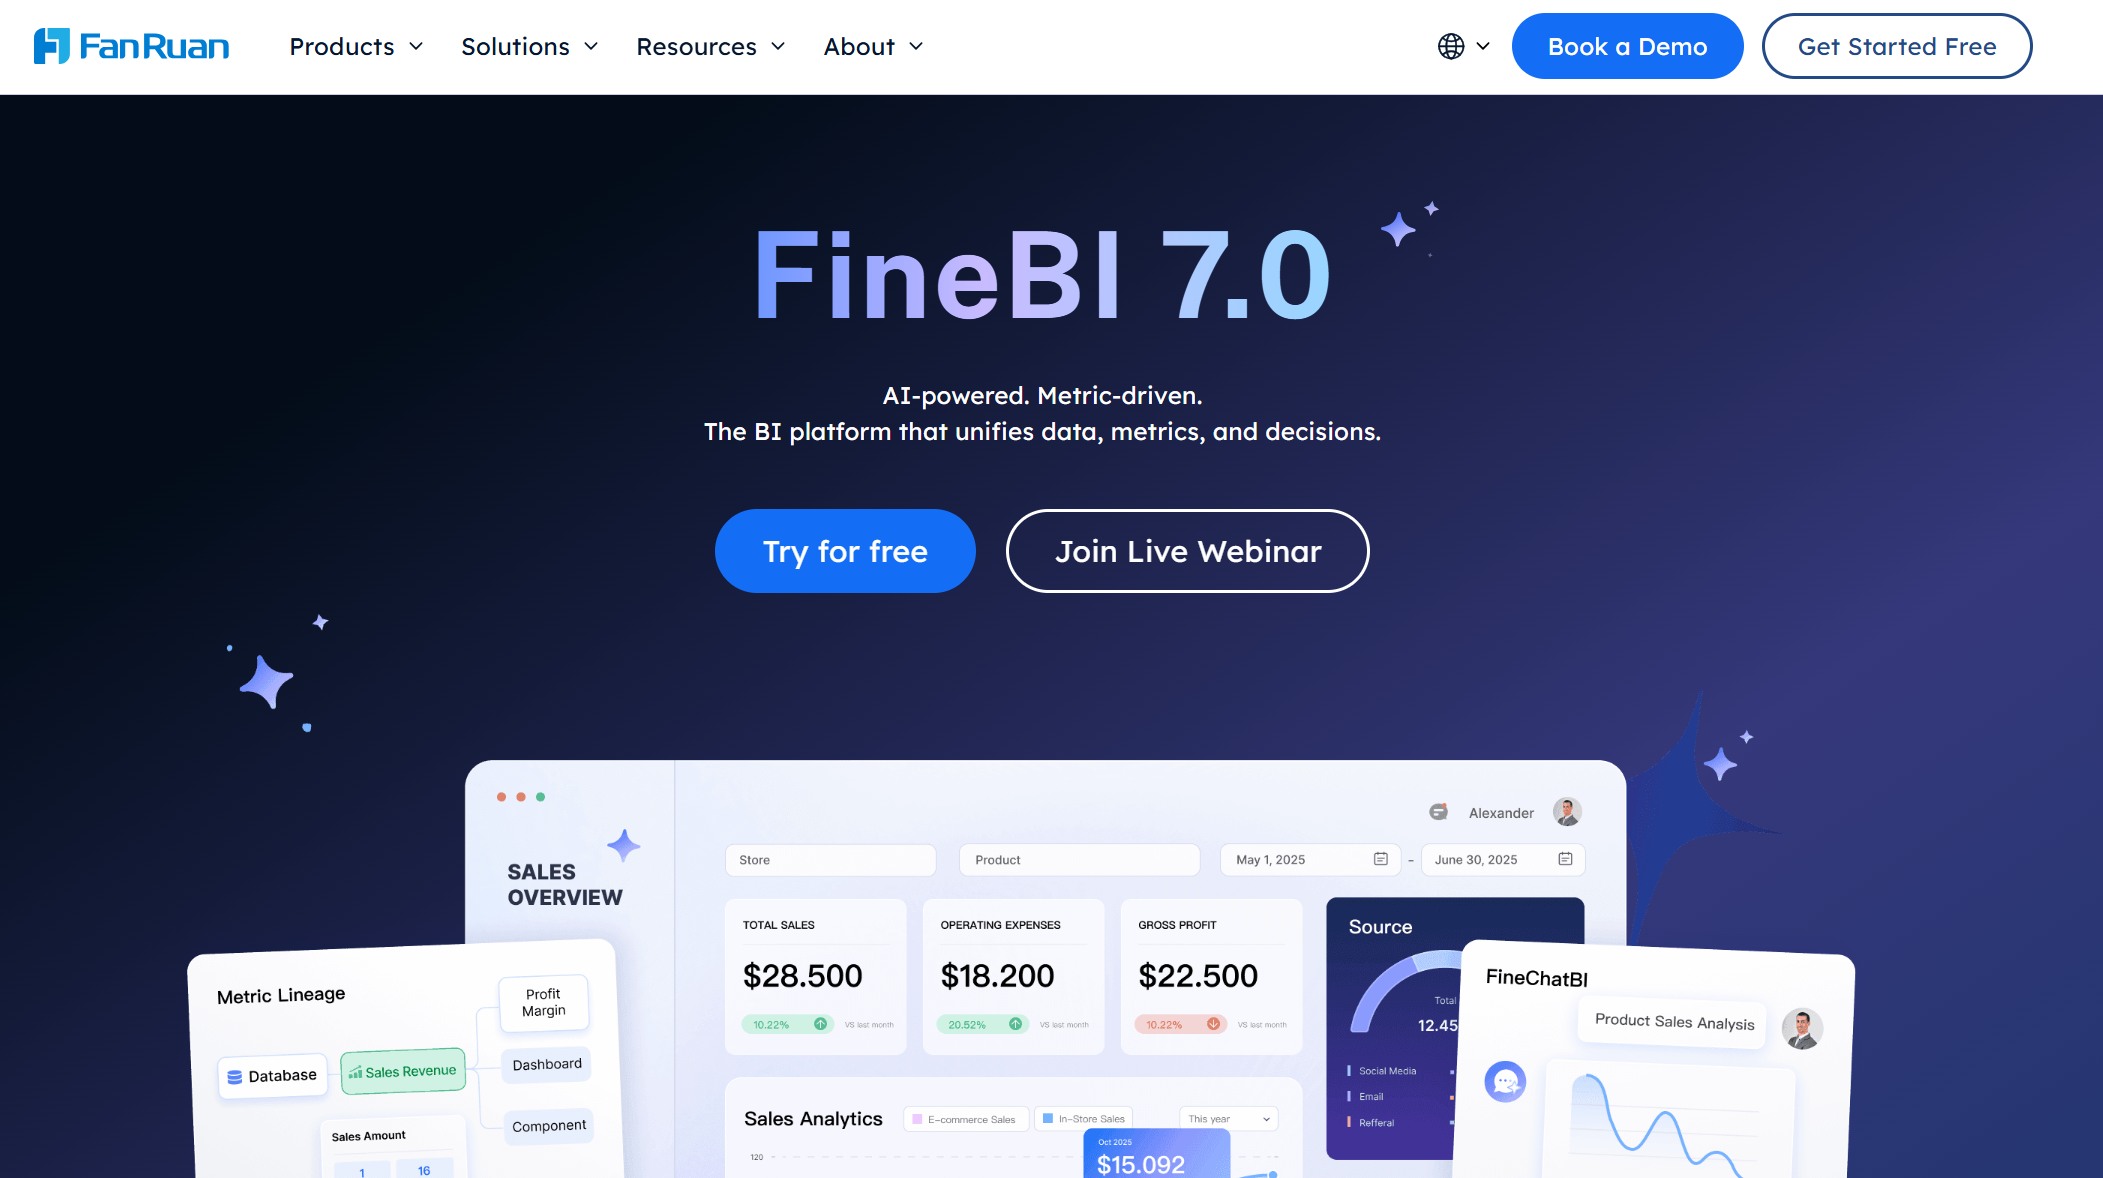
Website: https://www.fanruan.com/en/finebi
| Feature | Description |
|---|---|
| Real-Time Data Visualization | Enables monitoring of sales metrics and performance indicators through dynamic charts and graphs. |
| Comprehensive Analysis | Allows deep dives into sales data to identify trends, opportunities, and areas for improvement. |
| Seamless Integration | Facilitates easy integration with existing systems for a more efficient workflow. |
| Predictive Insights | Utilizes advanced analytics to forecast sales and pinpoint potential growth areas. |
FineBI excels in tracking KPIs across various departments, from sales to operations. Its drag-and-drop interface simplifies data analysis, enabling you to create dashboards without IT support. The software’s role-based access control ensures that team members view only relevant data, enhancing focus and productivity. FineBI’s predictive analytics capabilities set it apart, allowing you to anticipate trends and adjust strategies proactively.
FineBI offers competitive pricing with plans that cater to businesses of all sizes. Its professional and enterprise plans include advanced features like real-time dashboards and role-based access control, ensuring you get the best value for your investment.
Tip: FineBI’s combination of user-friendly design and powerful analytics makes it one of the best KPI software options for businesses aiming to streamline their performance tracking.
Tableau is renowned for its advanced data visualization capabilities. It enables you to create detailed visualizations without requiring technical expertise. The software offers AI-powered insights, helping you uncover trends in performance data. Tableau’s interactive dashboards allow for dynamic filtering and drill-down analysis. Predictive modeling and embedded analytics further enhance its utility, making it a versatile tool for KPI tracking.

Website: https://www.tableau.com/
| Feature | Description |
|---|---|
| Advanced Data Visualization | Enables users to create detailed visualizations without needing advanced technical skills. |
| AI-Powered Insights | Quickly uncovers trends in performance data through forecasting and AI insights. |
| Interactive Dashboards | Allows for dynamic dashboards with advanced filters and drill-down capabilities. |
| Predictive Modeling | Helps forecast performance and identify future trends for better planning. |
| Embedded Analytics | Facilitates incorporation of KPI dashboards into websites and applications. |
Tableau supports teams of all sizes in exploring trends and presenting data clearly. Its customizable visualizations allow you to tailor dashboards to specific needs, enhancing user experience. The software’s predictive modeling capabilities help you plan for the future by identifying potential challenges and opportunities.
Tableau’s pricing starts at $70 per user per month for its Creator plan, which includes advanced analytics and dashboard creation tools. While it offers powerful features, its higher cost may make it less accessible for smaller businesses compared to FineBI and FineReport.
Note: Tableau remains a strong contender for businesses seeking advanced data visualization, but its complexity and cost may not suit all organizations.
Microsoft Power BI stands out as a comprehensive tool for tracking KPIs and visualizing data. Its integration with Microsoft Dynamics 365 ensures seamless data accuracy across business areas. The platform offers interactive dashboards that provide at-a-glance insights and allow you to explore source reports for deeper analysis. Additionally, Power BI supports a variety of visual displays, including KPIs, to help you monitor progress toward your goals.

Website: https://www.microsoft.com/en-us/power-platform/products/power-bi
| Feature/Capability | Description |
|---|---|
| Data Visualization | Power BI offers various visual displays, including KPIs, to indicate progress toward goals. |
| Integration with Microsoft Tools | It connects seamlessly with Microsoft Dynamics 365, ensuring data accuracy across business areas. |
| Interactive Dashboards | Dashboards provide at-a-glance insights and allow users to explore source reports for deeper analysis. |
Power BI simplifies KPI tracking by consolidating data from multiple sources into a single platform. Its interactive dashboards enable you to monitor performance metrics in real-time, ensuring you can make informed decisions quickly. The tool’s integration with other Microsoft products enhances its utility, especially for businesses already using the Microsoft ecosystem. However, compared to FineBI and FineReport, Power BI may require more technical expertise to fully utilize its features. FineBI’s drag-and-drop interface and FineReport’s pixel-perfect reporting capabilities offer a more user-friendly experience, especially for non-technical users.

Power BI offers flexible pricing plans, starting at $9.99 per user per month for the Pro plan. The Premium plan, designed for larger organizations, costs $20 per user per month or $4,995 per capacity per month. While Power BI provides robust features, FineBI and FineReport deliver comparable functionality with a more intuitive interface and better scalability for businesses of all sizes.
Klipfolio excels in providing custom KPI dashboards for real-time data visualization. Its metric management feature, with a scorecard view, helps you track performance effectively. The platform also offers advanced customization options using HTML, CSS, and JavaScript, making it highly adaptable to specific business needs. Automated reporting capabilities further enhance its utility by enabling seamless sharing of insights.

Website: https://www.klipfolio.com/
| Platform | Average Rating | Number of Reviews |
|---|---|---|
| G2 | 4.5 | 253 |
| Capterra | 4.1 | 193 |
Klipfolio’s real-time dashboards allow you to monitor performance metrics continuously, ensuring you stay updated on critical KPIs. Its customization options make it ideal for businesses with unique reporting needs. However, Klipfolio’s reliance on coding for advanced customization may pose challenges for non-technical users. In contrast, FineBI and FineReport offer similar customization capabilities without requiring coding expertise. FineBI’s self-service analytics and FineReport’s automated reporting features provide a more accessible solution for businesses aiming to streamline KPI tracking.
Klipfolio’s pricing starts at $49 per month for the Plus plan, which includes 5 users and 10 dashboards. The Pro plan costs $99 per month, offering additional features like unlimited dashboards and advanced integrations. While Klipfolio provides value for its price, FineBI and FineReport offer more comprehensive features at competitive rates, making them a better choice for businesses seeking scalability and ease of use.
Databox simplifies KPI tracking with its pre-built templates and intuitive interface. The platform supports over 70 integrations, allowing you to connect data from various sources effortlessly. Its mobile-first design ensures you can access dashboards and monitor performance metrics on the go. Databox also offers goal-setting features, enabling you to align team objectives with organizational goals effectively.
Website: https://databox.com/
Databox’s mobile-friendly dashboards make it a convenient option for businesses that require real-time access to performance data. Its goal-setting capabilities help you track progress and ensure alignment across teams. However, Databox’s limited customization options may not meet the needs of businesses with complex reporting requirements. FineBI and FineReport address this gap by offering highly customizable dashboards and advanced analytics features. FineReport’s ability to integrate over 100 data sources and FineBI’s predictive analytics capabilities provide a more robust solution for KPI tracking.

Databox offers a free plan with basic features, making it an attractive option for small businesses. Paid plans start at $72 per month, providing access to advanced features like custom metrics and integrations. While Databox is cost-effective, FineBI and FineReport deliver greater value with their enterprise-grade features and scalability, making them ideal for businesses of all sizes.
Geckoboard simplifies KPI tracking by offering real-time dashboards that display your most critical metrics in one place. Its drag-and-drop interface allows you to create custom dashboards tailored to your business needs. You can integrate data from over 80 sources, including Google Analytics, Salesforce, and Excel, ensuring seamless data consolidation. Geckoboard also provides pre-built templates, making it easy to set up dashboards quickly. Its mobile-friendly design ensures you can monitor performance metrics on the go.
Website: https://www.geckoboard.com/
Geckoboard excels in providing a clear and concise view of your KPIs. Its real-time dashboards allow you to track performance metrics continuously, ensuring you stay updated on your business's progress. The platform's simplicity makes it ideal for teams that need quick access to data without technical expertise. However, Geckoboard's limited customization options may not meet the needs of businesses with complex reporting requirements. In contrast, FineBI and FineReport offer more advanced customization capabilities. FineBI’s drag-and-drop interface and predictive analytics provide deeper insights, while FineReport’s pixel-perfect reporting ensures professional-grade KPI tracking.
Geckoboard offers a straightforward pricing structure. Plans start at $49 per month for small teams, which includes unlimited dashboards and integrations. For larger organizations, the Pro plan costs $99 per month, offering additional features like advanced sharing options. While Geckoboard provides value for its price, FineBI and FineReport deliver more comprehensive features at competitive rates, making them better suited for businesses seeking scalability and advanced analytics.

Sisense is a powerful KPI tracking software known for its robust data discovery tools and secure data handling. It integrates seamlessly with various data sources, including cloud platforms and on-premises databases. Sisense’s standout feature is its ability to embed analytics into your applications, providing a unified experience for users. The platform also supports advanced visualizations, enabling you to create interactive dashboards that highlight key performance metrics.

Website: https://www.sisense.com/
Sisense empowers you to track KPIs effectively by consolidating data from multiple sources into a single platform. Its interactive dashboards allow you to explore metrics in detail, helping you identify trends and make informed decisions. The platform’s secure data handling ensures your sensitive information remains protected. However, Sisense has a steeper learning curve compared to FineBI and FineReport. FineBI’s intuitive interface simplifies data analysis, making it accessible even for non-technical users. FineReport’s automated reporting and real-time data updates further enhance its utility for KPI tracking.
Sisense offers custom pricing based on your business needs. While it provides enterprise-grade features, its cost may be higher than other options. FineBI and FineReport, on the other hand, offer flexible pricing plans that cater to businesses of all sizes, ensuring you get the best value for your investment.
Mooncamp focuses on goal-setting and performance tracking, making it a unique addition to the best KPI software list. Its OKR (Objectives and Key Results) framework helps you align team goals with organizational objectives. The platform offers intuitive dashboards that display progress toward goals in real-time. Mooncamp also includes features like weekly check-ins and feedback loops, fostering a culture of accountability and continuous improvement.
Website: https://mooncamp.com/
Mooncamp’s emphasis on goal alignment makes it ideal for organizations looking to improve team collaboration. Its dashboards provide a clear view of progress, ensuring everyone stays on track. However, Mooncamp’s limited data integration options may restrict its utility for businesses with complex data ecosystems. FineBI and FineReport address this gap by offering robust integration capabilities. FineBI connects to a wide range of data sources, enabling comprehensive KPI tracking. FineReport’s ability to handle large-scale deployments ensures it meets the needs of growing enterprises.
Mooncamp offers a free plan for small teams, which includes basic features like goal tracking and dashboards. Paid plans start at $6 per user per month, providing access to advanced features like custom OKRs and analytics. While Mooncamp is cost-effective, FineBI and FineReport offer more advanced features and scalability, making them a better choice for businesses aiming to streamline their KPI tracking processes.
Scoro is a comprehensive business management tool that combines project management, billing, and KPI tracking into one platform. Its standout features include customizable dashboards, time tracking tools, and financial management capabilities. These features allow you to monitor your team's productivity, track billable hours, and manage budgets effectively. Scoro’s all-in-one approach ensures that you can oversee multiple aspects of your business without switching between different tools.
Website: https://www.scoro.com/
One of Scoro’s key strengths lies in its ability to centralize data. The platform integrates seamlessly with popular tools like QuickBooks, Xero, and Zapier, enabling you to consolidate data from various sources. This integration ensures that your dashboards display accurate and up-to-date metrics. However, Scoro’s customization options for dashboards are somewhat limited compared to FineBI and FineReport. FineBI offers drag-and-drop functionality, making it easier for non-technical users to create tailored dashboards. FineReport, on the other hand, excels in pixel-perfect reporting, ensuring professional-grade KPI tracking.
Scoro simplifies KPI tracking by providing a centralized platform for monitoring performance metrics. You can track KPIs related to project timelines, team productivity, and financial health. The platform’s real-time dashboards allow you to identify bottlenecks and make data-driven decisions quickly. For example, you can monitor project progress and adjust resources to meet deadlines.
While Scoro offers robust tracking capabilities, it may not match the depth of analysis provided by FineBI and FineReport. FineBI’s advanced analytics enable you to drill down into data and uncover trends, helping you make proactive decisions. FineReport’s automated reporting features save time by delivering scheduled KPI reports directly to stakeholders. These tools provide a more comprehensive solution for businesses looking to optimize their performance tracking.
Scoro offers tiered pricing plans to cater to businesses of different sizes. The Essential plan starts at $26 per user per month, providing access to basic features like task management and time tracking. The Standard plan, priced at $37 per user per month, includes advanced features like financial reporting and KPI dashboards. For larger organizations, the Pro plan costs $49 per user per month and offers enhanced customization and integration options.
While Scoro’s pricing is competitive, FineBI and FineReport deliver greater value for money. FineBI’s self-service analytics and FineReport’s enterprise-grade reporting capabilities ensure that you get advanced features without overspending. These tools also offer flexible pricing plans, making them suitable for businesses of all sizes.
Tip: If you need a tool that combines project management with KPI tracking, Scoro is a solid choice. However, for more advanced analytics and reporting, consider FineBI and FineReport.

When choosing KPI tracking software, understanding the key features of each tool helps you make an informed decision. Below is a comparison of the standout features of the top 10 software:
| Software | Key Features |
|---|---|
| FineReport | Customizable dashboards, real-time data updates, pixel-perfect reporting, integration with 100+ data sources. |
| FineBI | Self-service analytics, predictive insights, drag-and-drop interface, role-based access control. |
| Tableau | Advanced data visualization, AI-powered insights, interactive dashboards, predictive modeling. |
| Power BI | Integration with Microsoft tools, interactive dashboards, KPI visualizations, real-time tracking. |
| Klipfolio | Custom KPI dashboards, metric management, advanced customization with coding options. |
| Databox | Pre-built templates, mobile-first design, goal-setting features, 70+ integrations. |
| Geckoboard | Real-time dashboards, drag-and-drop interface, pre-built templates, mobile-friendly design. |
| Sisense | Secure data handling, embedded analytics, interactive dashboards, robust data discovery tools. |
| Mooncamp | OKR framework, goal alignment, weekly check-ins, feedback loops. |
| Scoro | All-in-one platform, customizable dashboards, time tracking, financial management capabilities. |
FineReport and FineBI stand out for their ability to integrate with over 100 data sources and provide enterprise-grade features. Unlike Tableau or Klipfolio, which may require technical expertise for advanced customization, FineBI’s drag-and-drop interface ensures ease of use for non-technical users.

Tip: If you need a balance of advanced analytics and user-friendly design, FineBI and FineReport are excellent choices.
Pricing plays a crucial role in selecting the right software. Here’s a breakdown of the pricing tiers for the top 10 tools:
| Software | Free Plan Available | Starting Price (Per User/Month) | Enterprise Pricing Available? |
|---|---|---|---|
| FineReport | No | Custom pricing | Yes |
| FineBI | No | Custom pricing | Yes |
| Tableau | No | $70 | Yes |
| Power BI | Yes | $9.99 | Yes |
| Klipfolio | No | $49 | Yes |
| Databox | Yes | $72 | Yes |
| Geckoboard | No | $49 | Yes |
| Sisense | No | Custom pricing | Yes |
| Mooncamp | Yes | $6 | Yes |
| Scoro | No | $26 | Yes |
FineReport and FineBI offer flexible pricing tailored to your business needs. While tools like Tableau and Sisense provide enterprise-grade features, their higher costs may not suit smaller businesses. FineBI and FineReport deliver comparable functionality at competitive rates, making them ideal for businesses of all sizes.
Note: FineReport’s pixel-perfect reporting and FineBI’s predictive analytics provide exceptional value for money, especially for enterprises seeking scalability.
Each software excels in specific scenarios. Here’s a quick guide to help you identify the best fit for your needs:
FineReport and FineBI cater to a wide range of use cases, from detailed financial reporting to predictive sales analytics. Their versatility and scalability make them top choices for businesses aiming to optimize performance tracking.
Defining clear objectives is the foundation of successful KPI tracking software implementation. Start by identifying what you aim to achieve. Whether it’s boosting revenue, improving customer satisfaction, or enhancing operational efficiency, your objectives should guide the selection of key performance indicators. Not every metric needs to be tracked. Focus on those that align with your business goals.
Use the S.M.A.R.T framework to ensure your KPIs are Specific, Measurable, Attainable, Relevant, and Time-Bound. For example, instead of tracking vague metrics like "increase sales," define a KPI such as "achieve a 15% increase in sales revenue within six months." Additionally, consider the 6 A’s: aligned, attainable, acute, accurate, actionable, and alive. These principles ensure your KPIs remain relevant and adaptable to changing business needs.
FineBI and FineReport excel in helping you define and monitor KPIs effectively. FineBI’s self-service analytics allow you to explore data independently, ensuring your KPIs are actionable and accurate. FineReport’s pixel-perfect reporting ensures your dashboards present metrics in a clear and professional format, making it easier to track progress toward your objectives.
Tip: Avoid overwhelming your team with too many KPIs. Focus on a few critical metrics that directly impact your business performance.
Training your team is essential for maximizing the benefits of KPI tracking software. Organize workshops and hands-on sessions to familiarize employees with the software’s features. Focus on helping them understand how to navigate dashboards, interpret metrics, and use the data for decision-making. Role-specific training ensures each team member knows how to leverage the software for their responsibilities.
FineBI and FineReport simplify the training process with their user-friendly interfaces. FineBI’s drag-and-drop functionality makes it easy for non-technical users to create dashboards and analyze data. FineReport’s spreadsheet-like design reduces the learning curve for report developers. Compared to tools like Tableau, which often require advanced technical skills, FineBI and FineReport offer a more accessible solution.
Vendor support also plays a crucial role during training. Both FineBI and FineReport provide comprehensive customer support, ensuring your team can resolve technical issues quickly. This support minimizes downtime and helps employees gain confidence in using the software.
Note: Regular training updates keep your team informed about new features and best practices, ensuring they continue to use the software effectively.
KPI tracking is not a one-time activity. Regularly reviewing and updating your KPIs ensures they remain aligned with your business objectives. Schedule periodic reviews to assess whether your current metrics still reflect your goals. For instance, as your business grows, you may need to shift focus from customer acquisition to retention.
FineBI and FineReport make it easy to update and monitor KPIs. FineBI’s real-time data visualization allows you to track changes in performance metrics instantly. FineReport’s automated scheduling feature ensures updated KPI reports are delivered to stakeholders on time. These capabilities help you adapt quickly to market changes and maintain a competitive edge.
Tip: Use feedback from team members and stakeholders to refine your KPIs. Their insights can help you identify gaps and improve the relevance of your metrics.
Automation and integrations are essential for maximizing the efficiency of your kpi tracking software. By automating repetitive tasks, you save time and reduce the risk of human error. Integrations ensure that your software connects seamlessly with other tools, creating a unified system for managing data and tracking performance.
For example, FineReport excels in automation with its task scheduling feature. You can set it to generate and distribute reports automatically, ensuring stakeholders receive updated dashboards without manual intervention. This feature is especially useful for tracking metrics like sales growth or operational efficiency. FineBI complements this by offering real-time data synchronization. It integrates with over 100 data sources, including relational databases and big data platforms, ensuring your dashboards always display the latest information.
Other tools, like Tableau, also provide automation and integration capabilities. However, Tableau often requires advanced technical skills to set up these features. In contrast, FineBI and FineReport simplify the process with user-friendly interfaces. FineBI’s drag-and-drop functionality allows you to create automated workflows without coding, making it accessible even for non-technical users.
Integrations also play a critical role in enhancing the functionality of your kpi tracking software. FineReport supports API connections, enabling you to link it with CRM, ERP, and other business systems. This capability ensures that all your data flows into a single platform, providing a comprehensive view of your performance metrics. FineBI’s role-based access control further enhances integration by allowing team members to access only the data relevant to their roles, improving focus and productivity.
Tip: Choose software that offers robust automation and integration features. FineBI and FineReport stand out for their ease of use and extensive integration options, making them ideal for businesses of all sizes.
Implementing kpi tracking software is just the beginning. To get the most out of it, you need to monitor its usage and optimize it regularly. This ensures that the software continues to meet your business needs as they evolve.
Start by analyzing how your team interacts with the dashboards. Identify which metrics they use most frequently and which ones they overlook. FineBI makes this process easier with its data visualization tools. You can track user activity and identify areas where the software adds the most value. FineReport’s pixel-perfect reporting ensures that your dashboards present data in a clear and professional format, making it easier to spot trends and areas for improvement.
Optimization also involves updating your kpi metrics to align with changing business goals. For instance, as your company grows, you may need to shift focus from customer acquisition to retention. FineBI’s predictive analytics help you anticipate these changes and adjust your strategies proactively. FineReport’s automated scheduling feature ensures that updated reports reach stakeholders on time, keeping everyone aligned with the latest objectives.
Other tools, like Power BI, offer similar monitoring capabilities. However, Power BI often requires more technical expertise to customize and optimize. FineBI and FineReport provide a more intuitive experience, allowing you to make adjustments quickly and efficiently.
Note: Regularly reviewing and optimizing your software ensures it remains a valuable tool for tracking performance. FineBI and FineReport offer the flexibility and scalability needed to adapt to your business’s evolving needs.
KPI tracking software plays a vital role in helping you achieve your business goals. It provides real-time insights, streamlines decision-making, and ensures your team stays aligned with objectives. Choosing the right tool depends on your specific needs. FineBI and FineReport stand out with their user-friendly interfaces, robust integration capabilities, and advanced analytics. These tools simplify KPI tracking, making them ideal for businesses of all sizes.
Explore the options listed in this blog and take the next step toward optimizing your performance. The right software can transform how you monitor and achieve success.
Click the banner below to try FineReport for free and empower your enterprise to transform data into productivity!
How to Fix Data Analysis Excel Not Showing in 2025
What is SaaS Analytics and Why Businesses Need It
Top Beginner-Friendly Data Analysis Projects to Build Your Portfolio
Data Analysis vs Data Analytics: What’s the Real Difference?

The Author
Lewis
Senior Data Analyst at FanRuan
Related Articles
Data Analyst Dashboard: A Scenario-Based Guide to KPI Views That Drive Better Business Decisions
Learn how data analyst dashboards turn raw data into actionable KPI views for operational, analytical, and strategic decisions. Drive better business outcomes.
Lewis Chou
May 03, 2026

Self-Service Analytics Defined and Why You Need It
Self-service analytics lets you analyze data without IT help, empowering faster, data-driven decisions and boosting agility for your business.
Lewis
Jan 04, 2026
Best Self-Service Tools for Analytics You Should Know
See which self-service tools for analytics let business users access data, build dashboards, and make decisions faster—no IT help needed.
Lewis
Dec 29, 2025


