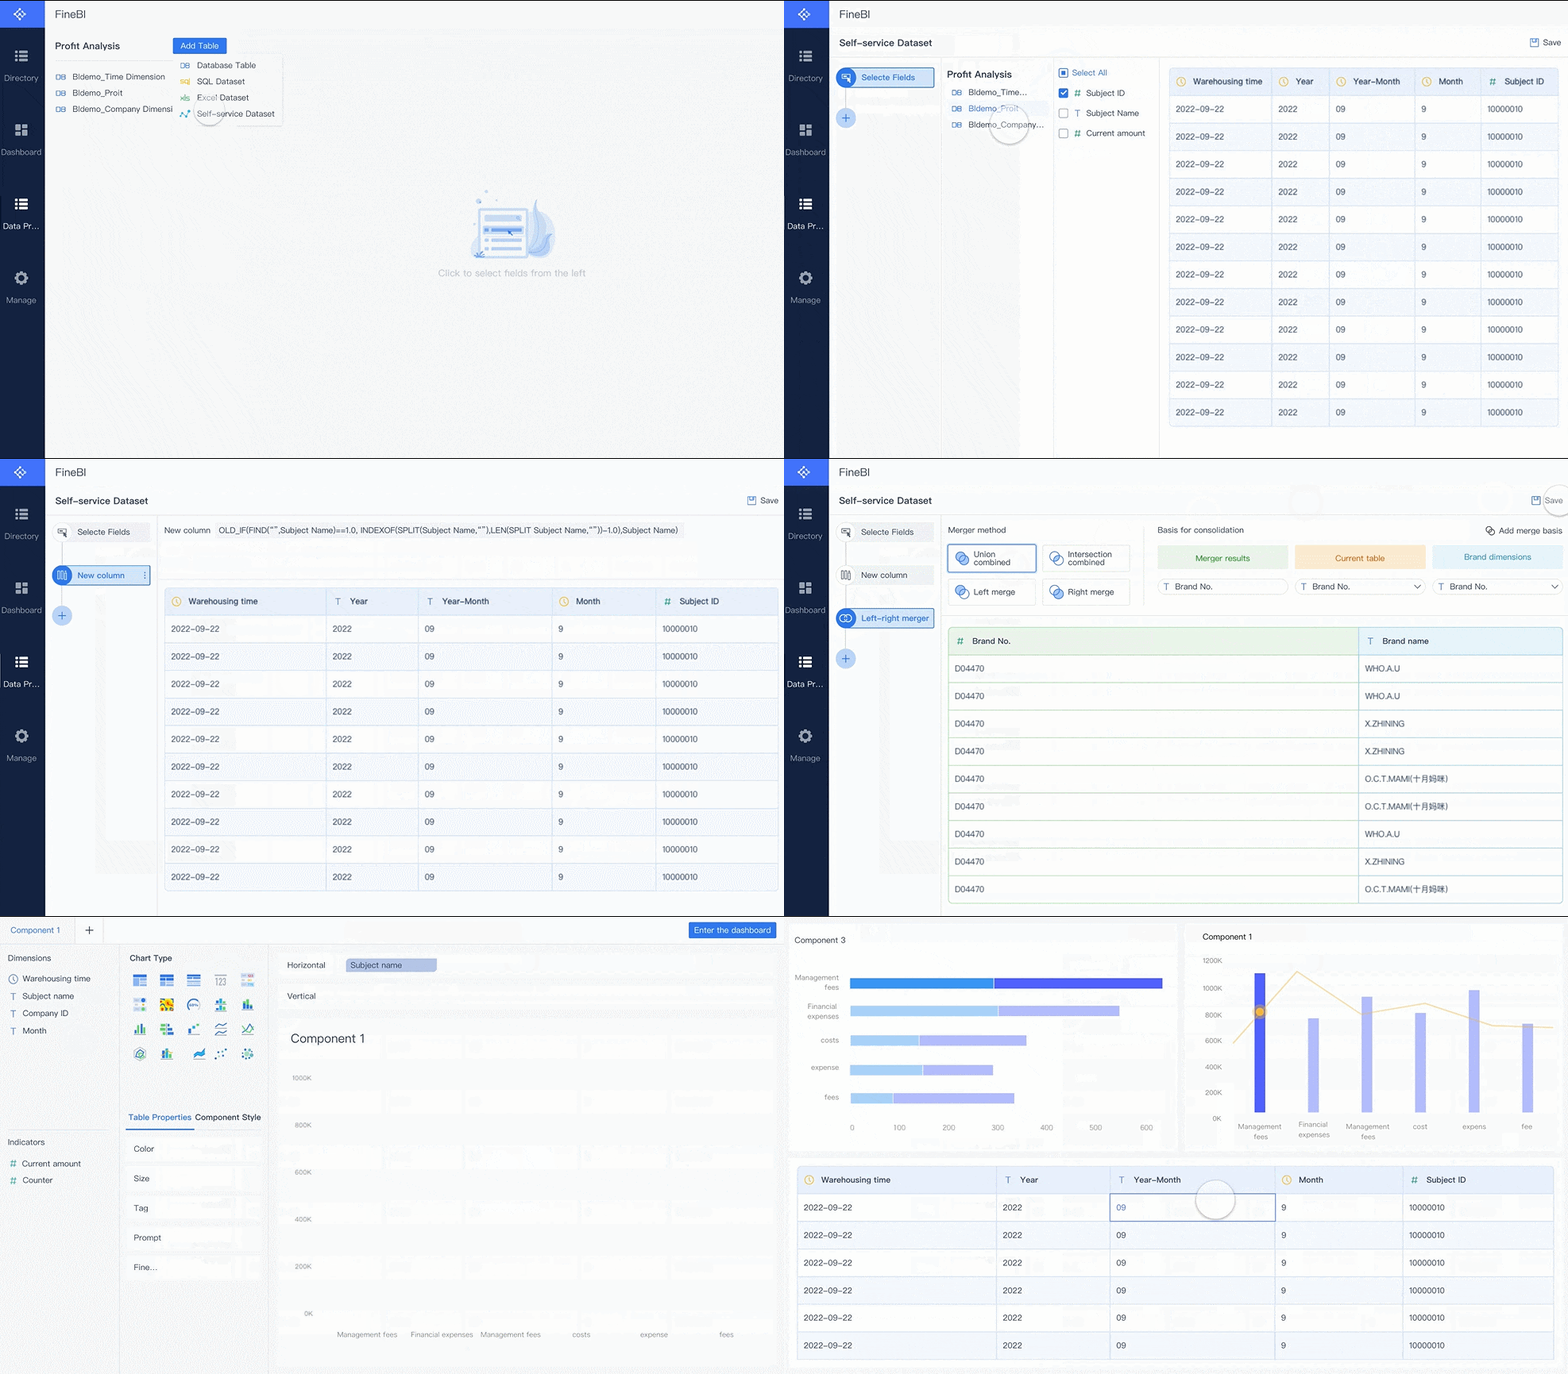
Categorical data analysis enables you to uncover patterns and relationships in data that involve distinct categories. Methods like contingency tables provide a structured way to summarize and compare categorical variables, ensuring clarity in your findings. Tools such as correspondence analysis simplify complex interactions into visual maps, offering intuitive insights. These maps make critical relationships easier to interpret and transform into actionable strategies. By selecting the right techniques, you can enhance clarity, ensure reliability, and make informed decisions that drive impactful results. FineBI stands out from the fierce competitions, encompassing everything from data preparation and data processing to visual analysis of data and data sharing. The demo will show you how easy but powerful FineBI is. One click and you can book it for free here.

Categorical data represents information grouped into distinct categories or labels. These categories help you classify data without involving numerical values. For example, survey responses like "Yes," "No," or "Maybe" fall under categorical data. Unlike numerical data, categorical data focuses on qualities or characteristics rather than quantities.
To analyze categorical data effectively, you can use tools like frequency tables and bar charts. Frequency tables summarize occurrences in each category, while bar charts visually display these frequencies. For instance, a bar chart showing the distribution of hair colors in a population can help you quickly identify the most common category.
Categorical data can be divided into two main types: nominal and ordinal. Nominal data includes categories with no inherent order. Examples include car brands or hair colors. In contrast, ordinal data involves categories with a meaningful order or ranking. Customer satisfaction levels, such as "Very Satisfied," "Satisfied," and "Dissatisfied," are examples of ordinal data.
However, ordinal data often presents challenges. Ranking items introduces potential inaccuracies, as seen when comparing consumer preferences for car brands. While nominal data is straightforward to collect, ordinal data requires careful handling to minimize errors.
| Type of Data | Statistical Tests |
|---|---|
| Nominal | McNemar test, Cochran Q’s test, Fisher’s Exact test, Chi-Square test |
| Ordinal | Wilcoxon signed-rank test, Friedman 2-way ANOVA, Wilcoxon rank-sum test, Kruskal-Wallis 1-way test |
Categorical data appears in various real-world contexts. Nominal data examples include car brands, hair colors, or types of cuisine. These categories lack any specific order. On the other hand, ordinal data examples include Likert scales used in surveys or customer satisfaction ratings. These categories follow a ranked order, making them ideal for understanding preferences or trends.
For instance, in clinical trials, researchers often use chi-square tests to analyze the association between treatment groups and outcomes. Similarly, customer satisfaction surveys rely on ordinal data to rank service quality. These applications highlight the versatility of categorical data in decision-making.
| Type of Categorical Data | Examples | Characteristics |
|---|---|---|
| Nominal Data | Car Brands, Hair Color | No Order, Distinct |
| Ordinal Data | Likert Scale, Satisfaction Levels | Ranked, Relative |
Descriptive statistics help you summarize and understand categorical data effectively. These methods provide a clear overview of your data, making it easier to identify patterns and trends. You can use the following measures to analyze categorical data:
For instance, if you analyze customer feedback on a product, frequency distribution can show how many customers rated the product as "Excellent," "Good," or "Poor." These insights allow you to make data-driven decisions and improve your strategies.
Inferential statistics enable you to draw conclusions about relationships between categorical variables. Two powerful methods for this are the chi-square test and Fisher’s exact test.
The chi-square test is widely used to assess associations between categorical variables. It works well in preliminary research stages, helping you identify patterns in your data. However, it becomes less reliable when expected frequencies are low. In such cases, Fisher’s exact test is a better alternative. This test calculates the exact probability of observing your data under the null hypothesis, ensuring accuracy even with small sample sizes.
Fisher’s exact test is particularly effective in research areas where large samples are not feasible. For example, in clinical trials with limited participants, this test provides reliable p-values, enhancing the validity of your conclusions. It also handles nonrandom associations between variables, making it a critical tool for categorical data analysis.
| Method | Use Case | Advantages |
|---|---|---|
| Chi-square tests | Assessing associations between variables | Identifies patterns in data |
| Fisher’s exact test | Small sample sizes | Accurate alternative for limited sample sizes |
By using these methods, you can ensure statistically sound conclusions, even in challenging scenarios.
When you need to explore complex relationships in categorical data, advanced techniques like logistic regression and decision trees come into play. Logistic regression helps you predict the probability of an outcome based on one or more predictor variables. For example, you can use it to determine the likelihood of a customer purchasing a product based on their demographic information.
Decision trees, on the other hand, provide a visual representation of decision-making processes. They split data into branches based on specific criteria, making it easier to interpret results. For instance, a decision tree can help you identify factors influencing customer satisfaction, such as price, quality, or service.
To evaluate the performance of these methods, you can use benchmarks like accuracy, area under the curve (AUC), and Brier score. Studies show that random forests, an extension of decision trees, outperform logistic regression in accuracy in about 69% of datasets. This highlights the importance of choosing the right method based on your data and objectives.
By leveraging these advanced techniques, you can uncover deeper insights and make more informed decisions in your categorical data analysis.
Python offers powerful libraries that simplify the analysis of categorical data. These libraries provide tools for data manipulation, visualization, and machine learning, making them essential for any data analyst.
pandas: This library is your go-to tool for handling categorical data. It allows you to create, manipulate, and analyze dataframes with ease. You can use its Categorical data type to optimize memory usage and improve performance. For example, you can convert a column of text labels into a categorical variable, which speeds up operations like filtering and grouping.
import pandas as pd
data = pd.DataFrame({'Category': ['A', 'B', 'A', 'C']})
data['Category'] = data['Category'].astype('category')
print(data['Category'])
OneHotEncoder and LabelEncoder to transform categorical variables into numerical formats. These transformations are essential for algorithms that require numerical input.By combining these libraries, you can handle, visualize, and model categorical data effectively, ensuring accurate and actionable insights.
R remains a favorite among statisticians for its robust packages tailored to categorical data analysis. These packages simplify tasks like data manipulation, visualization, and statistical testing.
group_by() and summarize() allow you to calculate frequencies and proportions for each category.R packages offer a comprehensive suite of tools for analyzing categorical data, making it easier to uncover meaningful insights.
FineBI stands out as a self-service business intelligence tool designed to simplify categorical data analysis. It empowers you to explore and visualize data without requiring advanced technical skills.

FineBI simplifies the process of analyzing categorical data, making it accessible to business users and data analysts alike. Its user-friendly design and powerful features ensure that you can derive actionable insights efficiently.

Maintaining high data quality is essential for accurate analysis of categorical variables. You should ensure that your data is accurate, consistent, and complete. Verify that all data points are recorded correctly and that no critical variables contain missing values. Standardized labels can help maintain consistency in data entry, reducing errors caused by duplication or mislabeling.
Categories must be mutually exclusive to avoid confusion during analysis. For example, if you analyze customer feedback, ensure that each response fits into only one category. Irrelevant data should also be removed to improve the reliability of your results. Ordinal data, in particular, requires careful handling to minimize errors caused by inconsistent spacing between ranks.
Tip: High-quality categorical data ensures the reliability of statistical tests like chi-square, which depend on accuracy and completeness.
Missing data in categorical variables can distort your analysis. You can address this issue using evidence-based strategies. Multiple imputation fills in missing values multiple times using statistical models, providing a range of possible outcomes. Regression-based predictions use existing data to estimate missing values, while machine learning algorithms offer advanced methods for maintaining data integrity.
| Strategy | Description |
|---|---|
| Multiple Imputation | Fills in missing values multiple times based on statistical models, providing a range of possible values. |
| Regression-based Predictions | Uses regression techniques to predict and fill in missing data points. |
| Machine Learning Algorithms | Employs advanced algorithms to effectively estimate missing values while maintaining data integrity. |
Techniques like mean imputation or regression imputation can also help fill gaps before running statistical tests. For large datasets, unsupervised methods like K-Means clustering can exclude variables with excessive missing values, ensuring the dataset remains robust.
Interpreting results from categorical data analysis requires a clear focus on actionable insights. Start by identifying patterns and trends in your categorical variables. For example, frequency distributions can reveal the most common customer preferences, while chi-square tests can highlight significant associations between variables.
Visualizations play a key role in making your findings understandable. Use bar charts, pie charts, or Sankey diagrams to present your results effectively. These tools help you communicate complex relationships in a simple, visual format. Always ensure that your conclusions align with the data and avoid overgeneralizing results.
Note: Actionable insights from categorical data can guide strategic decisions, improving outcomes in areas like customer satisfaction or operational efficiency.
Effective methods and tools for categorical data analysis play a crucial role in uncovering meaningful insights. By adopting advanced techniques, you can enhance the depth and rigor of your analysis, leading to better decision-making and stronger research outcomes. These methods empower you to refine your approach and achieve actionable results. Tools like FineBI simplify this process by offering intuitive features for data integration, visualization, and collaboration. Its user-friendly design ensures that you can analyze data efficiently, regardless of your technical expertise. Start exploring these techniques today to elevate your analytical capabilities and drive impactful results.
Click the banner below to try FineBI for free and empower your enterprise to transform data into productivity!
Top 10 Best Data Analysis Tools & Softwares You Should Know
Essential Data Analysis Skills for Career Success
The Vital Role of Data Analytics Dashboard in Business Decision-Making

The Author
Lewis
Senior Data Analyst at FanRuan
Related Articles

Self-Service Analytics Defined and Why You Need It
Self-service analytics lets you analyze data without IT help, empowering faster, data-driven decisions and boosting agility for your business.
Lewis
Jan 04, 2026

Best Self-Service Tools for Analytics You Should Know
See which self-service tools for analytics let business users access data, build dashboards, and make decisions faster—no IT help needed.
Lewis
Dec 29, 2025

Understanding Predictive Analytics Services in 2026
Predictive analytics services use data and AI to forecast trends, helping businesses make informed decisions, reduce risks, and improve efficiency in 2026.
Lewis
Dec 30, 2025