Data analytics meaning comes down to using facts and figures to find patterns or answers that help you make better choices. Imagine you check your phone to see how many steps you walked today. You look at the numbers, notice trends, and maybe set a new goal based on that data. Many people use analytics daily without realizing it.
- Over a quarter (27.9%) of US internet users rely on mobile apps to track health or fitness.
You do not need to be an expert. With simple examples, you can see how data and analytics shape your daily life.
Data Analytics Meaning

Simple Definition
When you hear the phrase data analytics meaning, think of it as the process of looking at facts and numbers to find useful information that helps you make better decisions. You do not need to be a scientist or a math expert. In simple terms, data analytics meaning is about collecting, organizing, and studying data to spot patterns, answer questions, and guide your choices.
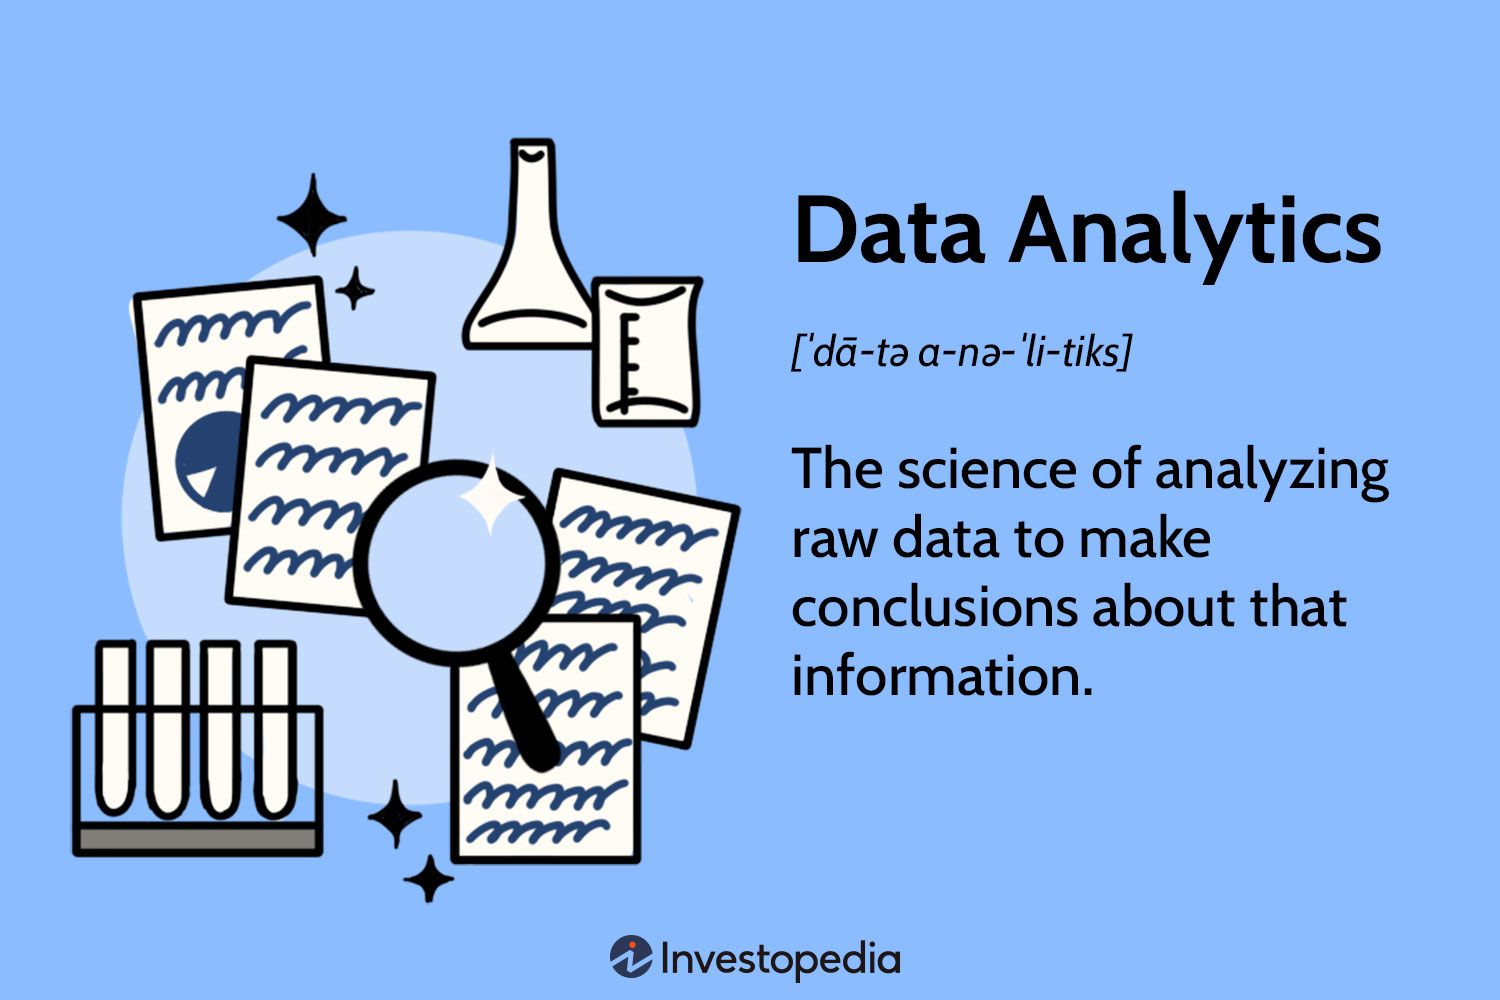
Data analytics meaning can be summed up as the science of examining raw data to discover valuable insights and draw conclusions that lead to smarter actions.
Many people believe data analytics is only for big companies or tech experts. That is not true. Today, you can use data analytics meaning in your daily life or at work, no matter your background. Modern tools make data analytics easier and more affordable than ever. You do not need a large team or expensive software. Even small businesses and individuals can benefit from data analytics meaning.
Here are some common misunderstandings about data analytics meaning:
- You might think data analytics is expensive, but costs have dropped, making it accessible to everyone.
- You may believe only experts can do data analytics, but self-service tools let you analyze data on your own.
- Some people think data analytics is boring or takes too much time. Modern software makes the process quick and simple.
- You do not need huge amounts of data. Good analysis can happen with small, quality data sets.
- Data analytics meaning is not just for online or large companies. Any business or person can use it to improve results.
Everyday Example
You use data analytics meaning every day, often without realizing it. Imagine you shop online for a pair of sports shoes. After your purchase, the website suggests matching socks or sports trousers. This is not a coincidence. The store uses data analytics to study what customers buy together. By analyzing past purchases, the system predicts what you might want next and recommends it to you.
Another example: You check your phone to see how many steps you walked this week. You notice you walk more on weekends. You set a new goal to walk even more next week. Here, you use data analytics meaning by looking at your step data, finding a pattern, and making a decision based on what you learned.
You also see data analytics meaning when you receive ads for products you just talked about or searched for. Companies use data analytics to track your interests and show you relevant ads. These examples show how data analytics meaning shapes your choices, both big and small.
Data analytics meaning is not just a business tool. It is part of your daily routine, helping you make sense of information and guiding your next move.
You do not need to handle huge amounts of data or use complex software. With the right approach, you can use data analytics meaning to improve your life, make smarter decisions, and reach your goals. Whether you are a student, a business owner, or just curious, understanding data analytics meaning gives you an advantage in today’s world.
Why Data Analytics Meaning Matters
Real-World Impact
Data analytics meaning goes far beyond numbers on a screen. You use data analytics every day, whether you realize it or not. When you track your spending, compare prices, or check your fitness progress, you rely on data analysis to make informed decisions. Businesses and organizations depend on analytics to understand customers, improve products, and stay competitive. The ability to turn raw data into meaningful insights helps you spot trends, solve problems, and create better outcomes.
Here is a table showing why data analytics matters for both individuals and organizations:
| Reason | Description |
|---|---|
| Gain greater insight into target markets | Access to customer data helps businesses understand preferences and behaviors, allowing for trend identification and product customization. |
| Enhance decision-making capabilities | Data analytics enables faster and better-informed decisions, reducing costs associated with ineffective strategies. |
| Create targeted strategies and marketing campaigns | Data informs marketing strategies, ensuring promotions reach the right audiences. |
| Improve operational inefficiencies and minimize risk | Insights from data help optimize products and services, increasing operational efficiency. |
| Identify new product and service opportunities | Data analytics helps identify gaps in the market, leading to the development of new offerings. |
You see the impact of data analytics meaning in many industries. Hospitals use analytics to analyze patient health data and identify risks early. Retailers optimize inventory by studying sales data, making sure shelves stay stocked with what customers want. Manufacturers analyze production data to reduce waste and improve efficiency. These examples show how data analysis leads to meaningful insights and smarter actions.
Decision-Making in Business
Data analytics meaning plays a key role in business decision-making. You can make informed decisions by studying data and uncovering patterns. Companies that use analytics outperform competitors because they adapt quickly and base choices on facts, not guesses. Studies show that big data analytics capabilities improve marketing and financial performance, boost sales growth, and increase market share.
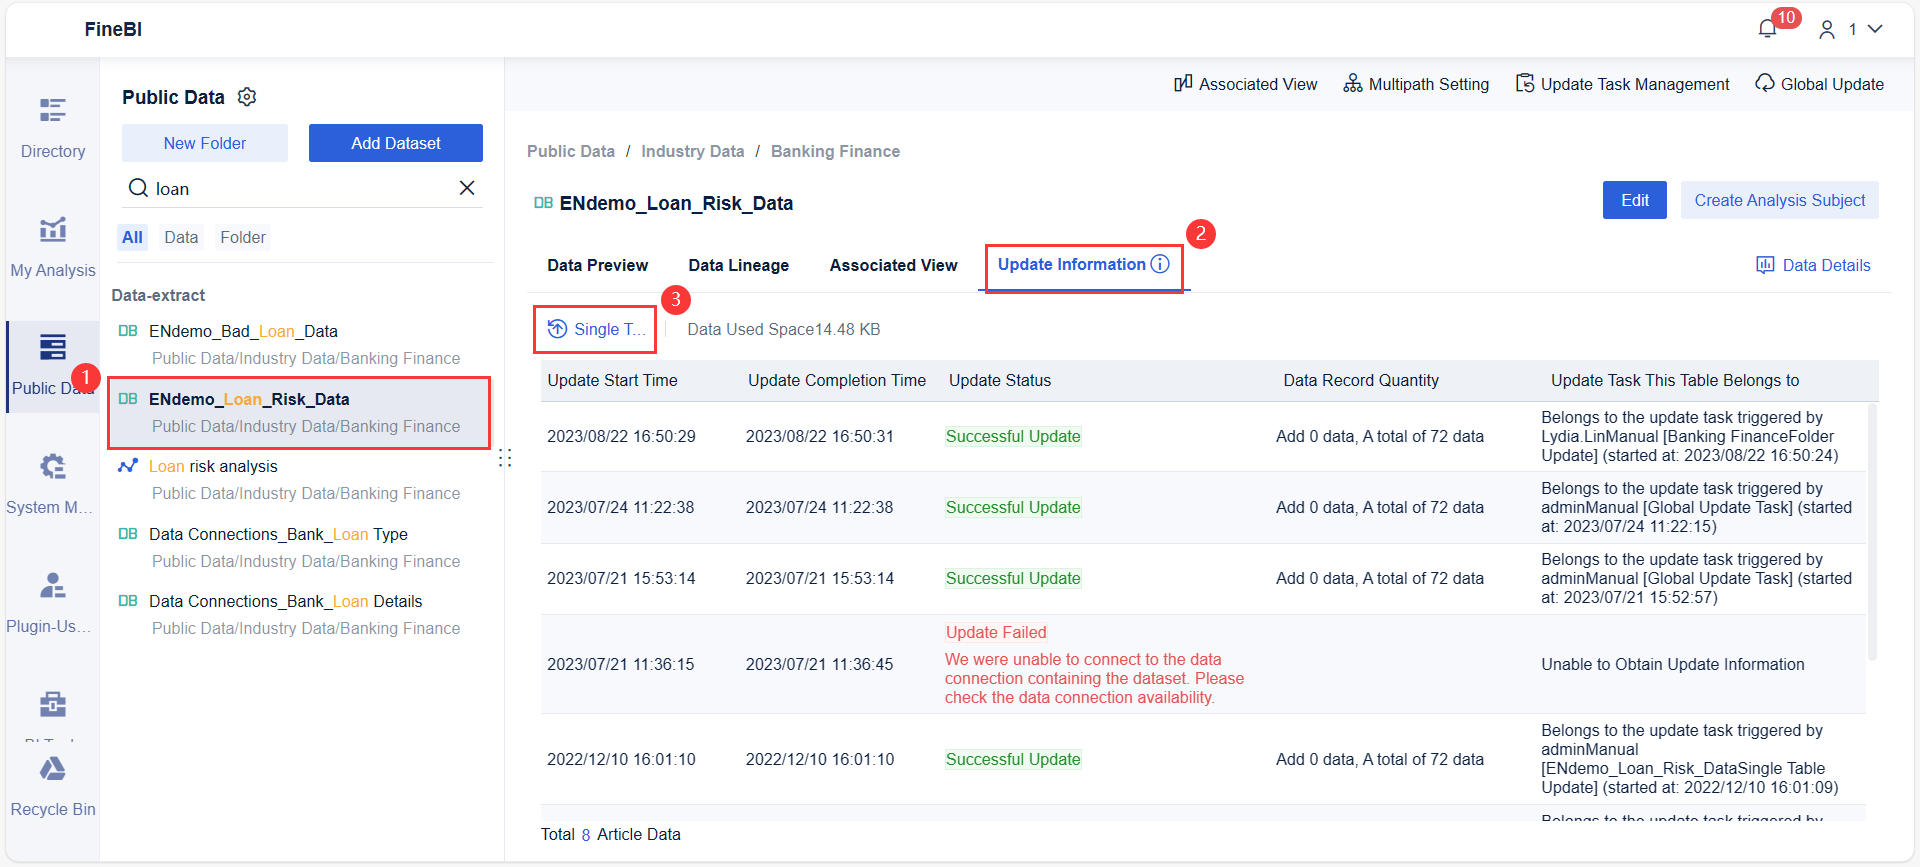
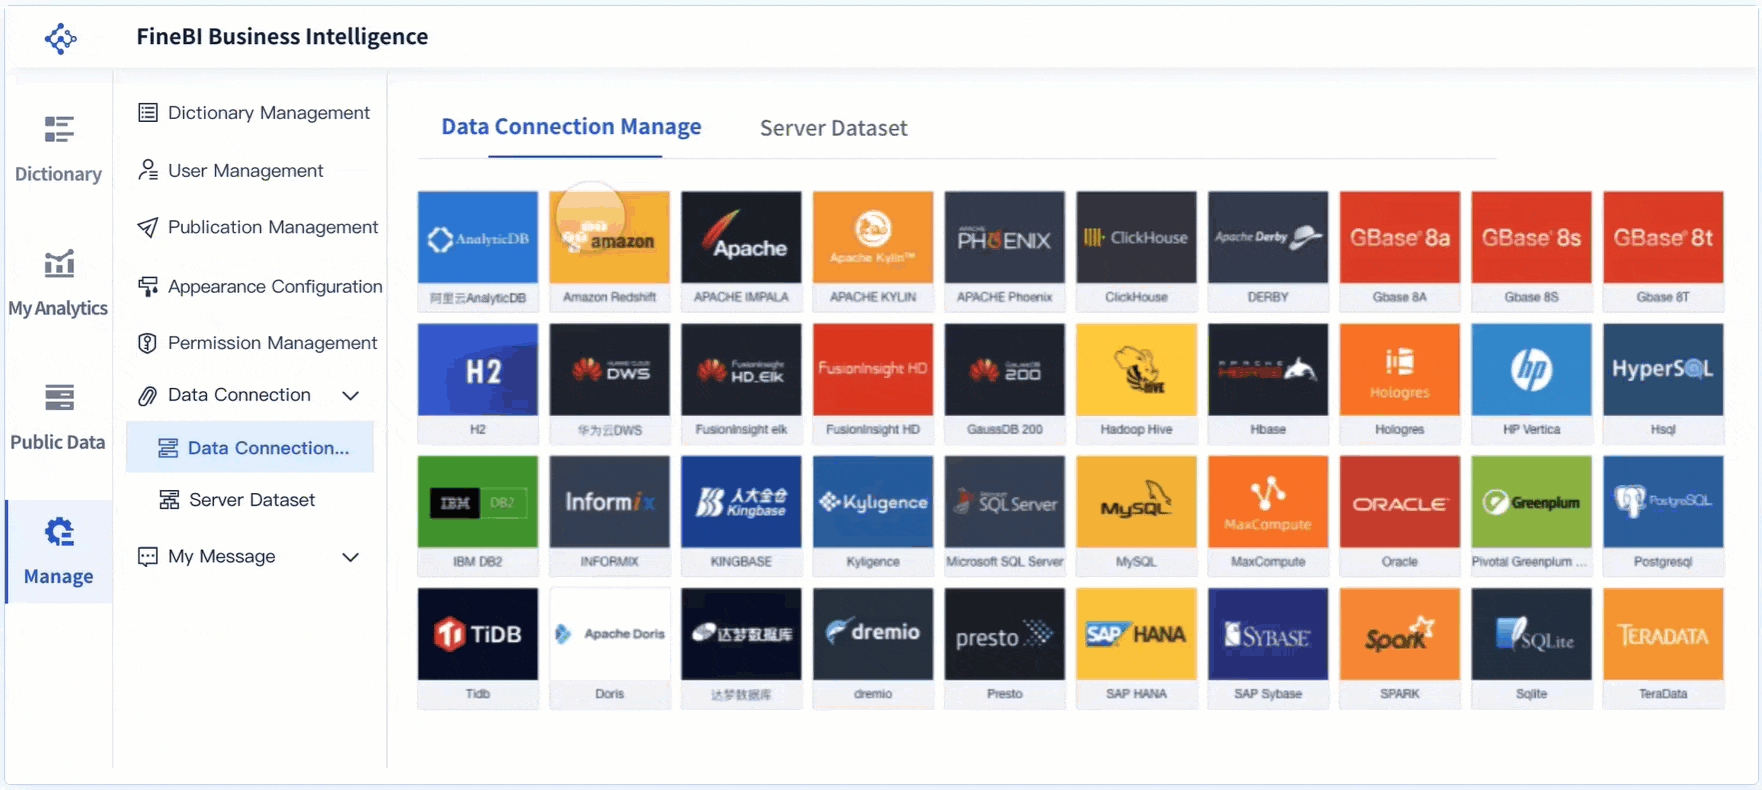
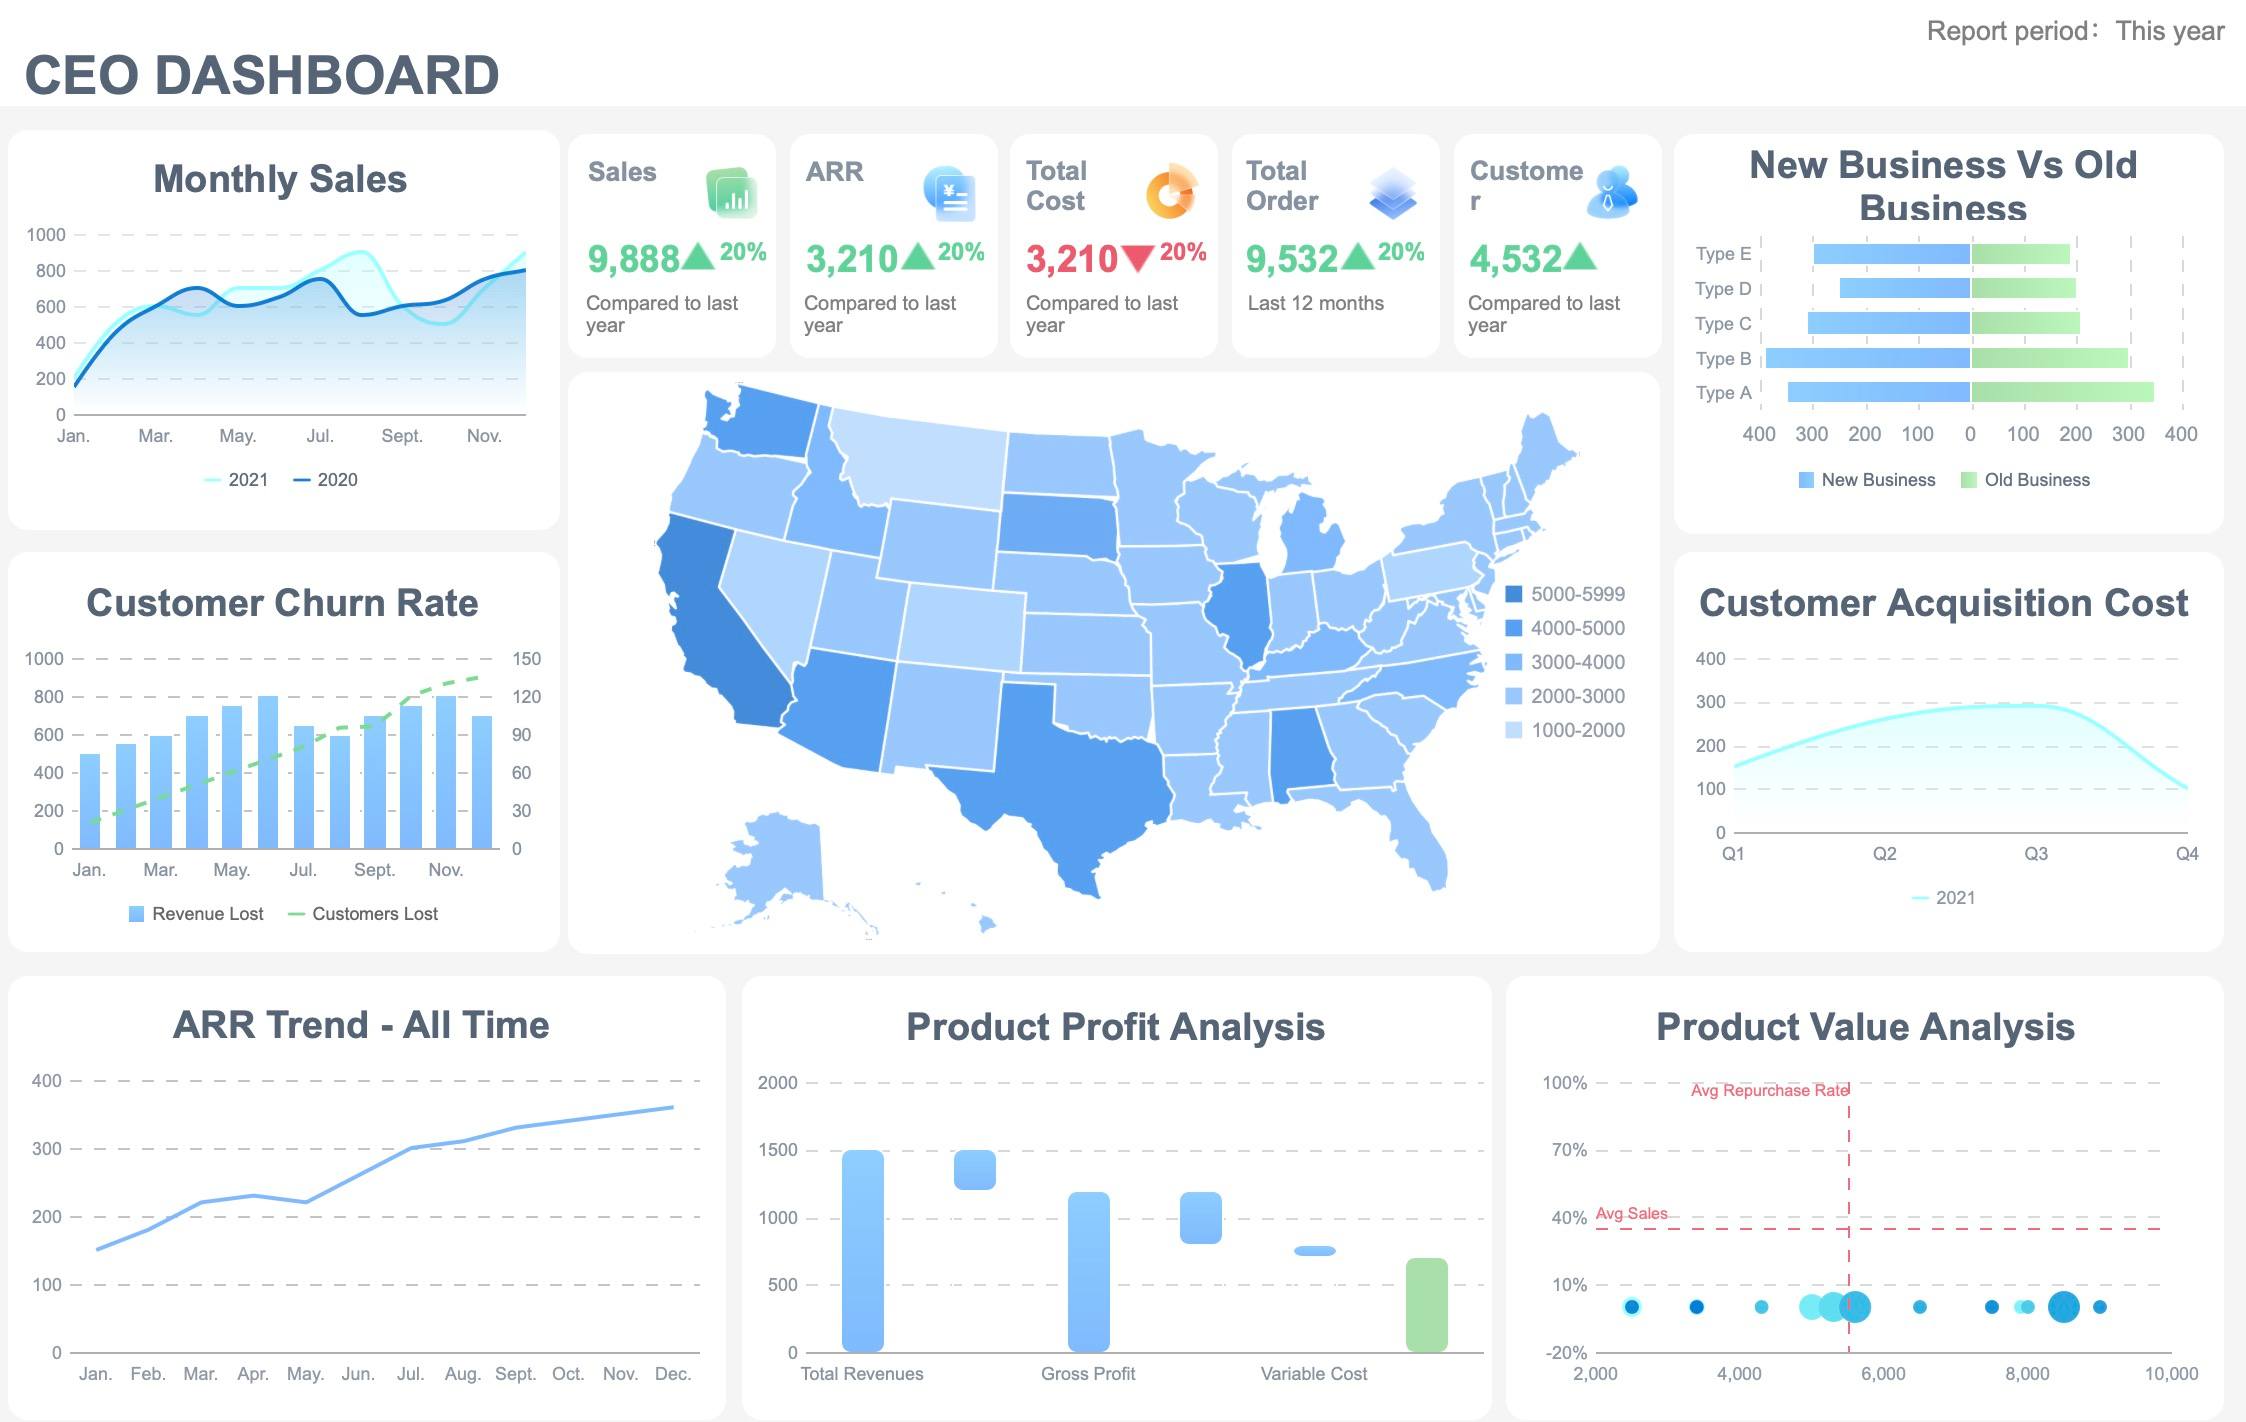
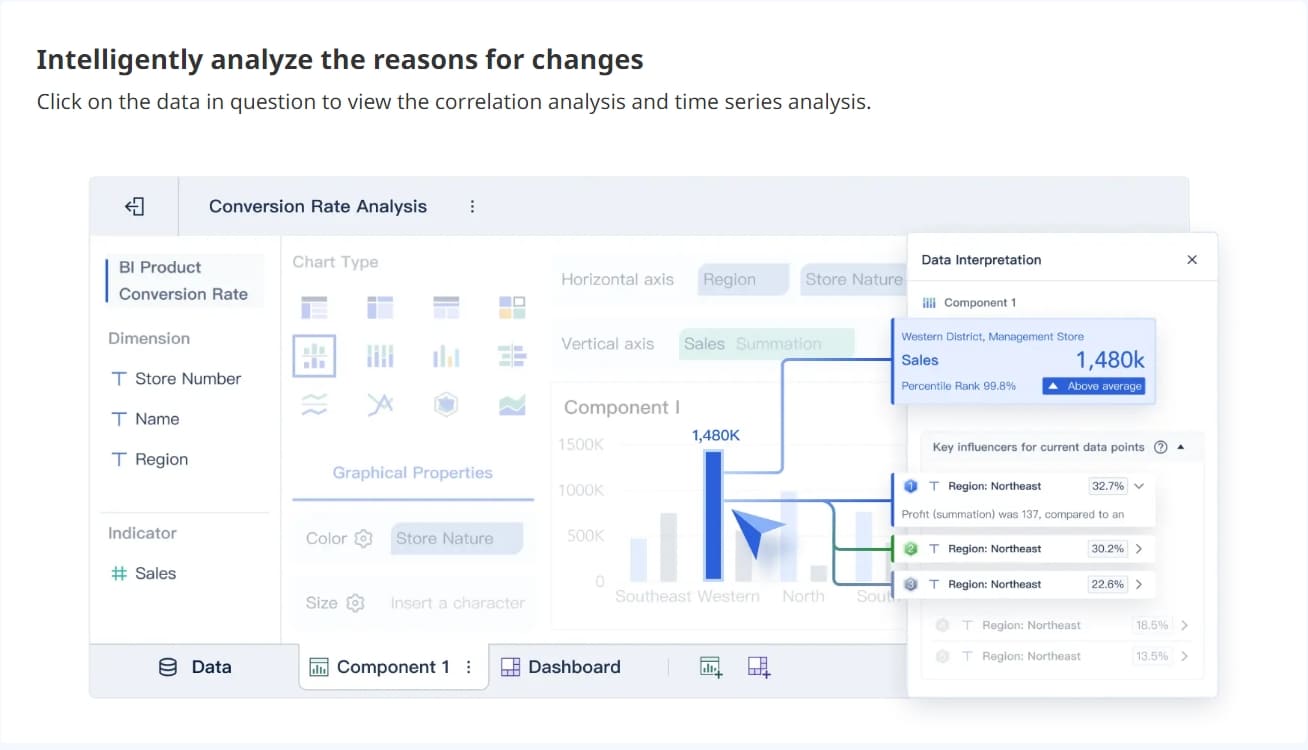
FineBI is a powerful tool that brings data analytics meaning to life for businesses. With FineBI, you connect to multiple data sources, process information, and visualize results—all without needing technical skills. FineBI enables self-service analytics, letting you explore data and generate real-time insights. You can build dashboards, track key metrics, and share findings with your team. This approach supports faster, more accurate decision-making and helps your organization become a true data-driven enterprise.
The story of BOE Technology Group shows the real-world benefits of data analytics meaning. BOE used FineBI to integrate data from different systems, standardize metrics, and create unified dashboards. As a result, BOE reduced inventory costs by 5% and increased operational efficiency by 50%. These improvements came from using data analytics to guide decisions and drive business success.
Data analytics meaning empowers you to make better choices, solve problems, and unlock new opportunities—whether you are managing your personal life or running a business.
Types of Data Analytics Meaning
You encounter different types of data analytics every day. Each type helps you answer specific questions and solve problems using data. Understanding these types of data analytics applications gives you a clearer view of how organizations and individuals use data to gain insights and make decisions.
| Type of Analytics | Definition |
|---|---|
| Descriptive Analytics | Answers the question, 'What happened?' |
| Diagnostic Analytics | Answers 'Why did this happen?' |
| Predictive Analytics | Answers 'What might happen next?' |
| Prescriptive Analytics | Answers 'What should we do about it?' |
Descriptive
Descriptive analytics helps you understand what happened in the past. You look at data to summarize events or trends. For example, you check your social media analytics to see how many people liked your posts last month. You compare these numbers with previous months to spot changes. Businesses use descriptive analytics to review annual revenue reports or inventory data. These applications give a clear snapshot of operations.
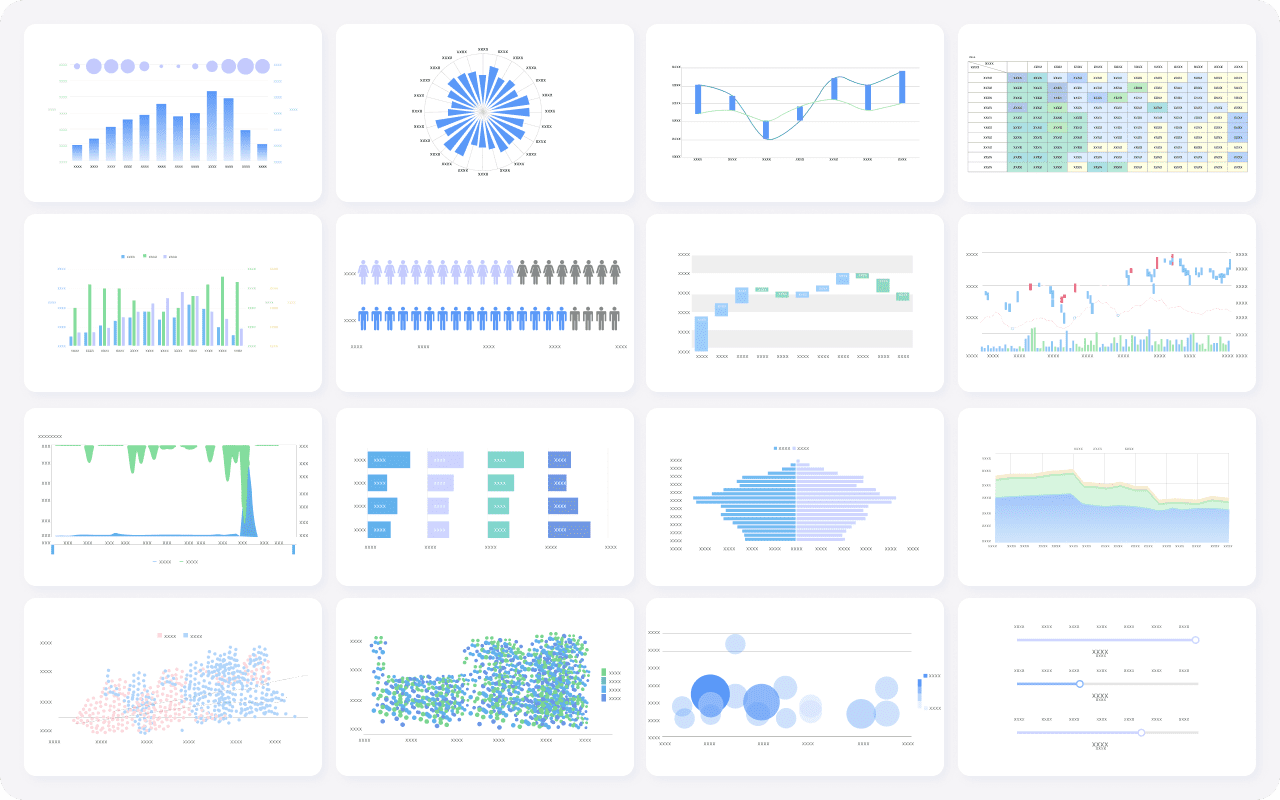
FineBI supports descriptive analytics by letting you create dashboards that visualize historical data. You can drag and drop charts to see trends and compare results over time.
Diagnostic
Diagnostic analytics helps you figure out why something happened. You dig deeper into data to find causes or reasons behind events. Imagine a meal kit company like HelloFresh notices a spike in fish recipe orders among female customers in the northeastern U.S. The team analyzes customer data, including location and order timing, to understand this trend. They might follow up with market research to learn more.
FineBI enables diagnostic analytics by allowing you to filter and drill down into data. You can explore relationships and uncover the reasons behind changes in your business.
Predictive
Predictive analytics uses data to forecast what might happen next. You analyze patterns to make predictions about future events. Retailers use predictive analytics to estimate customer demand and optimize inventory levels. This helps them avoid running out of popular products or overstocking items that may not sell.
With FineBI, you can apply predictive analytics to spot trends and anticipate outcomes. The platform offers tools for modeling and forecasting, helping you prepare for what comes next.
Prescriptive
Prescriptive analytics guides you on what actions to take. You use data to recommend solutions or strategies. In healthcare, prescriptive analytics can analyze patient data to suggest personalized treatment plans. In marketing, it advises on the best timing and content for email campaigns to maximize market share.
FineBI supports prescriptive analytics by providing actionable insights through interactive dashboards. You can test scenarios, compare strategies, and choose the best path forward.
By understanding the types of data analytics, you unlock the power to turn raw data into valuable insights. FineBI makes these data analytics applications accessible, helping you make smarter decisions in any situation.
Data Analytics Meaning in Daily Life
Personal Finance
You use data analytics meaning every time you manage your money. Apps like Mint collect data from your bank accounts and credit cards. These tools track your spending, create budgets, and show you where your money goes. You see patterns in your expenses and find ways to save. Data analysis helps you set financial goals and make smarter choices. The insights you gain from these apps simplify financial management and guide your decisions.
| Application | Description | Impact |
|---|---|---|
| Mint App | Aggregates data from accounts to track spending and create budgets. | Simplifies financial management and provides insights for better decision-making. |
Health and Fitness
Data analytics meaning shapes your health and fitness routines. Devices like Apple Watch and Fitbit collect data about your steps, heart rate, and sleep patterns. You review this information to spot trends and adjust your habits. For example, Apple Watch tracks your activity and suggests new goals. MyFitnessPal analyzes your meals and recommends changes based on your fitness objectives. These insights encourage healthier choices and allow you to detect issues early.
| Evidence | Description |
|---|---|
| Apple Watch | Tracks health metrics and empowers you to modify fitness routines. |
| MyFitnessPal | Analyzes meals and provides tailored recommendations. |
| WHOOP | Assesses sleep quality and recovery, recommending workout intensity. |
- Fitbit monitors physical activity and sleep patterns.
- Apple Watch provides alerts for irregularities and suggests health goals.
Shopping Choices
Data analytics meaning influences your shopping decisions. Retailers study your past purchases and browsing habits. They use data analysis to recommend products that match your preferences. You receive personalized offers and see dynamic pricing based on demand. Macy's increased online sales by adjusting prices with data analytics. Starbucks uses app data to deliver tailored promotions. These strategies improve your shopping experience and help brands meet your needs.
| Example | Description |
|---|---|
| Tailored Product Recommendations | Retailers provide personalized suggestions based on real-time preferences. |
| Dynamic Pricing and Offers | Brands optimize pricing and promotions using data analytics. |
Business intelligence tools like FineBI enable companies to connect to various data sources, analyze information in real time, and generate insights. FineBI’s drag-and-drop visual analysis and automatic data cleansing make it easy for organizations to use data analytics meaning just as you do in daily life.
You see the meaning of data analytics in everyday choices and business strategies. Simple examples, like tracking your spending or reviewing ratings before dining out, show how data helps you make smarter decisions. The democratization of data empowers you and your colleagues to contribute insights, reduce costs, and predict future trends. Businesses benefit from self-service tools such as FineBI, which improve data asset utilization and foster collaboration. Start noticing data in your routines, use basic analysis for personal growth, and explore platforms like FineBI to unlock deeper business value.
| Benefit | Description |
|---|---|
| Self-service capabilities | You create dashboards and analyze data independently. |
| Improved data asset utilization | You optimize and use data more effectively. |
| Enhanced collaboration | You work with others to innovate and improve efficiency. |

Continue Reading About Data Analytics Meaning
Step-by-Step Guide to Setting Up a Data Analytics Framework


FAQ

The Author
Lewis
Senior Data Analyst at FanRuan
Related Articles

What Recruiters Look for in a Data Analysis Portfolio: 10 Criteria to Score Yours Fast
A $1 is not judged like a school assignment. It is judged like a hiring shortcut. Recruiters, hiring managers, and analytics leads use it to answer one question fast: Can this person solve business problems with data in
Lewis Chou
May 29, 2026

What Is Data Analytics Consulting? Beginner’s Guide to Services, Deliverables, and Business Value
$1 helps organizations turn raw data into decisions they can trust. For many business leaders, the challenge is not a lack of data. It is a lack of clarity. Reports conflict, teams track different KPIs, dashboards are un
Lewis Chou
Jun 03, 2026

Data Analyst Job Description [+2026 Guide]: Compare Responsibilities, Skills, and Salary by Industry
A strong $1 does more than list tasks. It defines how a company turns raw data into business decisions, which teams the analyst supports, and what measurable outcomes the role is expected to influence. For employers, tha
Lewis Chou
Jun 02, 2026