You want to know what a data analyst does every day. A data analyst collects, prepares, and interprets data so you can make smarter choices at work. You spend your day connecting to data sources, cleaning up messy data, and building visualizations that help teams understand patterns and trends.
In 2025, your role centers on driving data-driven business decisions. You use tools like FineBI to integrate data from many systems and create dashboards that guide your team. The rise of self-service analytics lets you explore and report on data without waiting for IT support. Many companies now choose platforms with AI and natural language features to make analytics easier and more accessible.
- Global BI adoption reached 26% in 2021, and demand for self-service analytics continues to grow.
- AI-powered tools improve user experience and encourage more people to use data for decision-making.
Data Analyst Daily Tasks
Data Integration
As a data analyst, you start your day by gathering information from different sources. You identify which data you need, whether it comes from databases, spreadsheets, APIs, or cloud platforms. You use tools like FineBI to connect to these sources, making the integration process smooth and efficient. FineBI supports over 60 connectors, so you can bring together data from MySQL, Oracle, Excel files, and even big data platforms like Hadoop.
You often follow a clear process:
- Identify the need for combined data, usually based on requests from your team or business goals.
- Locate the relevant sources and select the specific data required.
- Extract the data in its native format and merge it into a unified dataset.
- Cleanse and normalize the data to ensure accuracy and consistency.
- Load the cleaned data into analytics applications for further analysis.
Many organizations use ETL and ELT tools, such as Airbyte, Fivetran, or SQL Server Integration Services, to automate these steps. FineBI streamlines this workflow, allowing you to schedule incremental updates and maintain high data quality. At Merry Electronics, employees use FineBI to integrate data from manufacturing, sales, and finance systems. This approach reduces manual work and helps everyone access the latest information for data analysis.
Tip: Automating data integration with FineBI saves time and reduces errors, letting you focus on deeper analytics.
Data Processing
Once you have integrated the data, your next responsibility is to prepare it for analysis. You clean the data by removing duplicates, correcting errors, and standardizing formats. You apply validation rules to prevent inaccuracies and check the credibility of external sources. FineBI offers self-service tools for data cleansing, so you do not need advanced coding skills.
The standard steps in the data analysis process include:
- Define the problem you want to solve.
- Collect the necessary data.
- Clean and refine the data to ensure quality.
- Analyze the data to detect patterns and trends.
- Visualize the results.
- Interpret the findings and make decisions.
You use data governance policies to maintain uniformity and apply validation techniques to keep the data accurate. For example, you might set range constraints for values or use referential integrity rules to ensure consistency across datasets. At Merry Electronics, data analysts rely on FineBI's built-in cleaning tools to handle large volumes of manufacturing and sales data. This ensures that reports and dashboards reflect reliable information.
Note: Clean data leads to trustworthy insights and better decision-making.
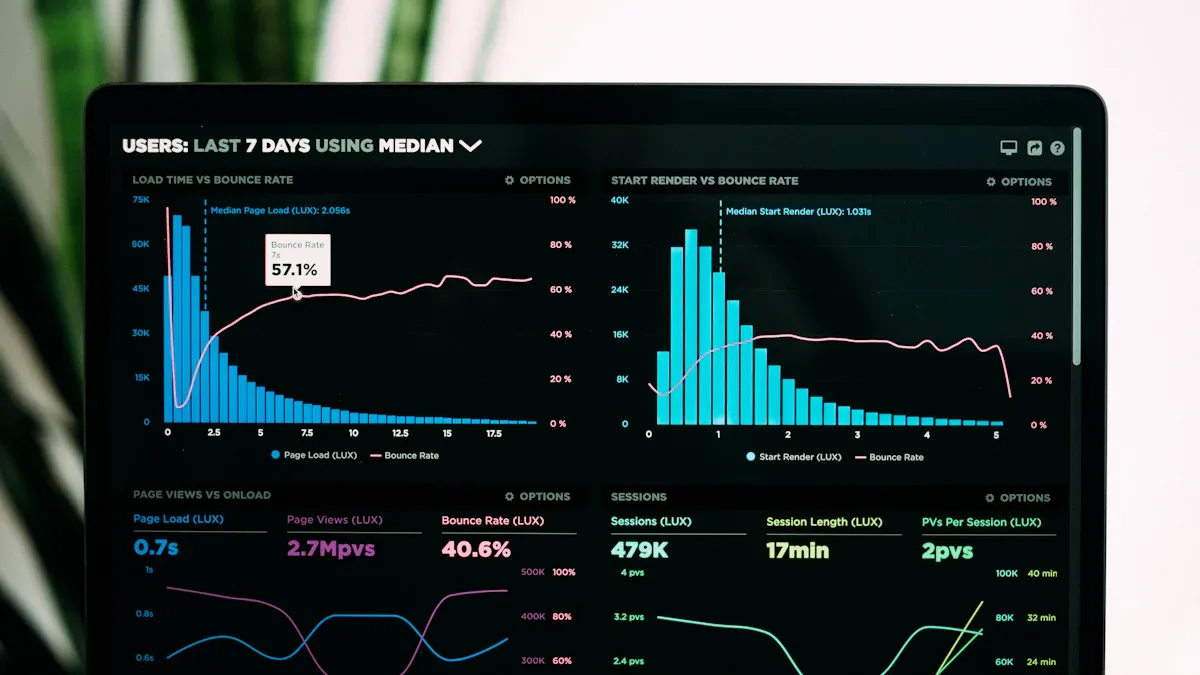
Data Visualization
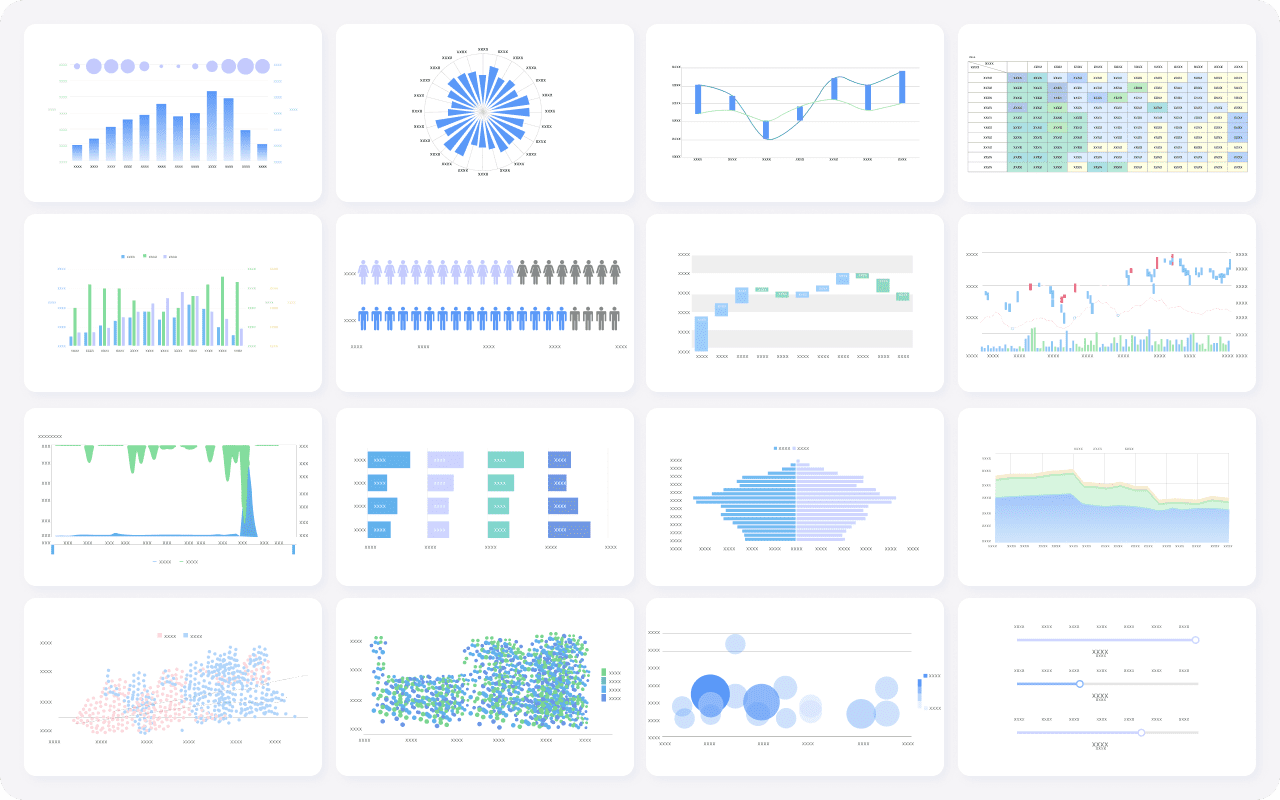
Data visualization is a key responsibility for every data analyst. You transform raw data into charts, graphs, and dashboards that help your team understand complex information quickly. FineBI’s drag-and-drop interface lets you create interactive dashboards without writing code. You can choose from over 60 chart types, including bar charts, line plots, scatter plots, heat maps, and tree maps.
Interactive dashboards allow you to display multiple datasets in one place. You can apply filters, drill down into details, and customize layouts for different devices. This makes it easy for managers and executives to see key metrics and trends at a glance. Studies show that managers using data visualization tools gather information 28% faster, and businesses that rely on customer behavior data can see up to an 85% increase in sales growth.
At Merry Electronics, data analysts use FineBI to build dashboards that track production efficiency, sales performance, and inventory levels. These visualizations help teams spot issues early and respond quickly to changes in the market.
| Technique | Description |
|---|---|
| Charts and graphs | Compare variables and show trends clearly. |
| Interactive dashboards | Combine multiple datasets for a comprehensive view. |
| Geographic visualization | Map-based views for regional analysis. |
| Network visualization | Show relationships between data points. |
Tip: Effective data visualization helps your organization act on insights and stay competitive.
Reporting
Reporting is the final step in your daily workflow as a data analyst. You create reports that summarize your findings and present them to stakeholders. A typical report includes a clear purpose, logical structure, executive summary, introduction, methodology, data description, analysis and findings, discussion, recommendations, conclusion, and references.
You use FineBI to publish and share dashboards securely, ensuring that only authorized users can access sensitive information. You can audit user activity and manage permissions based on roles and departments. This makes collaboration easier and keeps data governance strong.
At Merry Electronics, data analysts generate monthly reports that highlight production trends and sales results. Employees can adjust reports in real time, making it easier to respond to new challenges. The IT department spends less time on manual report generation, and business users gain more control over their own data analysis.
Note: Well-structured reports help teams make informed decisions and drive business growth.
What Does a Data Analyst Do Every Day: Summary of Responsibilities
Your daily responsibilities as a data analyst include:
- Integrating data from multiple sources
- Processing and cleaning data for accuracy
- Creating visualizations to reveal patterns
- Generating reports for stakeholders
- Collaborating with other departments to ensure insights are actionable
FineBI streamlines each step, empowering you to focus on high-value analytics and data-driven decision-making. The experience at Merry Electronics shows how self-service analytics can transform your workflow, reduce IT bottlenecks, and enable faster, smarter business decisions.
Data Analyst Skills
Technical Skills
You need a strong set of technical skills to succeed as a data analyst in 2025. These skills help you collect, process, and interpret data efficiently. The most in-demand technical abilities include:
- SQL for querying databases
- Microsoft Excel for organizing and analyzing data
- R or Python for statistical programming
- Data visualization tools to create clear charts and dashboards
- Machine learning for advanced analysis
- Presentation skills to share your findings
- Critical thinking to solve problems
FineBI makes it easier for you to use these skills. Its self-service features let you connect to data sources, clean data, and build dashboards without needing to write code. You can explore and analyze data independently, even if you do not have a technical background.
Analytical Thinking
Analytical thinking is at the core of effective data analyst skills. You use this mindset to break down complex problems and find solutions. Here is how you apply analytical thinking in your daily work:
- Problem Solving: You identify the root cause of issues and develop solutions.
- Decision Making: You use data insights to make smart choices.
- Data Interpretation: You separate important information from noise and spot patterns.
- Critical Thinking: You question data sources and methods to ensure accuracy.
FineBI supports your analytical thinking by providing tools that help you interpret data and uncover trends quickly.
Communication
You must communicate your findings clearly to people who may not have a technical background. The best data analysts use several strategies to make their insights easy to understand:
| Strategy | Description |
|---|---|
| Understanding Your Audience | Know their background and needs. |
| Simplifying Complex Data | Use simple language and avoid jargon. |
| Providing Context | Explain why the data matters. |
| Frequent Communication | Keep stakeholders updated and build trust. |
| Building Trust and Empathy | Engage in conversations to understand concerns. |
| Using Narrative Approaches | Tell a story with your data to engage and motivate your audience. |
FineBI's self-service analytics help you present data visually and share dashboards easily. This makes your communication more effective and helps everyone in your organization make better decisions.
Data Analyst and FineBI
BI Platforms
You need the right tools to succeed as a data analyst. Modern BI platforms help you manage, analyze, and visualize data efficiently. FineBI stands out as a leading solution for What Does a Data Analyst Do Every Day. You can connect to over 60 data sources, including databases, cloud warehouses, and APIs. FineBI supports drag-and-drop dashboard creation, making analytics accessible to everyone in your organization. You do not need coding skills to build interactive dashboards or explore data trends.
Data Management
Managing data is a core responsibility for every data analyst. FineBI streamlines data integration, processing, and governance. You can clean, verify, and organize data in real time. The platform clarifies business context quickly, so you avoid multiple steps that slow down traditional BI tools. The table below shows how FineBI compares to older platforms:
| Feature | FineBI | Traditional BI Tools |
|---|---|---|
| Efficiency Improvement | At least 50% improvement in data analysis | Varies, often less efficient |
| Real-time Feedback | Yes | Limited or no real-time capabilities |
| Data Processing Verification | Real-time verification of results | Often requires manual checks |
| Business Context Clarification | Clarifies context in one go | May require multiple steps |
You gain faster insights and reduce errors. FineBI's governance features let you control access, audit activity, and protect sensitive data. You can focus on analytics instead of manual data management.
Automation
Automation is essential for What Does a Data Analyst Do Every Day. FineBI automates data updates, report generation, and dashboard sharing. You save time and improve accuracy. FineChatBI adds conversational analytics, letting you interact with data using natural language. You can ask questions, get instant answers, and solve business challenges through an interactive dialogue system. FineChatBI supports multi-turn Q&A, maintains context, and uses advanced technologies for precise query translation. You receive rapid responses, which keeps you engaged and productive.
You can combine automation and conversational analytics to make your daily workflow more efficient. FineBI and FineChatBI empower you to deliver real-time insights and support smarter decision-making.
Data Analysts and Collaboration

Teamwork
You work best when you collaborate with others. As a data analyst, you often join forces with team members from different departments. FineBI makes teamwork easier by providing a unified analytics platform. Everyone works from the same source of truth, which helps you avoid confusion and miscommunication. You can use collaborative workspaces to share insights, annotate findings, and build on each other's work. The table below shows how FineBI supports teamwork:
| Feature | Description |
|---|---|
| Unified analytics platform | All team members access the same data, improving communication and insights. |
| Self-service data exploration | You and your team can explore data and generate reports independently. |
| Collaborative workspaces | Share insights and annotate findings in real time. |
| Reusable data models | Access consistent, vetted data across the organization. |
| Scalable architecture | Handle growing data and user numbers without losing performance. |
| Security and governance | Protect sensitive information with access controls and audit trails. |
Stakeholder Communication
You need to communicate your findings clearly to stakeholders. FineBI helps you bridge the gap between technical analysis and business needs. You translate technical terms into real-world concepts. You use concrete comparisons to make metrics more relatable. You avoid jargon so everyone understands your message. Interactive dashboards let stakeholders explore data themselves, which builds trust in your analytics. You highlight key takeaways and outline next steps, so everyone knows what actions to take.
- Translate technical terms into real-world concepts.
- Use concrete comparisons for clarity.
- Avoid jargon and acronyms.
- Let stakeholders interact with dashboards.
- Emphasize key takeaways and next steps.
Decision Support
Your work as a data analyst drives better decisions. When you collaborate, you help your organization act on insights quickly. FineBI’s governance features ensure that only the right people see sensitive data, which keeps your analytics secure. Real-world examples show the value of collaboration. Microsoft improved productivity and saved over $500,000 per year by reducing meeting travel time. Uber used analytics to improve customer support, reducing ticket resolution time and increasing satisfaction. When you use FineBI, you empower your team to make faster, smarter decisions based on reliable data.
Data Analyst Challenges
Common Issues
You face many challenges in your daily work as a data analyst. The most common issues include:
- Data quality problems. You often deal with incomplete, inconsistent, or inaccurate data. These issues can lead to unreliable results.
- Lack of skilled personnel. Many organizations struggle to find staff with expertise in SQL, Python, or machine learning.
- Data integration difficulties. You must combine data from different sources, which can be complex and time-consuming.
- Resistance to a data-driven culture. Some employees and leaders may not trust data or analytics for decision-making.
- Overwhelming data volume. The amount of data generated each day can be hard to manage.
To overcome these challenges, you use several strategies:
- Data profiling helps you assess the structure and content of your data sources.
- Data cleaning allows you to fix or remove incorrect and incomplete data.
- Data validation ensures your data matches the source and loads correctly.
- Monitoring lets you track data quality over time.
FineBI supports you by automating many of these steps, making your workflow more efficient.
Rewards
A data analyst career offers many rewards. You can work in different industries, enjoy flexible work options, and earn a competitive salary. The table below highlights the main benefits:
| Benefit | Description |
|---|---|
| Opportunities Across Industries | You can work in healthcare, retail, gaming, and more. |
| Remote Work | Many companies offer remote or hybrid work for data analysts. |
| Competitive Salary | The average salary in the U.S. is $80,429, higher than the national average. |
| Growing Job Demand | The data analytics market is expected to exceed $300 billion by 2030. |
You gain valuable experience and contribute to important decisions in your organization.
Growth Opportunities
You have many ways to grow in your data analyst career. The landscape is changing quickly, and you must adapt to new trends:
- Hybrid and remote work models give you flexibility.
- Advanced analytical skills, such as machine learning, are in high demand.
- Interdisciplinary collaboration helps you work with different departments.
- Data ethics and privacy knowledge is essential, especially with regulations like GDPR.
- Continuous learning keeps you up to date with new tools and methods.
- No-code and low-code platforms make analytics more accessible, but you must show your expertise.
FineBI helps you advance by letting you master agile analytics and dynamic visualizations. Earning certifications like FCP positions you for leadership roles and higher pay. You become equipped to manage BI projects and lead teams.
Tip: Embrace new technologies and keep learning to stay ahead in your data analyst career.
You shape business success every day as a data analyst. Your work turns data from a luxury into a necessity for organizations in 2025. You help teams make decisions that boost productivity by 63%. FineBI gives you the tools to create real-time dashboards, secure reports, and custom visualizations. As AI and self-service analytics grow, your career as a data analyst becomes even more valuable. You enjoy a strong data analyst salary and a role that rewards curiosity and impact.

Continue Reading about Data Analyst
What Does Data Analyst Do? Key Responsibilities and Skills
The Best Data Analysis Tools for Professionals in 2025
Data Analysis vs Data Analytics: What’s the Real Difference?


FAQ

The Author
Lewis
Senior Data Analyst at FanRuan
Related Articles

What Recruiters Look for in a Data Analysis Portfolio: 10 Criteria to Score Yours Fast
A $1 is not judged like a school assignment. It is judged like a hiring shortcut. Recruiters, hiring managers, and analytics leads use it to answer one question fast: Can this person solve business problems with data in
Lewis Chou
May 29, 2026

What Is Data Analytics Consulting? Beginner’s Guide to Services, Deliverables, and Business Value
$1 helps organizations turn raw data into decisions they can trust. For many business leaders, the challenge is not a lack of data. It is a lack of clarity. Reports conflict, teams track different KPIs, dashboards are un
Lewis Chou
Jun 03, 2026

Data Analyst Job Description [+2026 Guide]: Compare Responsibilities, Skills, and Salary by Industry
A strong $1 does more than list tasks. It defines how a company turns raw data into business decisions, which teams the analyst supports, and what measurable outcomes the role is expected to influence. For employers, tha
Lewis Chou
Jun 02, 2026