In 2026, data analysis plays a pivotal role in shaping business strategies and driving success. With data creation reaching an astounding 328.77 million terabytes daily, professionals must adopt efficient tools to manage and analyze this vast information. The demand for data science professionals grows by over 30% annually, underscoring the need for updated skills and mastery of cutting-edge data analysis tools. Businesses increasingly rely on data-driven strategies, making it essential to stay informed about the latest trends in data analytics and AI tools for data analytics. The following are 10 Best Data Analysis Tools for Professionals:
Python
R
FineBI
FineReport
Microsoft Power BI
Tableau
Apache Spark
SQL
Google Data Studio
Talend
FanRuan's tools like FineBI and FineReport empower users with self-service analytics and advanced visualizations, ensuring productivity and actionable insights in a rapidly evolving digital transformation landscape.
The data panel and system construction of the cases in this article are implemented by FanRuan's products. Click the button below to use the functions of the latest version of FanRuan's products for free, come and try it!
Tool Selection: Choose tools like FineBI and FineReport based on ease of use, scalability, and integration with other systems to meet business needs.
Key Features: FineBI enables self-service analytics, saving time, and FineReport offers over 60 chart types for advanced data storytelling.
Long-Term Value: Consider long-term costs and try free trials to ensure tools fit your needs and support future growth for better decision-making.
Criteria for Evaluating the Best Data Analysis Tools
Choosing the right data analysis tools is essential for professionals aiming to stay ahead in the fast-paced world of data analytics. Here are the key criteria to consider when evaluating these tools:
Usability
Intuitive interfaces and ease of learning
A user-friendly interface ensures that you can quickly adapt to a tool without extensive training. Tools like FineBI excel in this area by offering a drag-and-drop interface that simplifies data exploration. This feature makes it accessible even to users with limited technical expertise.
Data-driven platforms prioritize user experience, enabling you to focus on insights rather than struggling with complex functionalities.
Tools with clear workflows, such as FineBI, empower users to perform self-service analytics, boosting productivity across teams.
Availability of documentation and support
Comprehensive documentation and responsive support are vital for overcoming challenges. FineBI provides detailed guides and a robust support system, ensuring you can resolve issues efficiently. Additionally, its enterprise-level data permission control enhances security, making it a reliable choice for organizations.
Scalability
Handling large datasets efficiently
As data volumes grow, scalability becomes a critical factor. FineBI’s high-performance computing engine processes massive datasets seamlessly, supporting over 10,000 users simultaneously. This capability ensures that your data analytics platform remains efficient, even as your organization scales.
Adapting to growing business needs
A scalable digital transformation requires tools that evolve with your business. FineReport, with its real-time analytics and adaptive design, offers industry-specific solutions for sectors like manufacturing and healthcare. Its ability to handle dynamic 3D visualizations and over 60 chart types makes it a versatile choice for diverse business needs.
Pharmaceutical Industry Data Application Analysis Platform Created By FineReport
Criteria
Description
Type of Data and Complexity
The nature of the data (structured, unstructured, big) influences tool selection.
Types of Data Analysis Required
Different tools are suited for specific analyses (e.g., Python for machine learning, Tableau for reports).
User Expertise and Technical Skills
The team's technological expertise affects tool choice (e.g., Excel for ease, Python for programming knowledge).
Integration with Existing Systems
Compatibility with current infrastructure is crucial.
Scalability and Performance
The tool's ability to handle current and future data volumes is essential.
Cost
Free vs. Paid Tools
Free tools like Apache Superset offer basic functionalities but often require additional infrastructure investments. Paid tools, such as FineBI, provide comprehensive features, including real-time data analysis and augmented analytics, ensuring value for money.
Sales Management CenterDashboard Created By FineReport
Value for money and ROI
Investing in tools like FineBI and FineReport delivers a high return on investment. FineBI enhances data analysis efficiency by over 50%, while FineReport’s zero-code interface reduces development costs. These tools not only save time but also empower teams to make predictive decisions, aligning with the latest trends in data analytics.
Tool Type
Cost
Features Offered
Free Tools
No licensing fees
Open-source tools like Apache Superset; potential costs for deployment and maintenance.
Paid Tools
Starts at $99/month
Comprehensive features, intuitive interfaces, and support services, e.g., SPSS for statistical analysis.
Tip: While free tools may seem cost-effective initially, consider long-term expenses like maintenance and customization. Paid tools often provide better support and advanced features, making them a worthwhile investment for scalable digital transformation.
FineBI and FineReport stand out as robust options for professionals. FineBI focuses on self-service analytics and real-time insights, while FineReport specializes in advanced visualizations and storytelling. Together, they form a powerful data analytics platform tailored to meet diverse business needs.
Integration
Compatibility with other software
In today’s interconnected digital landscape, seamless compatibility with other software is essential for any data analysis tool. You need tools that can integrate effortlessly with your existing systems, ensuring smooth workflows and efficient data management. FineBI excels in this area by supporting integration with over 100 common data sources, including relational databases like MySQL, Oracle, and SQL Server, as well as big data platforms like Hadoop and Hive. This versatility allows you to unify data from multiple systems, eliminating silos and enabling comprehensive analysis.
FineReport complements this by offering adaptive design and compatibility across devices, including smartphones, tablets, and PCs. Its ability to integrate with GeoJSON and GLB files for 3D visualizations makes it a standout choice for industries like manufacturing and healthcare. In comparison, although tools like Tableau and Power BI also provide robust integration capabilities, but FineBI’s enterprise-level data permission control and FineReport’s zero-code interface give them an edge in usability and security.
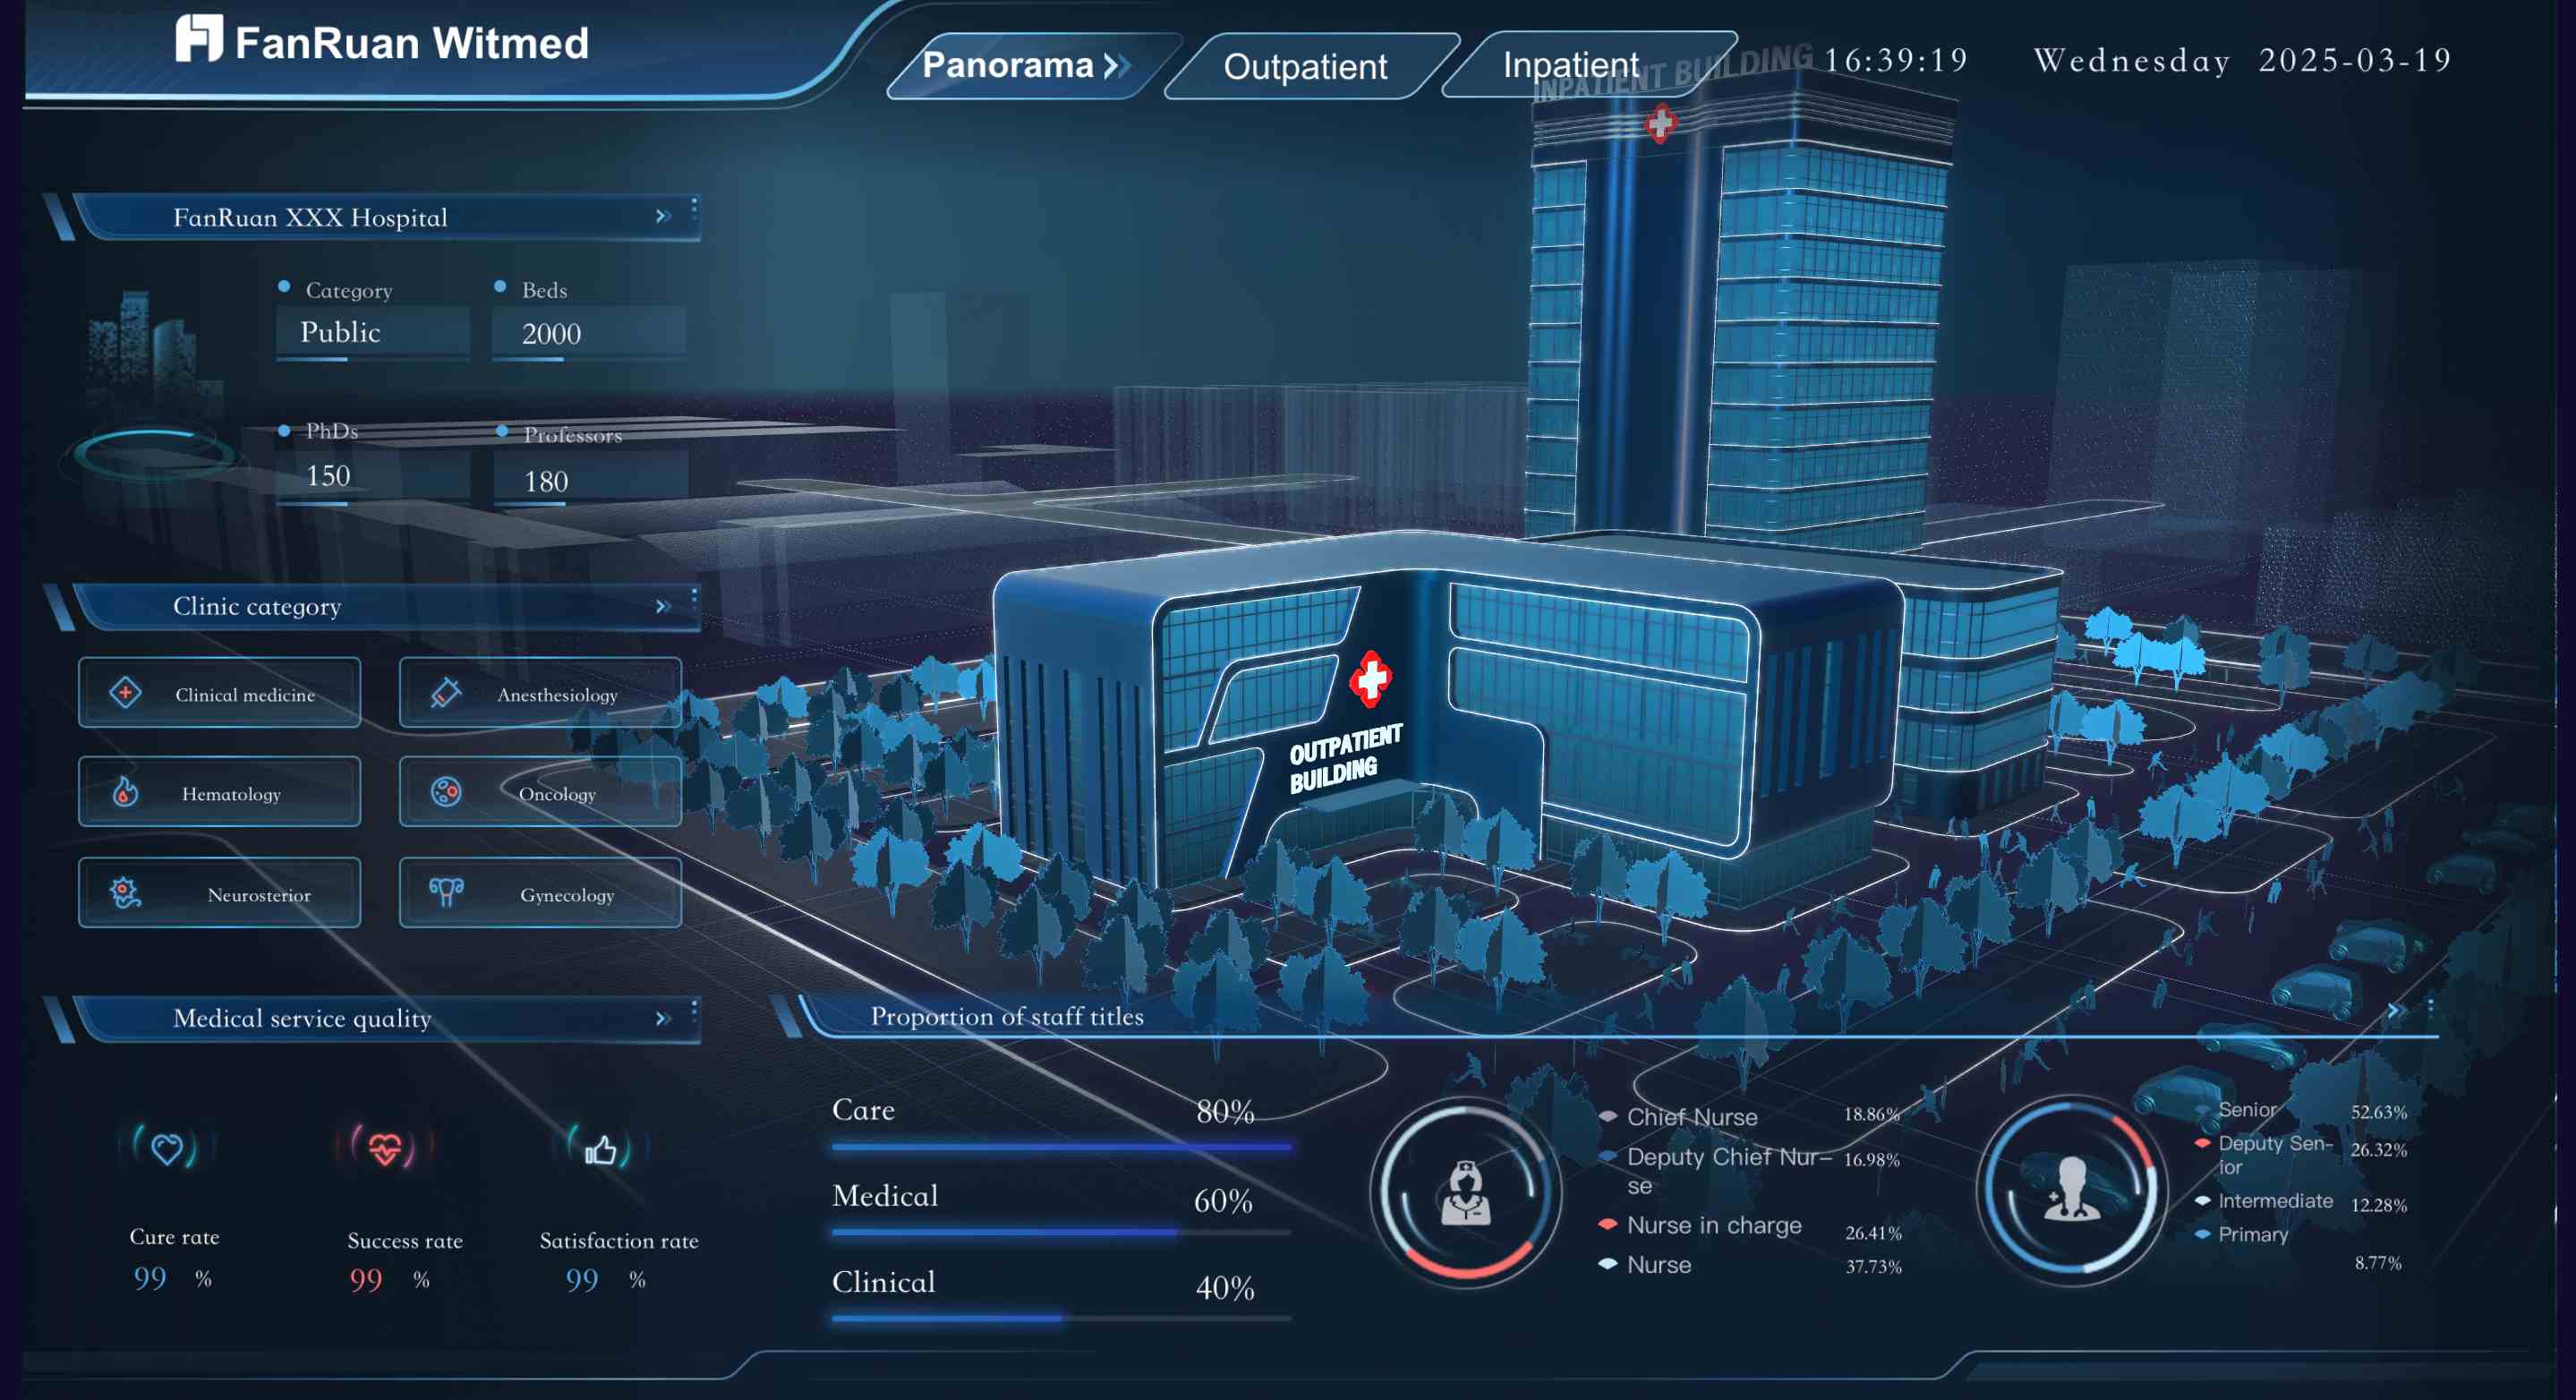
FanRuan Hospital Platform Created By FineReport
API and third-party integrations
APIs and third-party integrations are the backbone of modern data analysis tools. They allow you to extend the functionality of your tools and connect them with specialized applications. FineBI and FineReport shine in this aspect. FineBI’s API capabilities enable you to share data between systems without writing code, making it accessible even for non-technical users. This feature is particularly useful for SaaS applications, where quick and seamless data sharing is crucial.
FineReport takes this a step further by offering off-screen control for remote data presentation management. This feature is invaluable for industries requiring dynamic storytelling, such as marketing and logistics. While tools like Power BI and Tableau also offer API integrations, FineBI’s visual and modern operation interface makes deployment significantly more user-friendly.
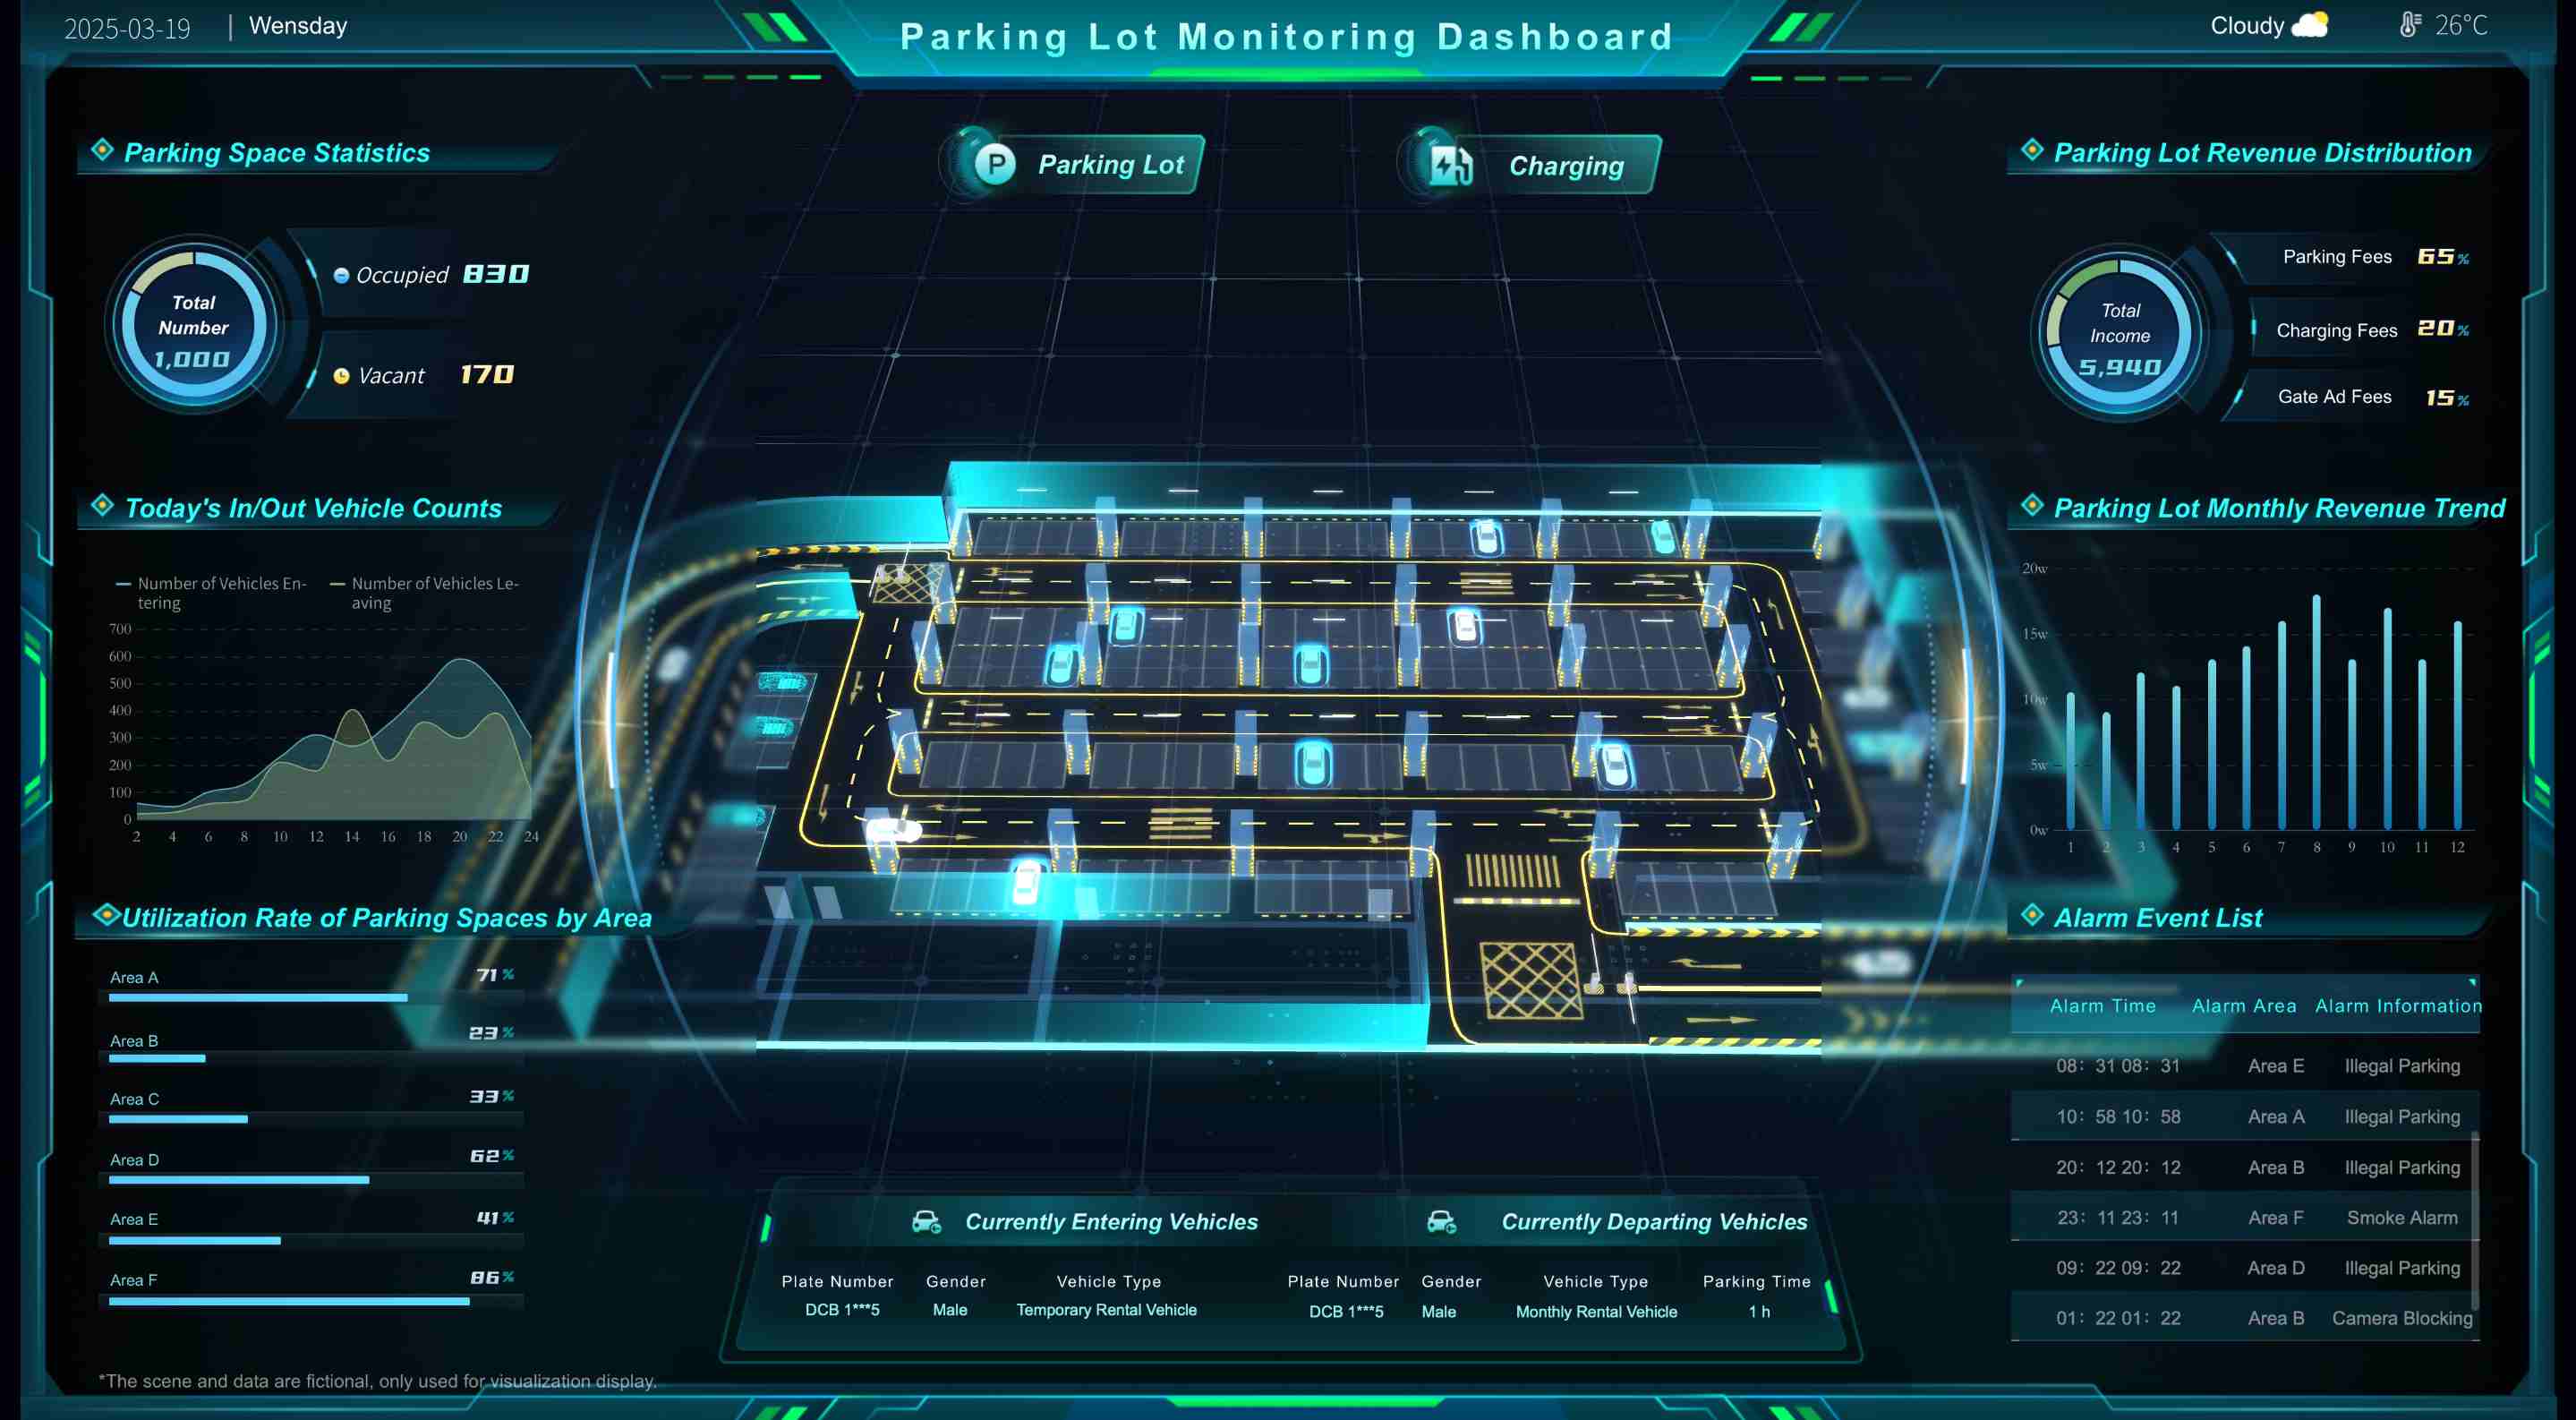
Parking Lot Monitoring Dashboard Created By FineReport
Metro Bank’s experience highlights the importance of API-driven automation. By implementing Power BI, they automated financial reporting, reducing errors and saving time. FineBI offers similar benefits but with added flexibility through its ETL/ELT functions and real-time data synchronization. These features make it a cost-effective solution for businesses looking to streamline operations and enhance data governance.
Tip: When choosing a data analysis tool, prioritize those with robust API support and compatibility with your existing systems. FineBI and FineReport not only meet these criteria but also offer unique features that simplify integration and enhance productivity.
Top 10 Data Analysis Tools for Professionals in 2026
1.Python: The Foundation of Data Analysis
Key features and libraries (e.g., Pandas, NumPy)
Python remains a cornerstone in data analysis due to its simplicity and flexibility. Its extensive library ecosystem, including Pandas, NumPy, and Scikit-Learn, equips you with powerful tools for data manipulation, statistical analysis, and machine learning. Pandas simplifies data cleaning and transformation, while NumPy excels in numerical computations. Scikit-Learn provides robust machine learning algorithms, making Python indispensable for predictive analytics.
Python’s open-source nature ensures constant updates and innovations, supported by a vast community of developers. This accessibility makes it suitable for both beginners and experts. Its ability to handle structured and unstructured data across industries like finance, healthcare, and e-commerce further solidifies its position as a top choice for data analytics.
Use cases in data science and machine learning
Python’s versatility allows you to tackle diverse challenges. In data science, you can use it to clean and analyze datasets, uncovering actionable insights. For machine learning, Python enables you to build predictive models that forecast trends or customer behaviors. For example, e-commerce companies use Python to recommend products based on user preferences, enhancing customer experiences.
With a near 50% adoption rate among developers, Python’s popularity reflects its effectiveness. Its integration capabilities with other data analysis tools make it a reliable foundation for your analytics projects.
2.R: Advanced Statistical Analysis
Statistical analysis and visualization capabilities
R excels in statistical computing and data visualization. It offers specialized packages like ggplot2 for creating detailed visualizations and dplyr for data manipulation. These tools allow you to perform complex statistical analyses with ease. R’s strength lies in its ability to handle large datasets and generate high-quality visualizations, making it ideal for industries requiring in-depth data interpretation.
R has gained significant traction in academia and research. Recent studies show that 25% of all PubMed articles now utilize R, surpassing SPSS in popularity. This shift highlights R’s growing importance in fields like pharmaceuticals and finance. Despite a slight drop in the TIOBE index rankings, R remains a preferred choice for statistical analysis and data visualization.
R’s open-source nature and active community ensure continuous development, keeping it relevant for advanced analytics. Its focus on statistical rigor makes it a valuable tool for researchers and analysts seeking precise insights.
3.FineBI: Self-Service Data Analytics for Enterprises
Empowering business users with self-service analytics
FineBI revolutionizes data analysis by empowering you to explore and analyze data independently. Its self-service capabilities eliminate the need for extensive IT support, allowing business users to access real-time insights effortlessly. FineBI’s intuitive interface simplifies complex tasks, making it accessible even to users with limited technical expertise.
Unlike traditional tools, FineBI focuses on collaboration and accessibility. Teams can share dashboards and datasets, fostering a data-driven culture within your organization. This feature enhances productivity by enabling seamless teamwork and efficient decision-making.
Key features: OLAP analysis, real-time insights, and collaboration
FineBI stands out with its OLAP analysis capabilities, which allow you to drill down into data, filter results, and perform cross-theme analysis. Its high-performance computing engine processes massive datasets, supporting over 10,000 users simultaneously. This scalability ensures that FineBI adapts to your growing business needs.
FineBI also integrates with over 100 data sources, including MySQL, Oracle, and Hadoop, enabling comprehensive analysis across multiple systems. Its real-time insights feature ensures that your decisions are always based on the latest data. Additionally, FineBI’s enterprise-level data permission control enhances security, making it a reliable choice for organizations handling sensitive information.
Tip: FineBI’s combination of usability, scalability, and collaboration makes it a standout choice for enterprises. Its ability to transform raw data into actionable insights boosts productivity and drives informed decision-making.
4.FineReport: Advanced Data Visualization and Storytelling
Over 60 chart types and dynamic 3D visualizations
FineReport offers a comprehensive suite of tools for data visualization, making it an essential platform for professionals seeking to transform raw data into actionable insights. With over 60 chart types, including Gantt charts, Sankey diagrams, and waterfall charts, FineReport caters to diverse visualization needs. Its dynamic 3D visualizations, compatible with GeoJSON and GLB files, allow you to create immersive and interactive representations of complex datasets.
The platform’s zero-code, drag-and-drop interface ensures accessibility for users of all technical levels. You can design dashboards effortlessly, enabling quick analysis and decision-making. FineReport also supports real-time analytics, ensuring you always have the most current data at your fingertips. This capability makes it a powerful tool for predictive analytics and executive dashboards.
Industry-specific solutions for manufacturing, healthcare, and more
FineReport excels in providing tailored solutions for various industries. In manufacturing, it enhances operational efficiency by visualizing production data and identifying bottlenecks. Healthcare professionals use FineReport to monitor patient data and optimize resource allocation. Its adaptability extends to logistics, where it tracks supply chain performance, and smart cities, where it visualizes urban data for better planning.
Compared to other tools like Tableau, FineReport stands out with its real-time insights and industry-specific applications. While Tableau offers advanced visualization features, FineReport provides a more intuitive interface and seamless integration with other FanRuan products like FineBI. This combination creates a unified platform for data analysis and visualization, empowering organizations to make informed decisions quickly.
5.Microsoft Power BI: Interactive Dashboards and Reporting
Integration with the Microsoft ecosystem
Power BI is a leading tool for creating interactive dashboards and reports. Its seamless integration with the Microsoft ecosystem, including Excel, Azure, and Teams, makes it a preferred choice for businesses already using Microsoft products. This compatibility simplifies data sharing and collaboration across teams.
Power BI’s API capabilities allow you to connect with various data sources, enabling comprehensive analysis. Its real-time monitoring features ensure that you can track key metrics and respond to changes promptly. For instance, Microsoft uses Power BI to monitor IT infrastructure performance, providing real-time insights into system uptime and security incidents.
Use cases in business intelligence
Organizations across industries leverage Power BI for business intelligence. Cleaver Fulton Rankin improved operational efficiency by using Power BI dashboards for case management. Pfizer enhanced clinical trial monitoring, accelerating drug development and ensuring compliance. These examples highlight Power BI’s versatility in delivering actionable insights.
While Power BI excels in integration and ease of use, FineBI offers a more robust solution for self-service analytics. FineBI’s high-performance computing engine processes massive datasets efficiently, supporting over 10,000 users simultaneously. This scalability makes it ideal for enterprises with growing data needs.
6.Tableau: Advanced Data Visualization
Dynamic visualizations and storytelling
Tableau is renowned for its ability to create dynamic visualizations that tell compelling stories. Its extensive customization options and advanced visualization features make it a favorite among data analysts. You can use Tableau to design interactive dashboards that provide deep insights into your data.
Tableau’s applications extend across various business intelligence scenarios. It excels in creating executive dashboards that track KPIs and uncover trends. However, its steeper learning curve and higher cost may pose challenges for some users.
Feature
Tableau
Power BI
Advanced Visualization
Yes
Limited
Customization
High
Moderate
Community Support
Strong
Moderate
Cost
Higher
Affordable
Learning Curve
Steeper
Easier
Data Connectivity Options
Extensive
Fewer
FineReport offers a compelling alternative to Tableau. Its zero-code interface and real-time analytics make it more accessible, while its industry-specific solutions provide added value. By combining FineReport with FineBI, you can achieve a comprehensive data analytics platform that meets diverse business needs.
7.Apache Spark: Big Data Processing and Analytics
Scalability for enterprise-level projects
Apache Spark is a powerful tool for processing big data, making it a top choice for enterprise-level projects. Its distributed computing framework allows you to handle massive datasets efficiently. By leveraging Spark's APIs, you can optimize performance and scale your analytics operations seamlessly. However, achieving this scalability requires careful resource management, especially in cluster setups. For example, simplifying data models through de-normalization can significantly enhance performance during batch processing.
Spark's ability to process data across multiple nodes ensures that even the most complex analytics tasks are completed quickly. This scalability makes it ideal for industries like finance and e-commerce, where large-scale data analysis is essential. Compared to tools like Tableau, which focus on data visualization, Spark excels in handling raw data and transforming it into actionable insights.
Real-time data processing capabilities
Real-time data processing is another area where Apache Spark shines. Its in-memory computing capabilities allow you to process streaming data with minimal latency. This feature is invaluable for applications like fraud detection, where immediate insights are crucial. For instance, Spark Streaming enables you to analyze data as it arrives, ensuring timely decision-making.
FineBI complements Spark by offering real-time data synchronization and self-service analytics. While Spark handles the heavy lifting of data processing, FineBI provides an intuitive interface for exploring and visualizing the results. Together, these tools create a robust analytics ecosystem that supports both technical and non-technical users.
8.SQL: Essential for Structured Data Analysis
Database querying and management
SQL remains the backbone of structured data analysis. Its ability to query and manage relational databases efficiently makes it indispensable for data professionals. You can use SQL to ingest, clean, transform, and load data, ensuring that your analytics pipeline runs smoothly. Its standardized syntax allows you to perform complex queries, making it a versatile tool for data transformation.
SQL's role in database management extends to maintaining data integrity and optimizing performance. For example, indexing and query optimization techniques can significantly speed up data retrieval. This efficiency is why SQL continues to be a critical skill for data engineers and analysts alike.
Use cases in relational database analysis
SQL's applications span various industries. In finance, you can use it to analyze transaction data and detect anomalies. In healthcare, SQL helps manage patient records and generate reports for compliance. Its versatility makes it a go-to tool for relational database analysis.
FineBI enhances SQL's capabilities by integrating with relational databases like MySQL and Oracle. Its drag-and-drop interface allows you to perform SQL-like operations without writing code, making data analysis accessible to a broader audience. This feature sets FineBI apart from tools like Power BI, which require more technical expertise for similar tasks.
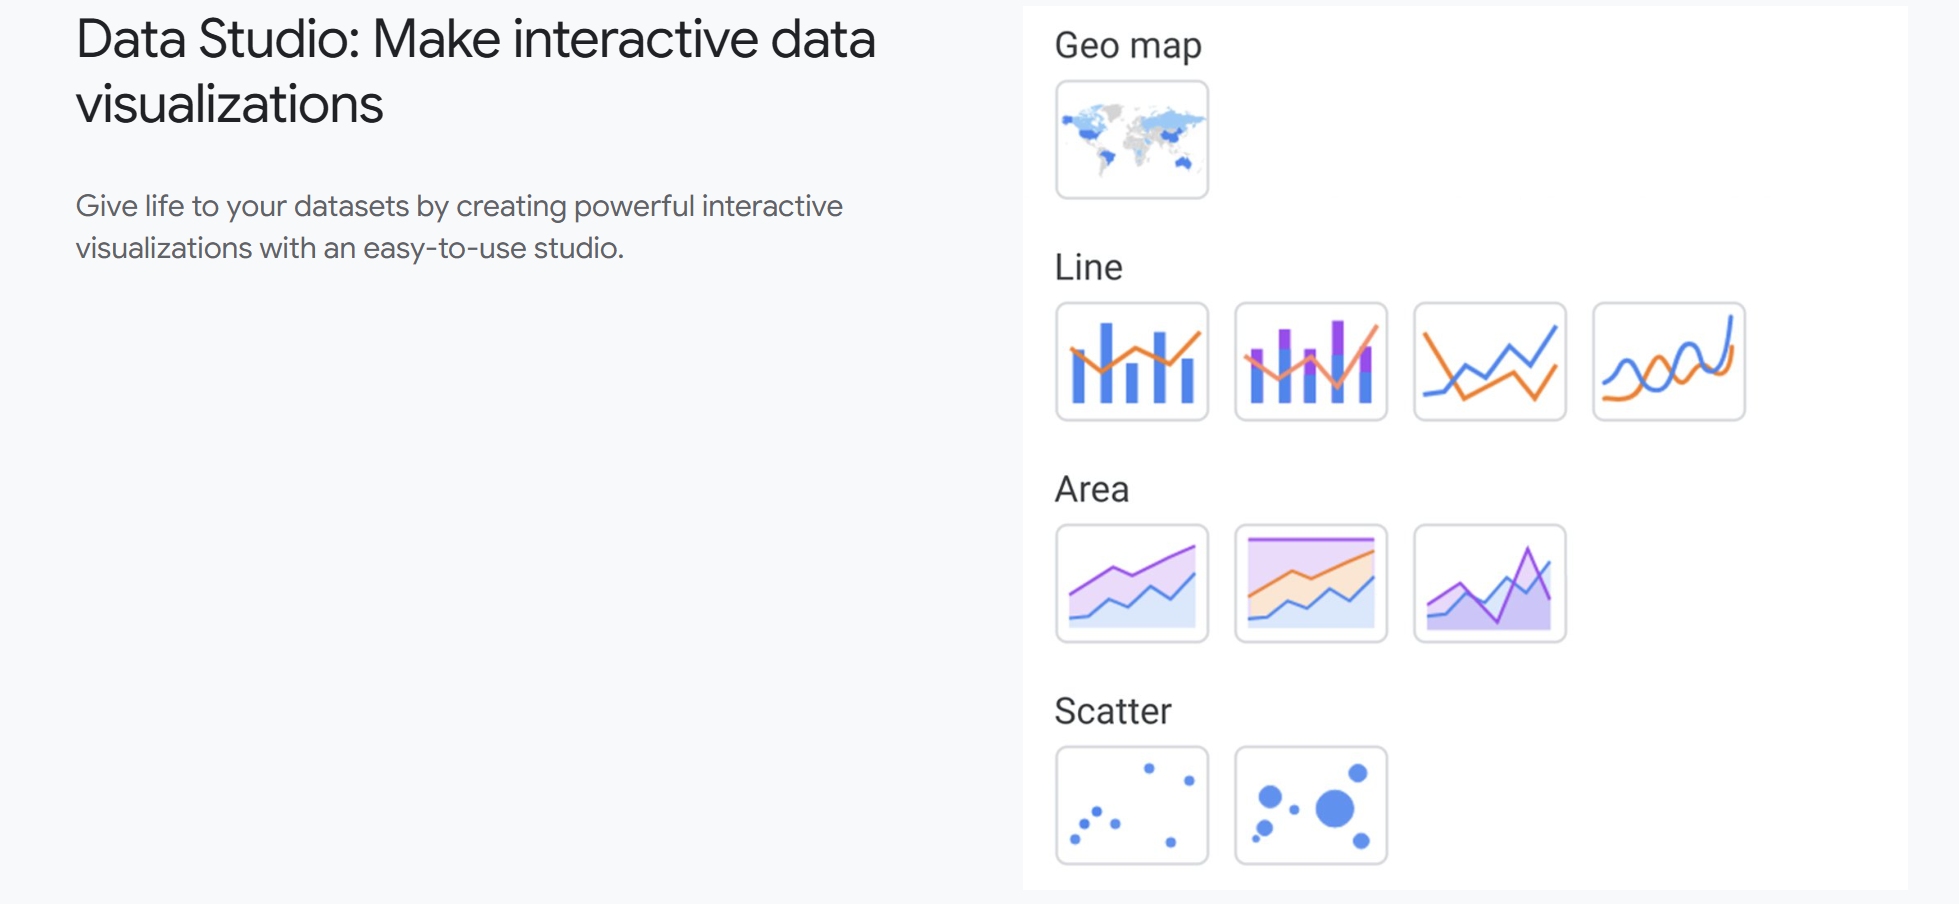
9.Google Data Studio: Free and User-Friendly Reporting
Integration with Google services
Google Data Studio offers a free and user-friendly platform for creating reports and dashboards. Its seamless integration with Google services like Google Analytics, Google Ads, and Google Sheets makes it a convenient choice for businesses already using the Google ecosystem. This compatibility allows you to visualize data from multiple sources in one place, simplifying your analytics workflow.
The familiar Google-style interface ensures that you can navigate the platform easily. Whether you're a small business owner or a marketing professional, Data Studio provides the tools you need to create compelling reports. Its ability to connect with non-Google data sources further enhances its versatility.
Applications in marketing and web analytics
Google Data Studio excels in marketing and web analytics. You can use it to track campaign performance, monitor website traffic, and measure ROI. Its customizable dashboards provide real-time insights, helping you make data-driven decisions.
While Data Studio is a great starting point for reporting, FineReport offers more advanced visualization options. With over 60 chart types and dynamic 3D visualizations, FineReport caters to industries requiring detailed and interactive dashboards. Unlike Data Studio, which focuses on simplicity, FineReport provides industry-specific solutions, making it a more comprehensive tool for data visualization.
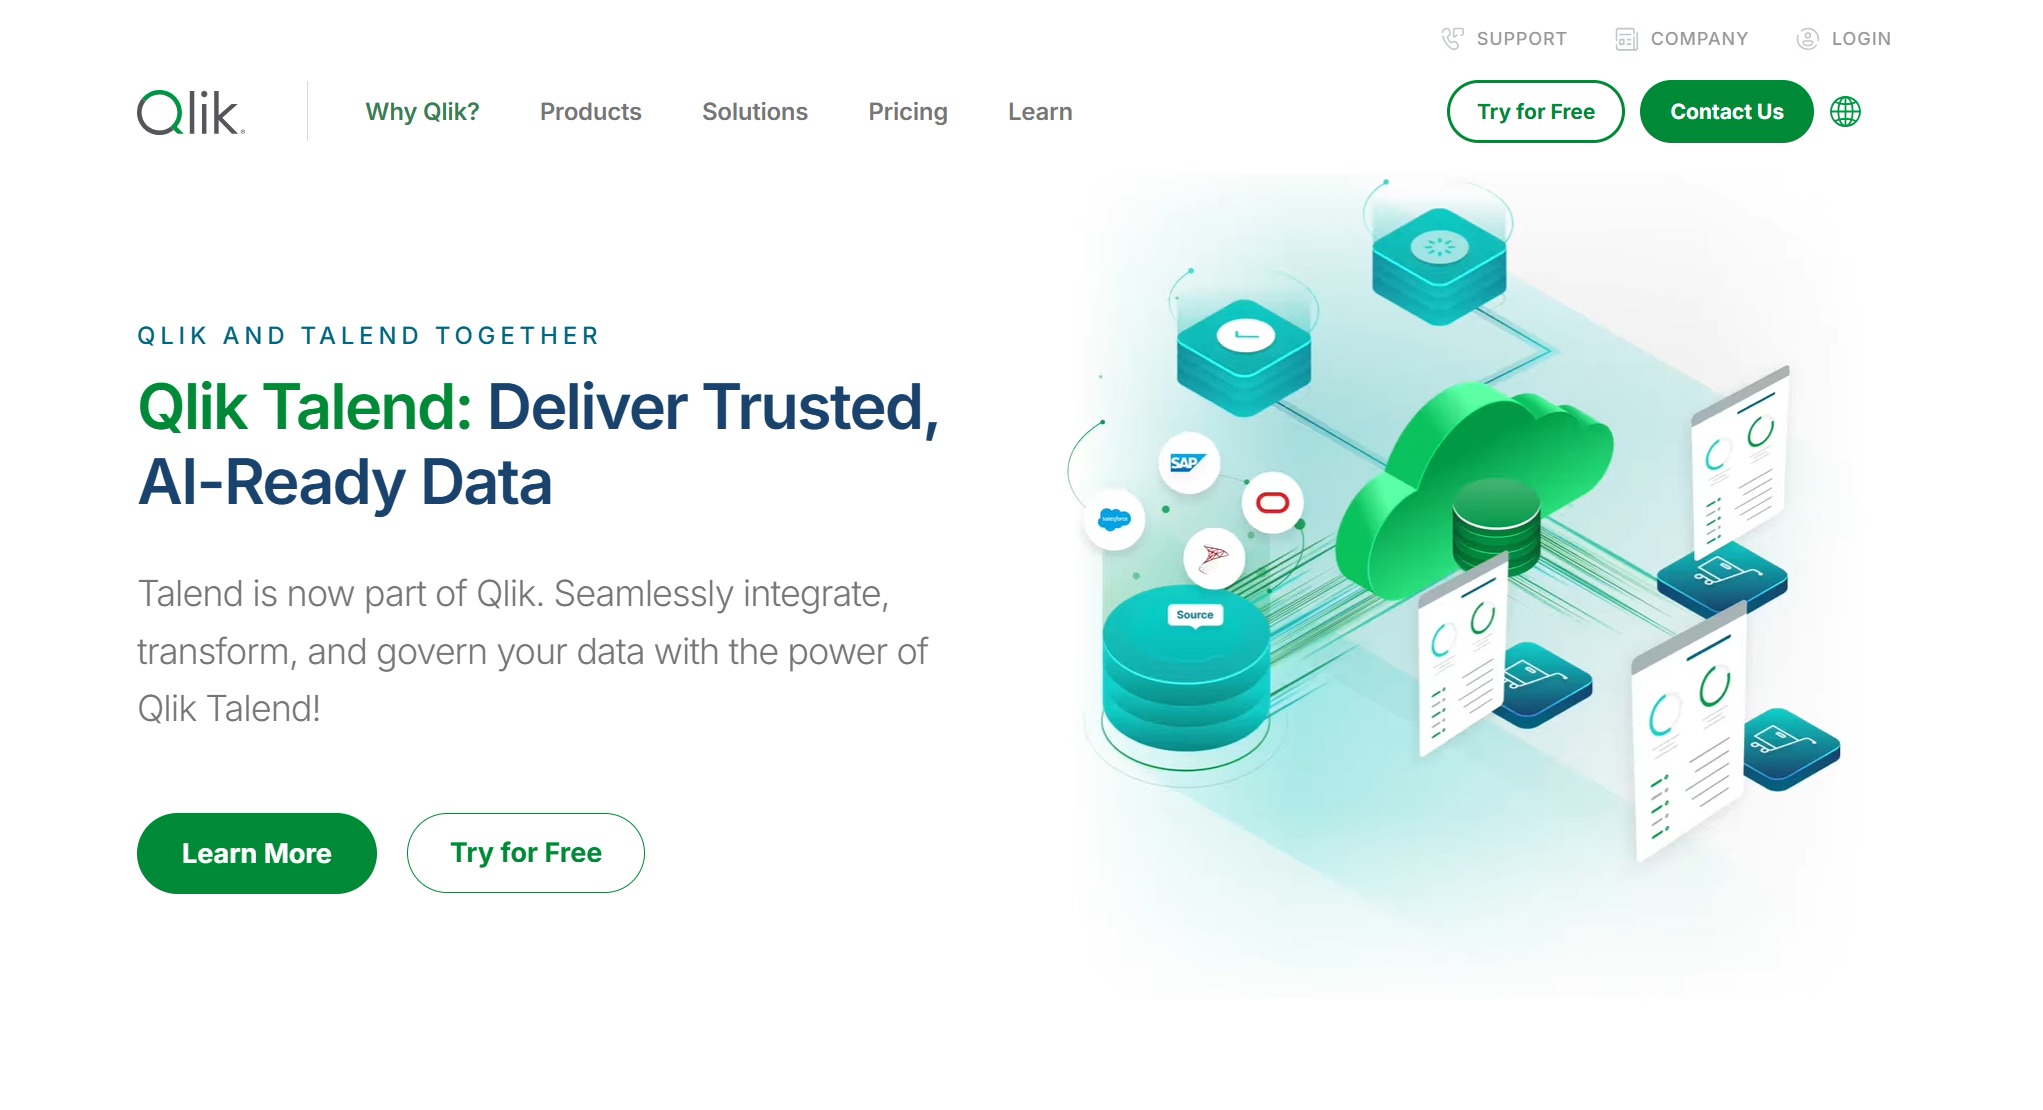
10.Talend: Data Integration and Transformation
Managing and transforming data effectively
Talend stands out as a powerful tool for managing and transforming data across diverse systems. You can use it to connect, clean, and organize data from multiple sources, ensuring seamless workflows. With over 800 connectors, Talend enables you to integrate data from databases, cloud platforms, and even legacy systems. This flexibility allows you to overcome the challenges of fragmented data environments.
One of Talend’s key strengths lies in its ability to maintain data quality throughout the integration process. The platform automatically identifies and resolves issues, ensuring that your data remains accurate and reliable. This feature is especially valuable for organizations handling sensitive information, such as healthcare or finance. Additionally, Talend accelerates the development and deployment of data pipelines. You can build and implement these pipelines quickly, saving time and resources.
While Talend excels in data integration, tools like FineBI and FineReport offer complementary capabilities. FineBI focuses on self-service analytics, allowing you to explore and analyze data independently. Its intuitive interface and real-time insights make it ideal for business users. On the other hand, FineReport specializes in advanced data visualization, providing over 60 chart types and dynamic 3D visualizations. Together, these tools create a comprehensive solution for data analysis and visualization, going beyond what Talend offers in terms of user accessibility and storytelling.
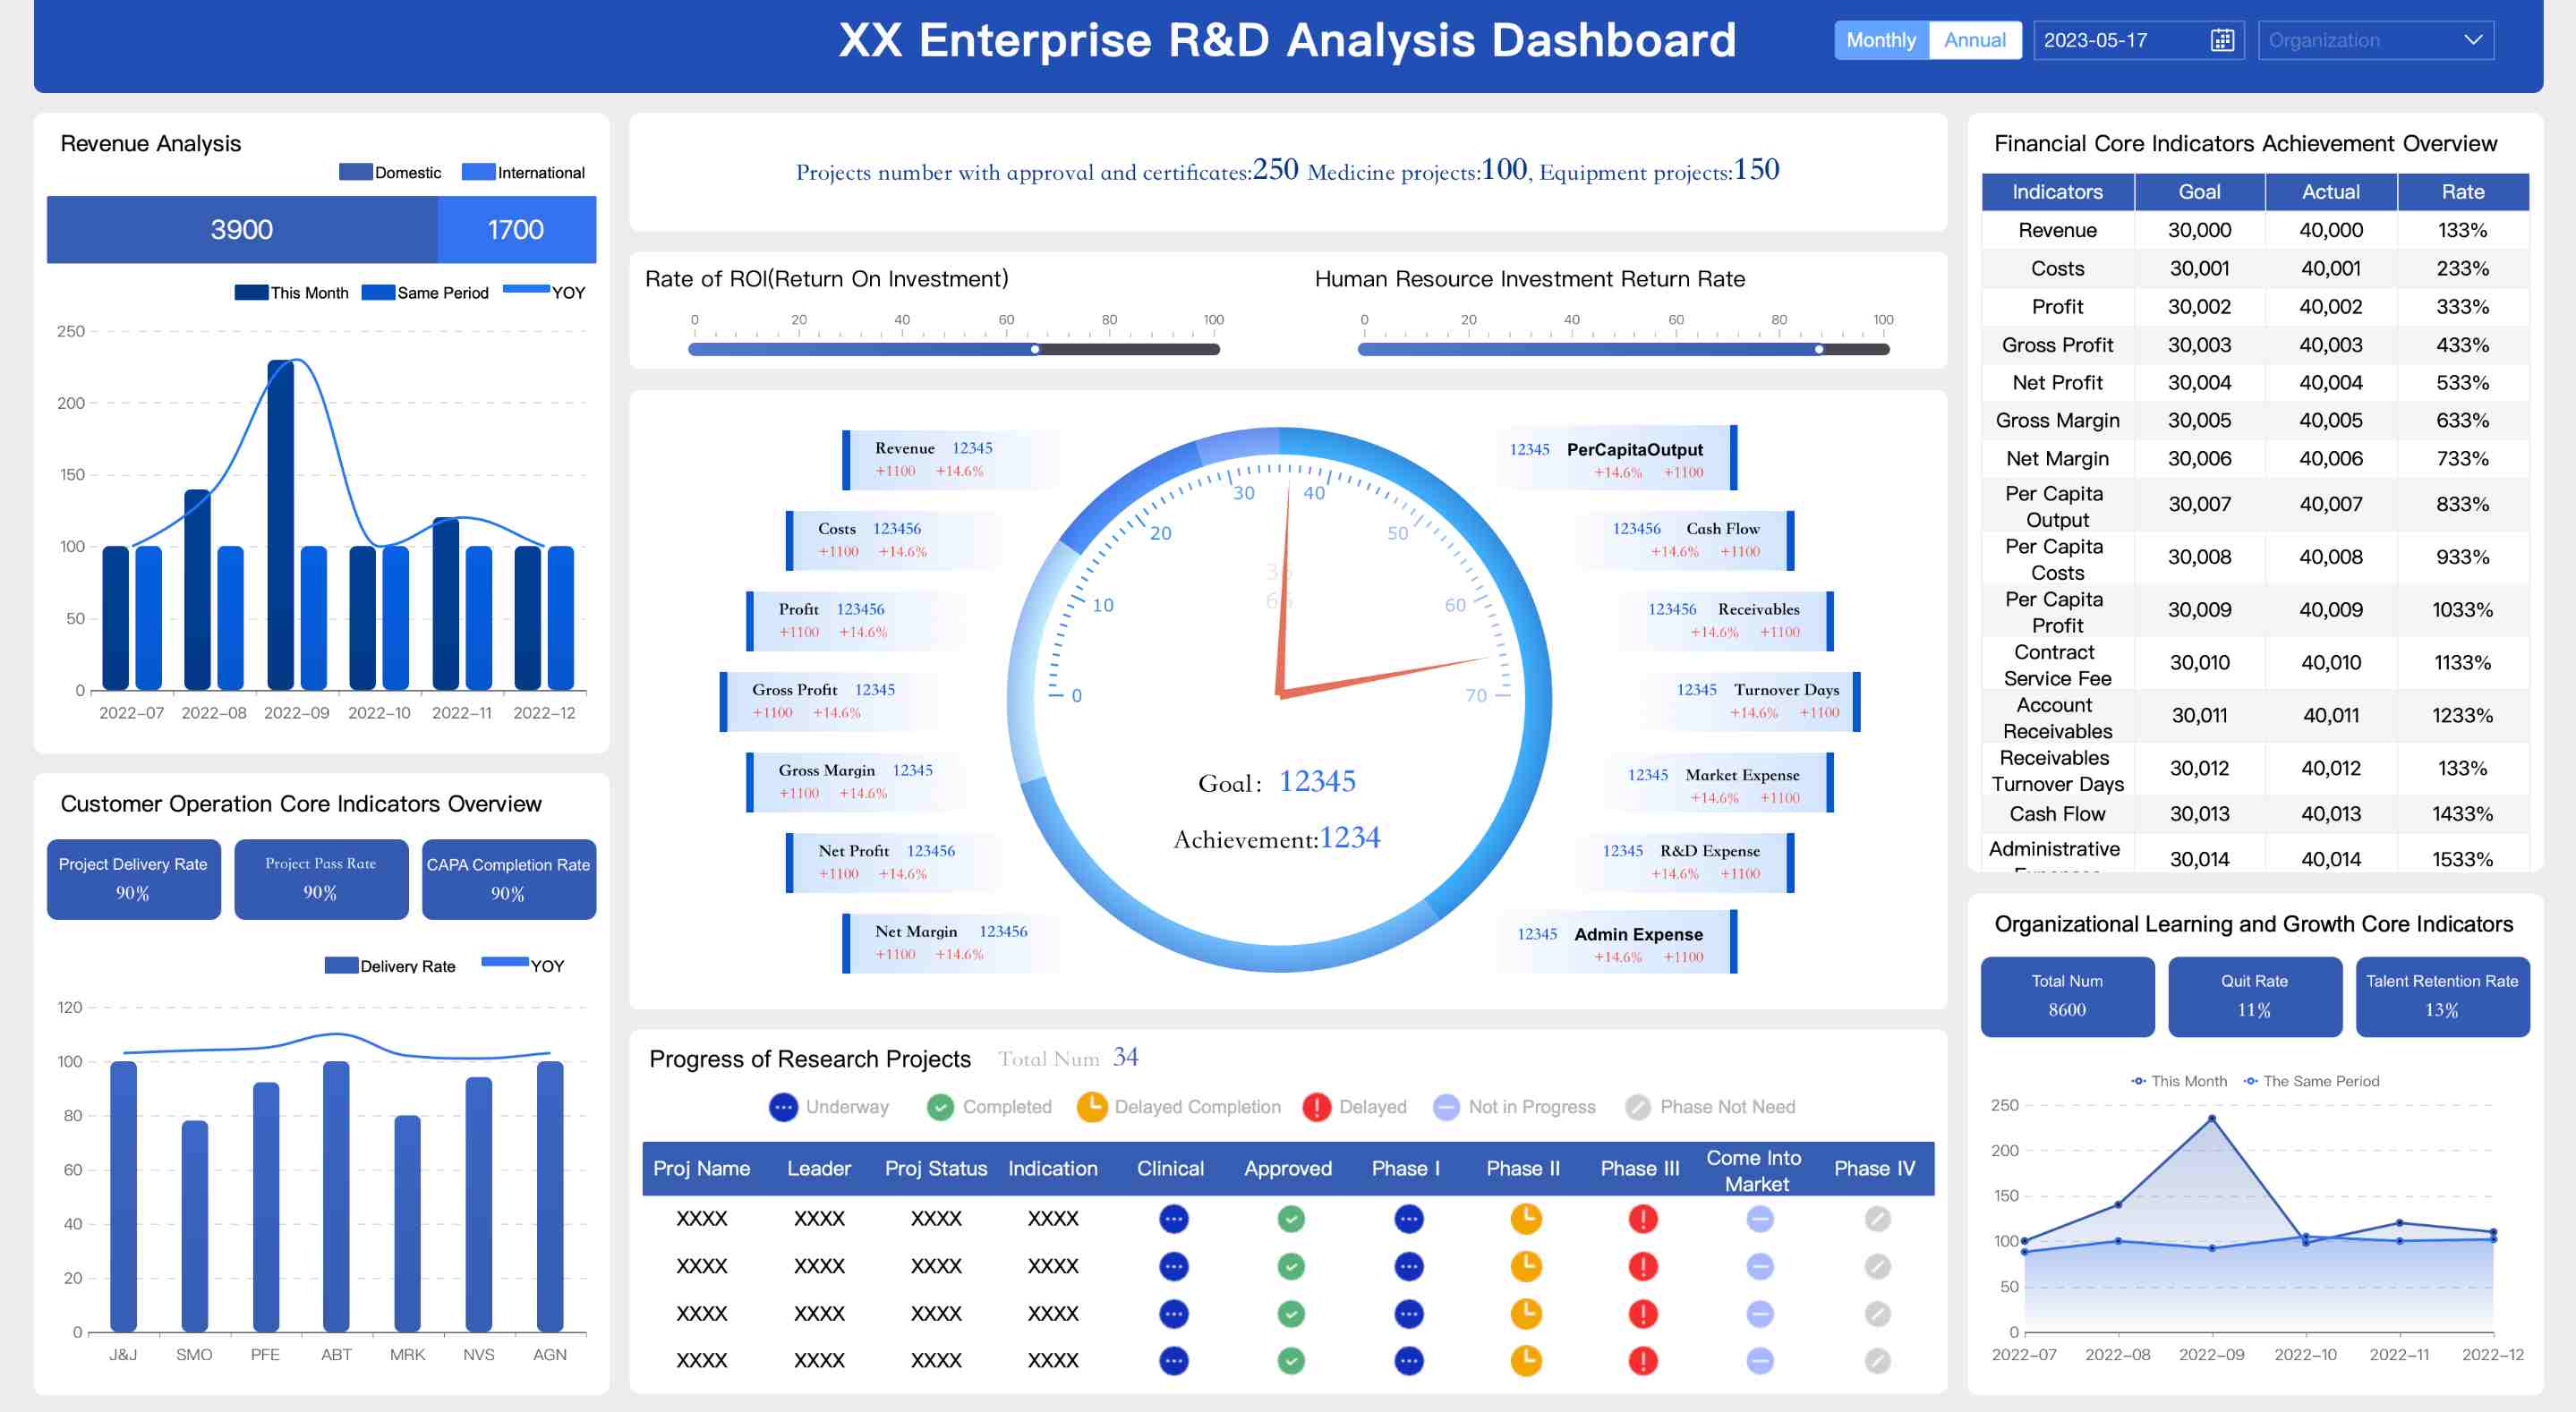
Enterprise R&D Analysis Dashboard Created By FineReport
Use cases in data quality and governance
Talend plays a crucial role in ensuring data quality and data governance. You can use it to standardize data formats, remove duplicates, and validate entries, creating a consistent and trustworthy dataset. This capability is essential for industries that rely on accurate reporting, such as retail and manufacturing. For example, a retail company can use Talend to consolidate customer data from various channels, ensuring a unified view of customer behavior.
In addition to improving data quality, Talend supports robust data governance practices. The platform provides tools for tracking data lineage, ensuring compliance with regulations like GDPR. You can monitor how data flows through your organization, identifying potential risks and maintaining transparency.
However, if your focus extends to analyzing and visualizing this governed data, FineBI and FineReport offer unmatched advantages. FineBI’s OLAP analysis capabilities allow you to drill down into datasets, uncovering trends and insights. FineReport enhances this by transforming raw data into compelling visual stories, making it easier to communicate findings to stakeholders. Unlike Talend, which emphasizes backend processes, FineBI and FineReport empower you to derive actionable insights and present them effectively.
Tip: When choosing tools for your data strategy, consider combining Talend’s integration capabilities with FineBI and FineReport. This combination ensures high-quality data and enables you to unlock its full potential through advanced analytics and visualization.
How to Choose the Right Data Analysis Tools
Assessing Your Needs
Industry-specific requirements
Every industry has unique data needs, and understanding these is crucial when selecting a data analysis tool. For example, healthcare professionals often require tools that can handle sensitive patient data securely, while manufacturers may prioritize tools with real-time analytics for monitoring production lines. To assess your industry-specific requirements, consider the following:
Personalization Strategies: Use customer data to create tailored experiences that boost satisfaction and loyalty.
Customer Segmentation: Group customers by demographics or behavior to design targeted strategies.
Criteria for Choosing Tools: Evaluate factors like data type, analysis needs, user expertise, integration capabilities, and scalability.
FineBI and FineReport cater to diverse industries with their specialized features. FineBI excels in self-service analytics, making it ideal for industries requiring quick insights without heavy IT involvement. FineReport, on the other hand, offers advanced visualizations, making it perfect for sectors like manufacturing and healthcare that rely on dynamic storytelling.
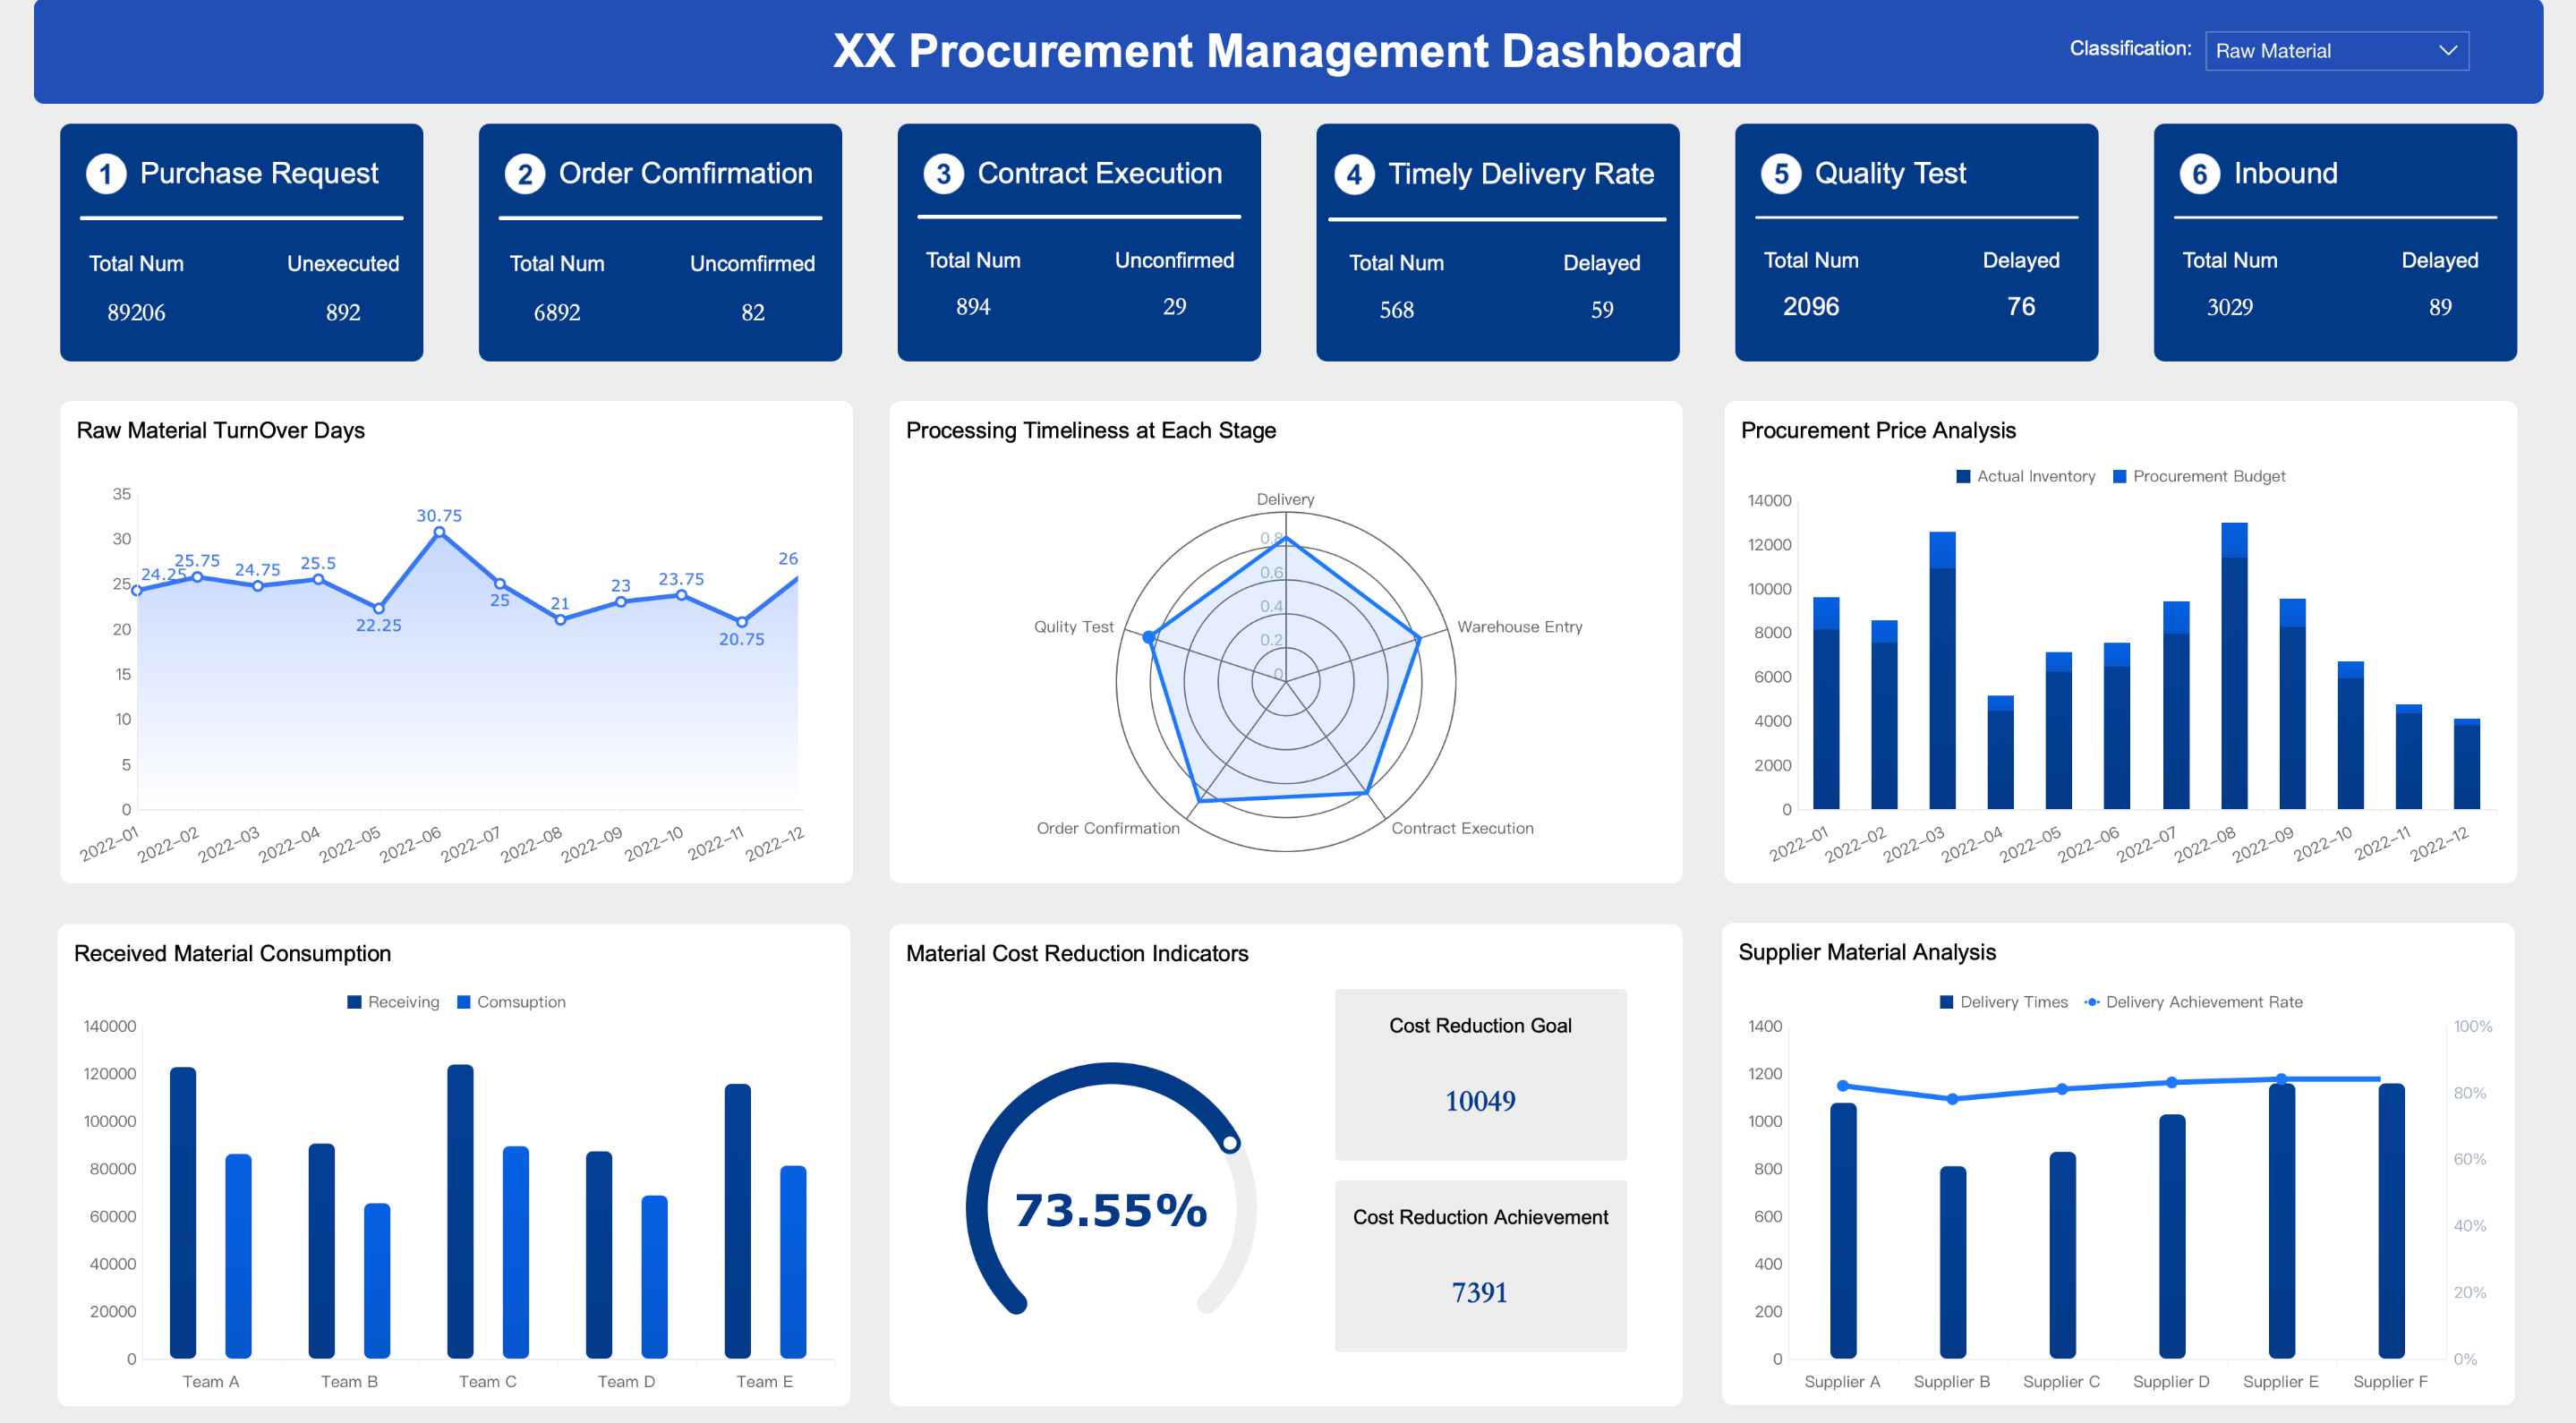
Procurement Management Dashboard Created By FineReport
Team size and skill level
Your team’s size and technical expertise significantly influence your choice of tools. Smaller teams with limited technical skills benefit from user-friendly platforms like FineBI, which features a drag-and-drop interface and intuitive workflows. Larger teams with advanced skills may prefer tools like Python for its flexibility and extensive libraries. FineReport bridges the gap by offering zero-code development, enabling users of all levels to create professional dashboards effortlessly.
Budget Considerations
Free vs. premium tools
When comparing free and premium tools, it’s essential to weigh their features against your needs. Free tools like Google Data Studio provide basic functionalities but lack advanced features like real-time analytics and customizable dashboards. Premium tools, such as FineBI, offer comprehensive capabilities, including real-time insights and enterprise-level data permission control.
Feature
Free Tools
Premium Tools
Automation
Limited
Advanced automation capabilities
Integration Capabilities
Basic
Extensive integration options
Real-time Data Analytics
Not available
Available
Customizable Dashboards
Limited
Highly customizable
Decision-making Support
Basic insights
Enhanced insights and support
FineBI and FineReport stand out among premium tools. FineBI enhances productivity by over 50% with its real-time data synchronization and OLAP analysis. FineReport complements this by offering over 60 chart types and dynamic 3D visualizations, making it a cost-effective choice for scalable digital transformation.
Long-term cost implications
Investing in premium tools often yields better long-term returns. Tools like FineBI reduce reliance on IT teams, saving time and resources. FineReport’s zero-code interface minimizes development costs, making it a sustainable option for businesses aiming to scale. While free tools may seem economical initially, their limitations can lead to higher costs in customization and maintenance over time.
Scalability and Future-Proofing
Adapting to growing data volumes
As your organization grows, so does your data. Tools like FineBI, with its high-performance computing engine, can process massive datasets and support over 10,000 users simultaneously. This scalability ensures that your analytics platform remains efficient as your data needs expand. Research by IDC predicts that by 2025, enterprises will see a 50% productivity increase due to improved data integration and interoperability.
Ensuring compatibility with future technologies
Future-proofing your data analysis tools is essential in a rapidly evolving digital landscape. FineBI and FineReport excel in this area with their robust integration capabilities. FineBI supports over 100 data sources, including big data platforms like Hadoop, ensuring compatibility with emerging technologies. FineReport’s adaptive design and real-time analytics make it a forward-thinking choice for industries embracing data-driven decision-making.
Regional Sales Management Dashboard Created By FineReport
Tip: Choose tools that not only meet your current needs but also adapt to future challenges. FineBI and FineReport offer the scalability and flexibility required for a scalable digital transformation.
Trial and Testing
Importance of free trials and demos
Free trials and demos give you a risk-free way to explore a tool’s features. They allow you to test the interface, functionality, and overall compatibility with your needs. Before committing to a data analysis tool, you should take advantage of these opportunities to ensure the tool aligns with your goals.
Many tools, including FineBI and FineReport, offer free trials to help you understand their capabilities. FineBI’s trial version lets you experience its self-service analytics and OLAP analysis firsthand. You can explore its drag-and-drop interface and test its real-time data synchronization. Similarly, FineReport provides a trial that showcases its advanced visualization features, including dynamic 3D charts and over 60 chart types. These trials help you see how these tools simplify complex data tasks.
Tip: Use the trial period to test specific scenarios relevant to your business. For example, if you work in manufacturing, try FineReport’s industry-specific dashboards to visualize production data.
Free trials also help you compare tools. For instance, Tableau offers advanced visualizations, but its steeper learning curve may slow you down. In contrast, FineReport’s zero-code interface makes it easier to create dashboards quickly. By testing both, you can decide which tool fits your team’s skill level and workflow better.
Evaluating user experience and support
User experience plays a crucial role in your productivity. A tool with an intuitive interface saves you time and reduces frustration. During the trial, evaluate how easy it is to navigate the tool. FineBI excels in this area with its clear workflows and user-friendly design. Even users with limited technical skills can perform data analysis independently.
Support services are equally important. Reliable support ensures you can resolve issues quickly, minimizing downtime. FineBI and FineReport provide extensive documentation, tutorials, and responsive customer service. FineBI’s enterprise-level data permission control also adds a layer of security, making it a dependable choice for organizations handling sensitive data.
Note: Compare the support options of different tools. While Power BI offers community forums, FineBI provides personalized assistance, ensuring a smoother experience for enterprise users.
Testing the tool’s performance under real-world conditions is essential. For example, FineBI’s high-performance computing engine supports over 10,000 users simultaneously, making it ideal for large organizations. Use the trial to test how the tool handles your data volume and complexity.
Tip: Prioritize tools that offer both excellent user experience and robust support. FineBI and FineReport stand out in these areas, ensuring you get the most value from your investment.
Choosing the right data analysis tools can transform how you manage and interpret data. Each tool in the top 10 list offers unique strengths, from Python's versatility to FineBI's self-service analytics and FineReport's advanced visualizations. FineBI empowers you to uncover real-time insights and make data-driven decisions independently, while FineReport excels in creating dynamic visual stories tailored to specific industries. Together, they enable data-driven operations and actionable data insights. By aligning your choice with your needs, you can unlock the full potential of data analytics and drive meaningful outcomes.
Click the banner below to try FineReport for free and empower your enterprise to transform data into productivity!
Access a wealth of case studies, industry insights, and solution guides to accelerate digital transformation.
FAQ
What is the difference between FineBI and FineReport?
FineBI focuses on self-service analytics, enabling you to explore data independently and uncover real-time insights. FineReport specializes in advanced data visualization, offering over 60 chart types and dynamic 3D visualizations. Together, they provide a comprehensive solution for data analysis and storytelling.
Can FineBI handle large datasets?
Yes, FineBI’s high-performance computing engine processes massive datasets efficiently. It supports over 10,000 users simultaneously, making it ideal for enterprises with growing data needs.
Do I need coding skills to use FineReport?
No, FineReport features a zero-code, drag-and-drop interface. This design allows users of all technical levels to create professional dashboards and visualizations effortlessly.
How does FineBI compare to Power BI?
FineBI offers superior self-service analytics with real-time data synchronization and OLAP analysis. Unlike Power BI, FineBI provides enterprise-level data permission control, ensuring enhanced security for sensitive information.
Is FineReport suitable for specific industries?
Yes, FineReport provides industry-specific solutions. For example, it helps manufacturers visualize production data and healthcare professionals monitor patient data. Its adaptability makes it valuable across sectors like logistics and smart cities.
Does FineBI integrate with other tools?
FineBI integrates with over 100 data sources, including MySQL, Oracle, and Hadoop. Its API capabilities allow seamless data sharing between systems, making it compatible with diverse business environments.
What makes FineBI and FineReport cost-effective?
FineBI boosts productivity by over 50% with its real-time insights and self-service analytics. FineReport reduces development costs with its zero-code interface. Together, they deliver high ROI by saving time and empowering data-driven decisions.
Can I try FineBI or FineReport before purchasing?
Yes, both FineBI and FineReport offer free trials. These trials let you explore their features, such as OLAP analysis in FineBI and dynamic 3D visualizations in FineReport. Use this opportunity to test their compatibility with your business needs.