When you want your business to thrive, choosing the best automation reporting tool makes all the difference. An automation reporting tool helps you collect, organize, and visualize your data without hours of manual work. It lets you see what’s happening in your business in real time, so you can make decisions faster and with more confidence.
You’ll notice more companies moving away from old spreadsheets and manual reports. They now use tools that deliver instant insights and connect to all kinds of data sources. When you look for the right solution, you need to think about features, ease of use, and how well the tool connects with your data. Pricing, scalability, security, and customer support also matter. If you find a tool that checks all these boxes, you set your team up for success.

Choosing the best automation reporting tool can transform how you manage your business data and analytics. You have more options than ever, but not all reporting tools are created equal. Some focus on real-time dashboards, while others excel at integrating multiple data sources or providing customizable dashboards for different teams. Let’s walk through the top 10 automated reporting tools that stand out for their features, usability, and ability to deliver actionable insights.
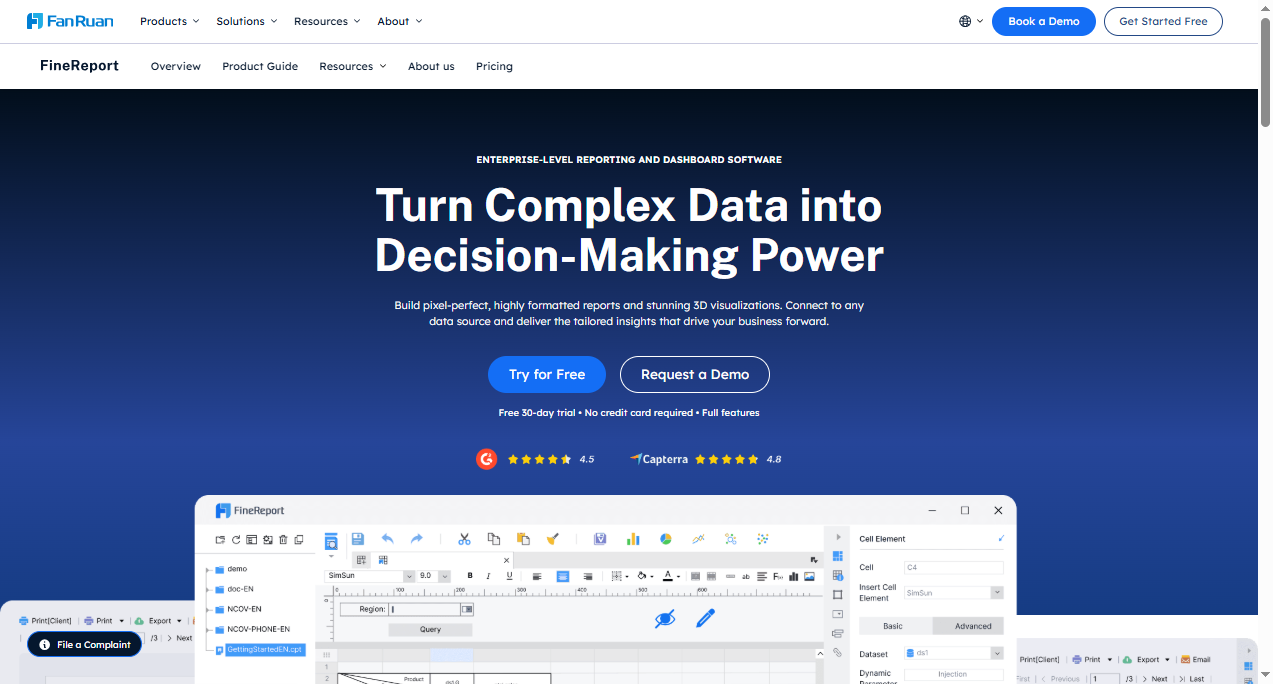
FineReport stands out as a leading automation reporting tool for enterprises that need robust reporting software and analytics. You can use FineReport to create complex reports with a user-friendly drag-and-drop interface. This reporting tool connects to a wide range of data sources, including databases and Excel files, making it easy to unify your business data. FineReport supports real-time dashboards, so you always have up-to-date analytics at your fingertips.
| Feature | FineReport Strengths |
|---|---|
| User Interface | User-friendly interface that simplifies the learning process. |
| Data Analysis | Enables businesses to analyze data, track indicators, and review performance. |
| Big Data Tech | Leverages big data technology for comprehensive business chain management. |
You can build interactive dashboards for real-time insights and automate report generation and distribution. FineReport’s multi-source data integration and customizable dashboards make it a top choice for businesses that want to streamline report automation and decision-making. If you need a reporting tool that scales with your business and supports both IT and business users, FineReport delivers.
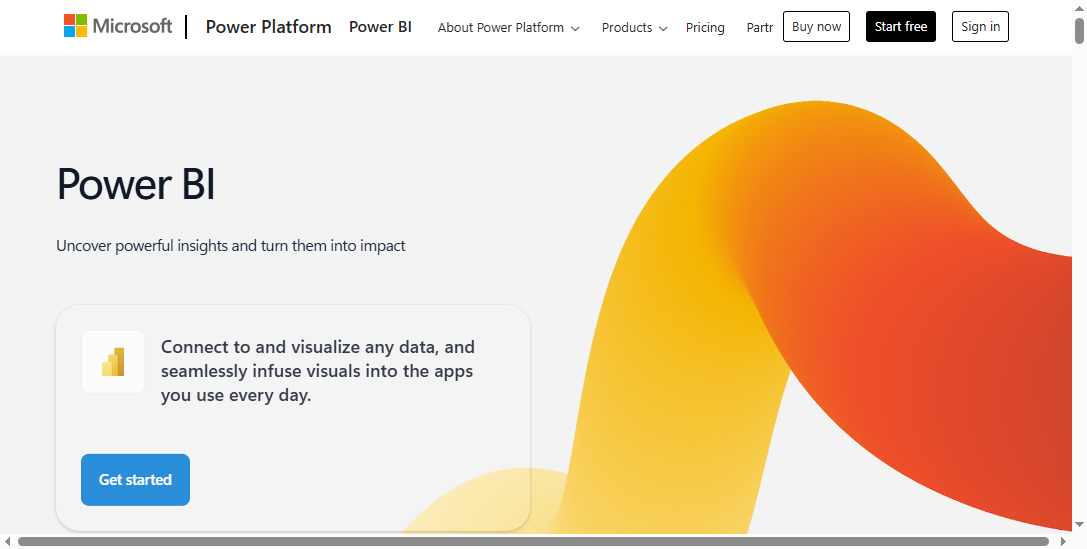
Power BI is a popular automation reporting tool from Microsoft. You can use it to turn raw data into interactive dashboards and reports. Power BI’s automation features help you avoid manual errors and boost productivity. The tool integrates with Power Automate, so you can trigger actions like sending emails based on dashboard insights.
| Feature | Description |
|---|---|
| Automation Capabilities | Power BI Automation helps bypass manual errors and boosts productivity in data analytics teams. |
| Integration with Power Automate | Enables proactive responses to data needs, such as triggering emails based on dashboard insights. |
| User-Friendly Interface | The intuitive, code-free UI allows both tech-savvy and novice users to create and share reports. |
| Data Visualization | Transforms raw data into interactive dashboards for better decision-making. |
Power BI is ideal for organizations that want to empower both technical and non-technical users to create, share, and automate reports. Its integration with other Microsoft business intelligence tools makes it a strong choice for companies already using Microsoft products.

Tableau is another top automation reporting tool known for its powerful data visualization and analytics. You can use Tableau to create real-time dashboards that provide immediate insights through live data streams. This helps you make faster decisions and improve operational efficiency.
Tableau’s drag-and-drop interface makes it easy to build customizable dashboards. If you want a reporting tool that supports advanced analytics and real-time data, Tableau is a great fit.
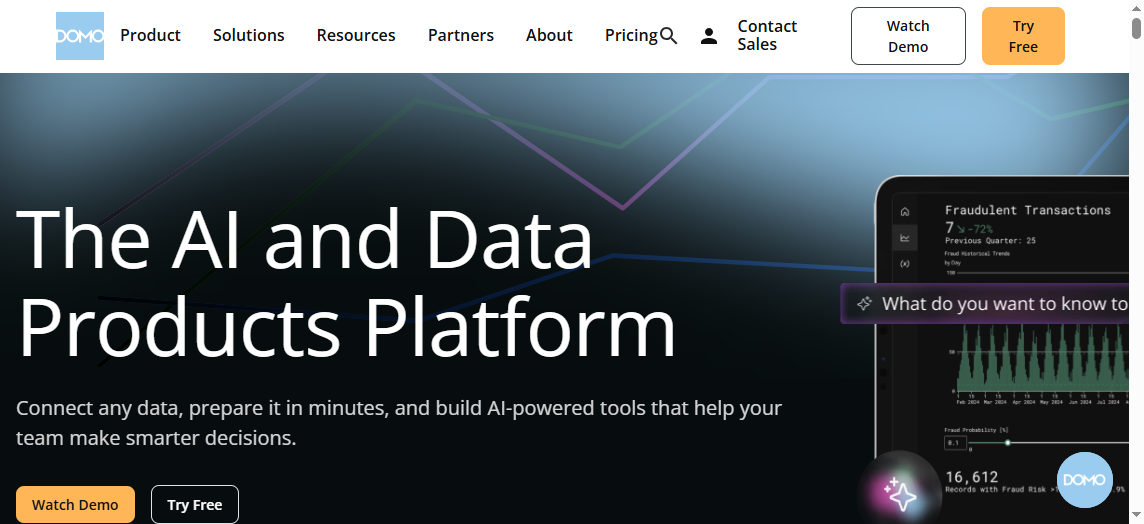
Domo is a cloud-based automation reporting tool that excels in visual dashboards, report scheduling, and real-time collaboration. Large organizations often choose Domo for its ability to automate reporting and analytics at scale.
| Advantage | Description |
|---|---|
| Increased accuracy and reliability | Automated reporting eliminates manual errors, ensuring data accuracy and reliability in reports. |
| Greater efficiency | Automation saves time by reducing the need for manual data collection and report generation. |
| Faster report creation | Reports can be generated quickly without waiting for manual input, providing timely information. |
| Better decision-making | Accurate reports lead to valuable insights, improving business decisions. |
| Improved compliance | Automated reporting helps maintain compliance with industry regulations and standards. |
| Enhanced customer satisfaction | Accurate and timely reports improve customer service and retention. |
Domo is perfect for businesses that need to automate complex reporting workflows and want to ensure data accuracy and compliance.

Looker Studio is a free automation reporting tool that connects with over 800 data sources. You can create customizable dashboards and automate report delivery with ease. Looker Studio integrates seamlessly with business operations and third-party systems, making data accessible for all stakeholders.
| Source | Integration Features |
|---|---|
| Exomindset | Looker Studio integrates seamlessly with business operations and third-party systems, enabling data accessibility for stakeholders. |
Looker Studio is available at no cost and features a low learning curve, making it accessible for users while still allowing for the creation of highly customizable reports.
Seamlessly integrate Shopify orders, customer events, and multi-platform attribution data into Google Looker Studio for comprehensive reporting.
If you want a reporting tool that is easy to use and connects to almost any data source, Looker Studio is a strong contender.
Klipfolio is a favorite among small and medium-sized businesses looking for an automation reporting tool that is easy to use and cost-effective. You can connect Klipfolio to over a hundred services, manage data, and build dashboards without complex configurations.
| Feature | Benefit for Small and Medium-sized Businesses |
|---|---|
| Comprehensive integration | Connects with over a hundred services, simplifying data management and analysis. |
| Real-time data and automation | Provides live data updates, allowing immediate visibility of business actions' impacts. |
| User-friendly customization | No-code interface enables easy dashboard customization. |
| Cost-effectiveness | Freemium model allows exploration of basic functionalities without initial investment. |
| Scalable solutions | Adapts to various business sizes and needs, offering both simple and advanced analytics. |
| Valuable support resources | Offers tutorials and a responsive support team. |
Klipfolio’s real-time dashboards and automation features help you see the impact of your business actions right away. Its freemium model lets you try out basic features before committing.
Qlik Sense is a powerful automation reporting tool that enables multi-source data integration for automated reporting. You can connect to firewalled data sources, store loaded data in the cloud, and access it from analytics apps.
| Step | Description |
|---|---|
| 1 | The source tenant connects to a firewalled data source via a data gateway. |
| 2 | The source tenant stores the loaded data into cloud file storage, making it accessible to customer tenants. |
| 3 | Customer tenants load data from the cloud file storage into analytics apps. |
| Upsides | A single tenant connects to the data source, allowing more control over sensitive data. Each tenant remains a unique isolated instance. Data can be loaded using Qlik Cloud products. |
| Considerations | A virtual machine per gateway type is required. Additional gateways may be needed for higher throughput. This pattern is not recommended for end-customer managed data sources. |
Qlik Sense is ideal for organizations that need secure, scalable, and automated reporting tools with advanced analytics.
Zoho Analytics is a self-service automation reporting tool that supports business intelligence and analytics for all types of users. You can use AI-powered features like 'Ask Zia' for natural language queries and build no-code machine learning models.
| Feature | Description |
|---|---|
| AI Integration | The platform incorporates AI throughout, enhancing user interaction with features like 'Ask Zia' for natural language queries. |
| Data Science Studio | Offers no-code machine learning model creation, empowering business users without data science training. |
| Enhanced Data Management | Over 500 data connectors and ETL tools streamline data integration, providing a unified source of truth for metrics. |
Zoho Analytics is perfect for teams that want to manage data, automate reporting, and leverage AI for deeper analytics.
DashThis is a go-to automation reporting tool for marketing teams that want to simplify dashboard creation. You can link your digital marketing tools, pull data in real-time, and create dashboards quickly without manual data entry.
With DashThis, you can clone dashboards for different clients, making it easy to scale your reporting efforts.
Supermetrics is an automation reporting tool designed for marketing and analytics teams that need to streamline data from multiple sources. You can automate data refreshes, build customizable dashboards, and access a wide range of data connectors.
Supermetrics helps you cut down on manual data consolidation and quickly access customer lifecycle reporting dashboards. It’s a great fit for businesses that want to automate reporting across multiple platforms and make data-driven decisions faster.
When you look for the best automation reporting tool, consider your business needs, the types of data you handle, and the level of automation you require. Each of these reporting tools offers unique strengths, from real-time dashboards to advanced analytics and seamless data integration. By choosing the right reporting software, you set your business up for smarter decision-making and better insights.

When you hear about reporting tools, you might think of software that helps you turn raw data into clear, useful information. These tools let you collect, organize, and present data in a way that makes sense for your business. Automated reporting tools take this a step further. They simplify the process of gathering, analyzing, and presenting data in a report format. You can make quicker, smarter decisions because you spend less time on manual work.
Reporting tools do more than just create reports. They connect to different data sources, handle large data sets, and let you customize how your information looks. You can schedule reports to run automatically, share them with your team, and export data in different formats. Many tools also let you build dashboards for a quick view of your key metrics. Interactive visualizations help you dig deeper into your analytics, while central data storage keeps everything organized.
| Core Function | Description |
|---|---|
| Data Source Connectivity | Connect to various data sources for complete access. |
| Handling Large Data Sets | Manage big volumes of data without slowing down. |
| Flexible Reporting Options | Customize reports to fit your needs. |
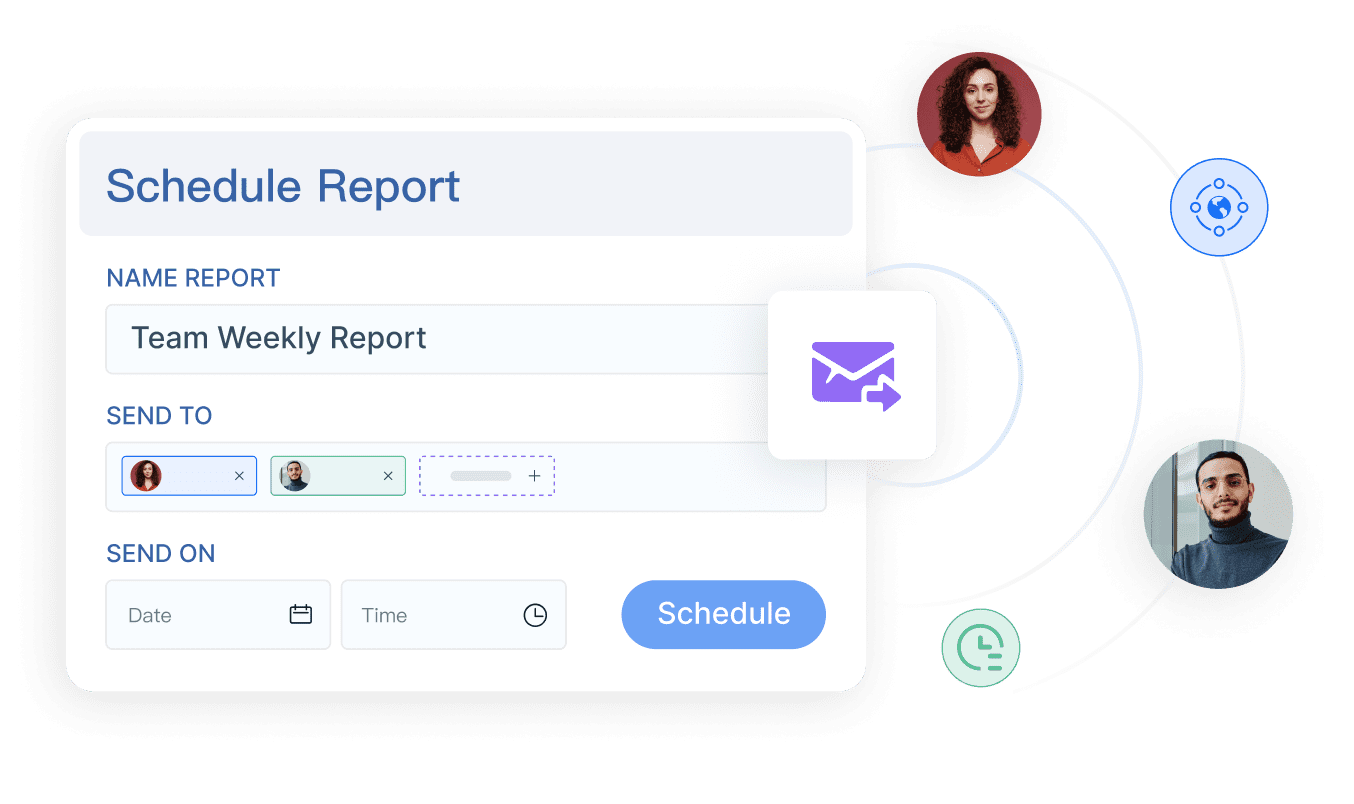
| Scheduling Reports | Set up automatic report generation for up-to-date information. |
| Sharing Reports | Share reports easily with your team. |
| Data Export Options | Export data in different formats for more analysis. |
| Custom Report Creation | Build reports tailored to your business. |
| Dashboard Creation | Make dashboards for quick data visualization. |
| Interactive Visualizations | Use filters and drill-downs for deeper analytics. |
| Central Data Storage | Keep all your data in one place for easy reporting. |
You have several types of automated reporting tools to choose from, each with its own strengths. Some focus on dashboards, giving you a visual overview of your analytics and key performance indicators. Others work as data entry or reporting platforms, helping you collect and manage information efficiently. Self-service BI tools let you create your own reports and dashboards without waiting for IT support.
| Type of Reporting Tool | Description |
|---|---|
| Static Reporting Tools | Generate pre-defined reports on a regular schedule. |
| Dynamic Reporting Tools | Let you create custom reports and explore data interactively. |
| Dashboarding Tools | Provide a visual overview of key metrics and performance. |
| Self-Service Reporting Tools | Empower you to build reports and dashboards on your own. |
With the right reporting tools, you can turn your data into actionable insights. You get to see the big picture and dive into the details, all while saving time and reducing manual effort. Whether you need scheduled reports, interactive dashboards, or advanced analytics, there’s a solution that fits your workflow.
When you use FineReport as your automation reporting tool, you get a set of features that make reporting and dashboards easy for everyone. You can create reports with a drag-and-drop designer, which means you don’t need to write code. FineReport supports both basic and advanced chart types, so you can show your data in the way that works best for your business. The tool also offers dynamic effects and interactive dashboards, helping you engage with your data and uncover new insights.
Here’s a quick look at what sets FineReport apart:
| Feature | Description |
|---|---|
| Enterprise-level analytics | Designed for large-scale business analytics |
| Interactive dashboards | Lets you explore data visually and interactively |
| Chart types | Includes both basic and advanced options |
| Dynamic effects | Adds animation for better engagement |
| Mobile-friendly displays | Optimized for phones and tablets |
You can access your dashboards and reports from any device, so you always stay connected to your data.

Data integration is a must-have for any automation reporting tool. FineReport connects to multiple data sources, including databases, Excel files, and cloud platforms. This means you can bring all your business data together in one place. Other leading tools like Tableau, Domo, and Funnel also focus on multi-source data integration, but FineReport stands out for its user-friendly approach and flexibility.
With strong data integration, you avoid manual data entry and reduce errors in your reporting.
You want your automation reporting tool to deliver real-time insights. FineReport gives you interactive dashboards where you can drill down into metrics, apply filters, and segment your data. Reports refresh automatically, so you always see up-to-date numbers. You can share dashboards with your team, making collaboration simple.
Top reporting tools focus on features like:
| Feature | Description |
|---|---|
| Interactive dashboards | Explore and analyze data in real time |
| Automatic data refreshes | Keep your reports current without manual updates |
| Enhanced sharing | Let your team access and discuss insights together |
FineReport’s real-time dashboards and visualizations help you make faster decisions and improve your business performance. With these features, you get the most out of report automation and stay ahead in your industry.
You want to see how top automated reporting tools stack up. Here’s a quick table to help you compare features, pricing, and focus areas:
| Tool | Key Features | Pricing (Starting) | Best For |
|---|---|---|---|
| FineReport | Drag-and-drop, multi-source data, dashboards, enterprise deployment | Varies | Large enterprises, government, complex reporting |
| Power BI | Data visualization, automation, integration with Microsoft | $14/month | Small to large businesses |
| Tableau | Advanced analytics, real-time dashboards, custom reports | Contact Vendor | Data-driven teams, analytics pros |
| Qlik Sense | Social media analytics, funnel analysis, secure data integration | Contact Vendor | Mid to large enterprises |
| Zoho Analytics | AI-powered analytics, self-service, ETL tools | $48/month (5 users) | Small to medium businesses |
When you pick reporting tools, you want something easy to use and ready to grow with your business. FineReport gives you a user-friendly interface and supports both technical and non-technical users. You can scale up as your data grows. Power BI and Zoho Analytics also offer simple navigation and flexible dashboards. Qlik Sense stands out for handling large data volumes and secure integrations.
| Factor | Description |
|---|---|
| Ease of Use | Intuitive interfaces help you create reports and dashboards quickly. |
| Scalability | Tools like FineReport and Qlik Sense handle more data and users as your needs expand. |
| Integration | Seamless connections to your existing systems keep your reporting accurate and up to date. |
| Customization | Tailor dashboards and reports to fit your unique requirements. |
| Security | Protect your data with robust security features. |
Pricing for automated reporting tools varies a lot. FineReport offers flexible plans based on your needs. Power BI starts at $14 per month, making it accessible for many. Zoho Analytics starts at $48 per month for five users. Some tools, like Tableau and Qlik Sense, require you to contact the vendor for a quote. Always check what features you get for the price.
| Tool | Pricing Structure |
|---|---|
| FineReport | Varies significantly |
| Power BI | $14 Per month |
| Tableau | Contact Vendor |
| Qlik Sense | Contact Vendor |
| Zoho Analytics | $960 Per month |
You need to match your reporting software to your business goals. FineReport works best for large enterprises and government projects that need advanced report automation and dashboards. Power BI and Zoho Analytics fit small to medium businesses with flexible analytics. Looker Studio is a good choice if you want free, interactive dashboards. Qlik Sense is ideal for companies that need secure, scalable reporting and deep data insights.
FineReport helped SAMOA unify data, automate reporting, and build real-time dashboards for better decision-making. You can achieve the same results by choosing the right tool for your needs.
You want to make sure your automation reporting tool fits your business perfectly. Start by setting clear goals. Think about what you want to achieve with your reports and dashboards. Next, talk with your team and other stakeholders. They can help you spot knowledge gaps or workflow issues. Gather data from different sources to see where you stand. After that, create an action plan to address any gaps you find. Finally, put your plan into action and check if it works. This step-by-step approach helps you choose reporting software that matches your needs and supports your business intelligence goals.
Every industry has unique data needs. Some businesses need advanced analytics, while others focus on customizable dashboards or real-time insights. For example, agencies often look for template libraries, SaaS companies want predictive modeling, and enterprises need unified data management. The table below shows how different reporting tools fit specific industries:
| Tool | Industry Focus | Key Features |
|---|---|---|
| Swydo | Agencies | Industry templates, pain point solutions |
| Tableau | SaaS, E-commerce | Advanced analytics, predictive modeling |
| Domo | Enterprise | Unified data management, multi-stakeholder support |
When you pick an automation reporting tool, consider how easy it is to set up and what support options you get. FineReport offers flexible implementation, including free personal use and commercial plans for enterprise reporting tools. Many business intelligence tools provide both community and commercial support, so you can choose what fits your business best. FineReport also integrates with FineBI, giving you a complete solution for both automated reporting tools and self-service analytics. This combination helps you create reports, build dashboards, and uncover insights across your organization.
| Tool Name | Description | Implementation Options | Support Options |
|---|---|---|---|
| FineReport | Enterprise reporting and dashboards | Free for personal; commercial plans | Commercial support available |
| Jaspersoft BI | Analytics and report design platform | Community and Commercial Editions | Community and paid support |
| Metabase | Open-source analytics and dashboards | Cloud or on-premises | Community and paid support |
Tip: Look for reporting tools that offer strong support and easy integration with your existing data systems. This will make your transition smoother and help you get the most out of your reporting software.
Choosing the right reporting tools can transform your business. When you use automated solutions, you spot problems faster, adjust strategies quickly, and boost efficiency across teams.
When you have up-to-the-second data, you act confidently and drive growth with precision.
Before you decide, take time to review your data needs. Set clear goals, check data quality, and make sure decision-makers have access to the right information. FineReport stands out for its user-friendly design, flexibility, and rich charting features, making it a smart choice for enterprise reporting. Ready to take the next step? Explore your options or reach out for expert advice.

What Is a Quarterly Report and Why Investors Should Care
How to Use Inventory Report for Better Business Decisions
How to Build a Service Report Template for Your Business
What Is a Research Report and Why Does It Matter

The Author
Lewis
Senior Data Analyst at FanRuan
Related Articles

10 Custom Reporting Dashboard Tools Compared: Features, Limits, and Best-Fit Use Cases
Compare 10 custom reporting dashboard tools on features, limits, and best-fit use cases.
Lewis Chou
May 03, 2026

10 Best Dashboard Reporting Tools for 2026 Compared: Power BI, Tableau, Looker Studio, and More
Dashboard reporting tools are software platforms that turn business data into interactive dashboards, scheduled reports, and decision ready insights.
Lewis Chou
Apr 27, 2026
How to create an HTML report from scratch in 2026
Build an html report from scratch in 2026 with easy steps, tools, and tips for customization, sharing, and making your data clear and interactive.
Lewis Chou
Mar 23, 2026


