Here are the top 10 reporting systems and tools for businesses: Microsoft Power BI, Tableau, FineReport, Google Looker Studio, Qlik Sense, Zoho Analytics, Domo, Sisense, IBM Cognos Analytics, and Klips. Picking the right reporting system shapes how you use data to drive business intelligence and data-driven decision-making. Today’s reporting tools do more than just generate reports—they connect data from everywhere, automate reporting, and give you dashboards that make data easy to understand. Take a look at how these changes impact your business:
| Impact Area | Description |
|---|---|
| Data Accessibility | You get better access to data, so you can make decisions faster—even without IT help. |
| Integration with BI Tools | Seamless integration cuts reconciliation errors by 35%, so your data stays accurate. |
| Real-time Analysis | You see current data right away, which helps you respond quickly to market changes. |
| Predictive Analytics | AI and machine learning help you spot trends and risks, improving your planning. |
| Data-Driven Culture | Teams work together better, using shared data for smarter reporting and decisions. |
With the right reporting system, your business can unlock the full value of its data and make every reporting process count.
If you want to make smarter decisions, you need the top 10 reporting systems and tools for businesses. These enterprise reporting tools help you turn raw data into clear insights. They give you dashboards, automated reporting tools, and analytics that work in real-time. You can use these reporting tools to manage financial reporting software, automate your reporting, and keep your business running smoothly. The best reporting software connects to your data, builds dashboards, and supports analytics for every department.
When you look at the top 10 reporting systems and tools for businesses, you should focus on what matters most. Here’s a quick table showing the criteria you should consider:
| Criteria | Description |
|---|---|
| Open-source platform | Lets you customize and adapt the reporting software. |
| Flat pricing for enterprise version | No hidden fees, just clear costs for your reporting tools. |
| Real-time data processing | See your data and analytics instantly. |
| Customizable dashboards | Build dashboards that fit your needs. |
| User-friendliness | Easy to use, even for beginners. |
| Security and compliance | Keeps your data safe and meets regulations. |
| Scalability | Grows with your business and data. |
| Integration capabilities | Connects with other business tools and apps. |
| Customer support | Get help when you need it. |
Let’s dive into each of the top 10 reporting systems and tools for businesses You’ll see what makes each reporting software unique, how they handle data, and why they stand out as enterprise reporting tools.
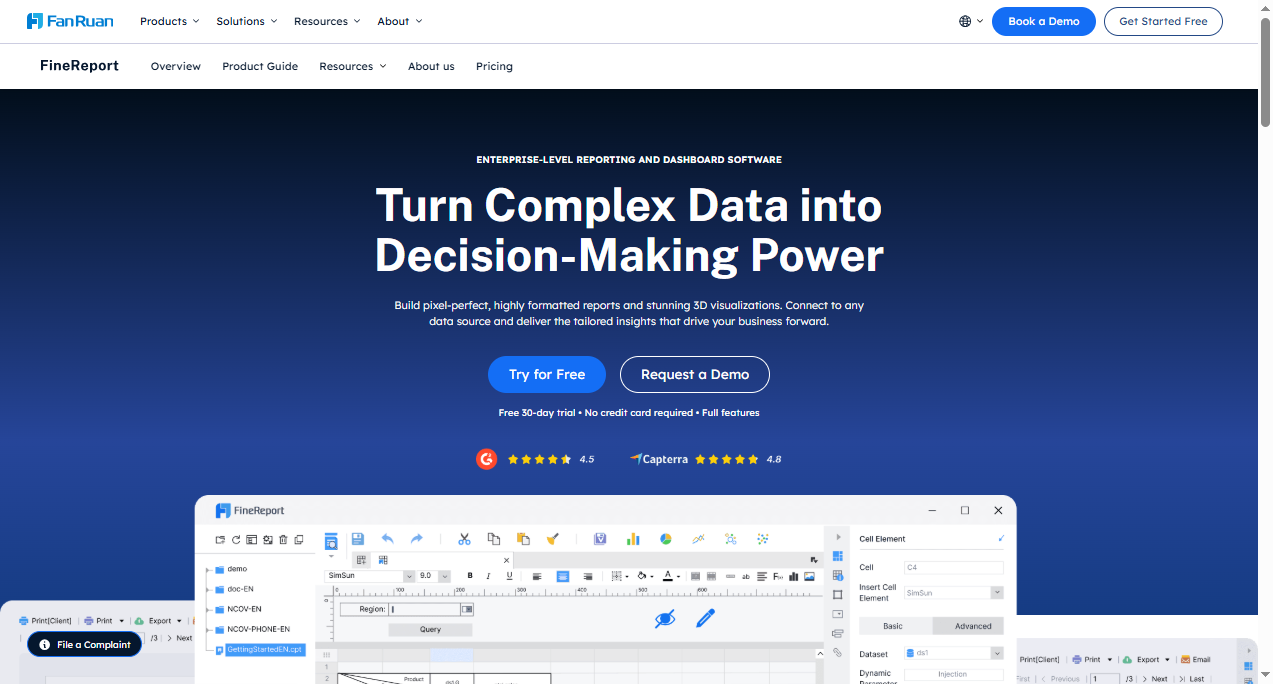
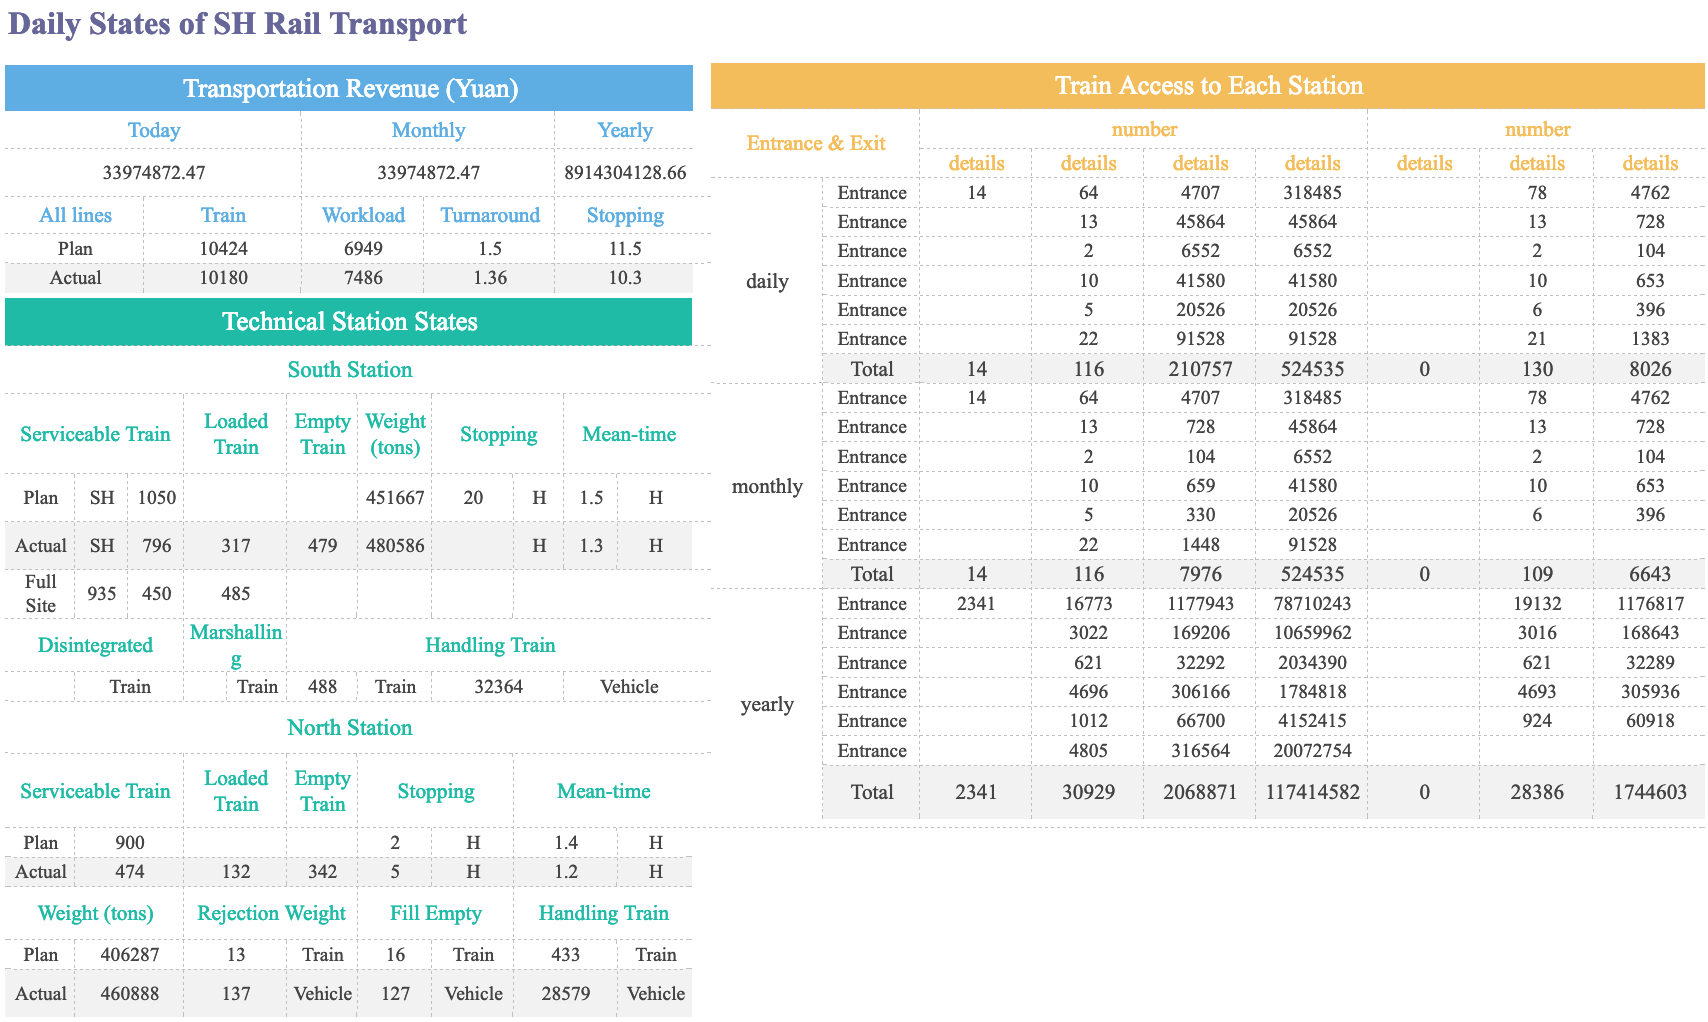
FineReport is a top choice for businesses that need flexible enterprise reporting tools. You can use FineReport to connect to almost any data source, automate reporting, and build dashboards that work on any device. FineReport stands out for its real-time data integration, automated reporting tools, and mobile access.
You get a drag-and-drop designer that feels like Excel, so you can create complex reports and dashboards without coding. FineReport supports financial reporting software needs with pixel-perfect formatting and advanced analytics. You can automate scheduled reports, manage permissions, and use data entry forms to collect and update data directly in your database.
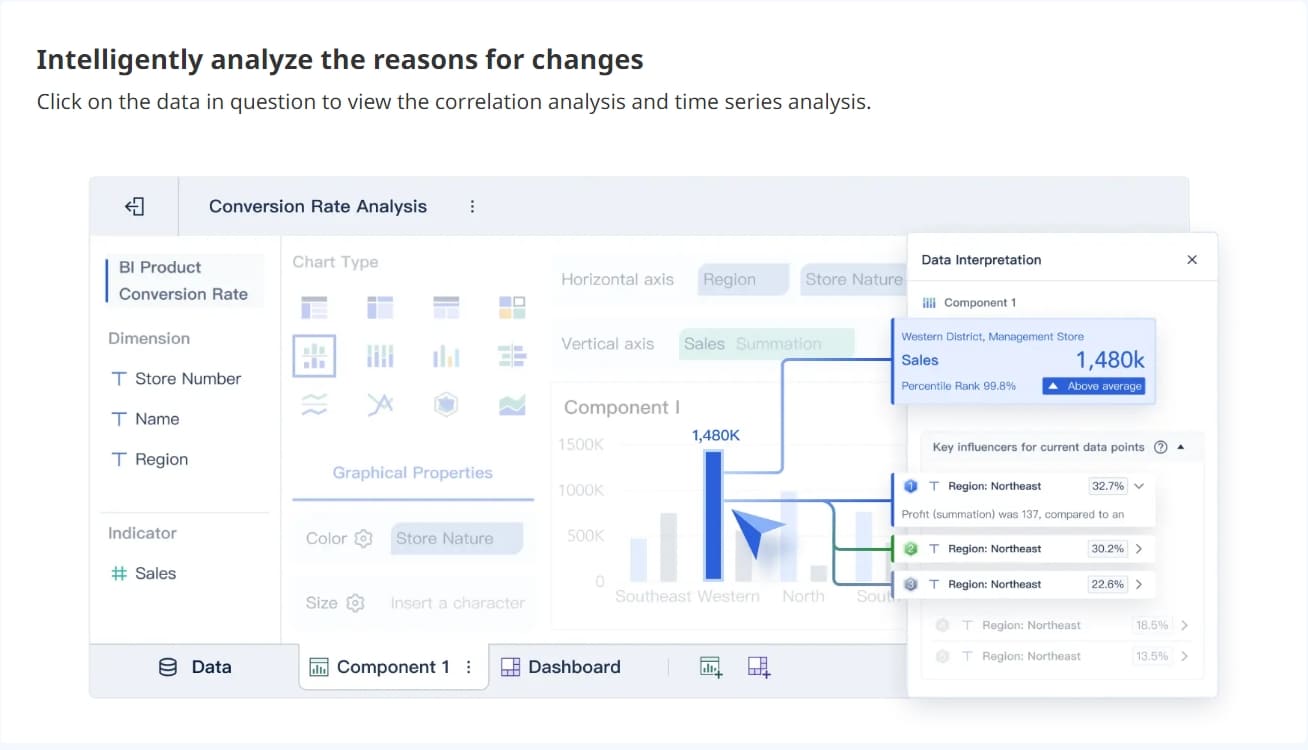
FineReport’s dashboards are fully customizable. You can build 2D and 3D dashboards, monitor KPIs, and drill down into your data for deeper insights. The reporting software supports real-time analytics, so you always see the latest numbers. FineReport also offers a decision-making platform that centralizes all your reports, dashboards, and user management in one place.
If you want to empower your teams, FineReport’s automated reporting tools and mobile dashboards let you access data anywhere. You can scale FineReport as your business grows, making it a reliable choice for enterprise reporting tools and analytics.
Microsoft Power BI stands out as one of the most popular reporting tools for businesses. You get powerful dashboards, real-time analytics, and automated reporting tools that connect to almost any data source. Power BI is a favorite for financial reporting software because it handles large data sets and offers deep analytics.
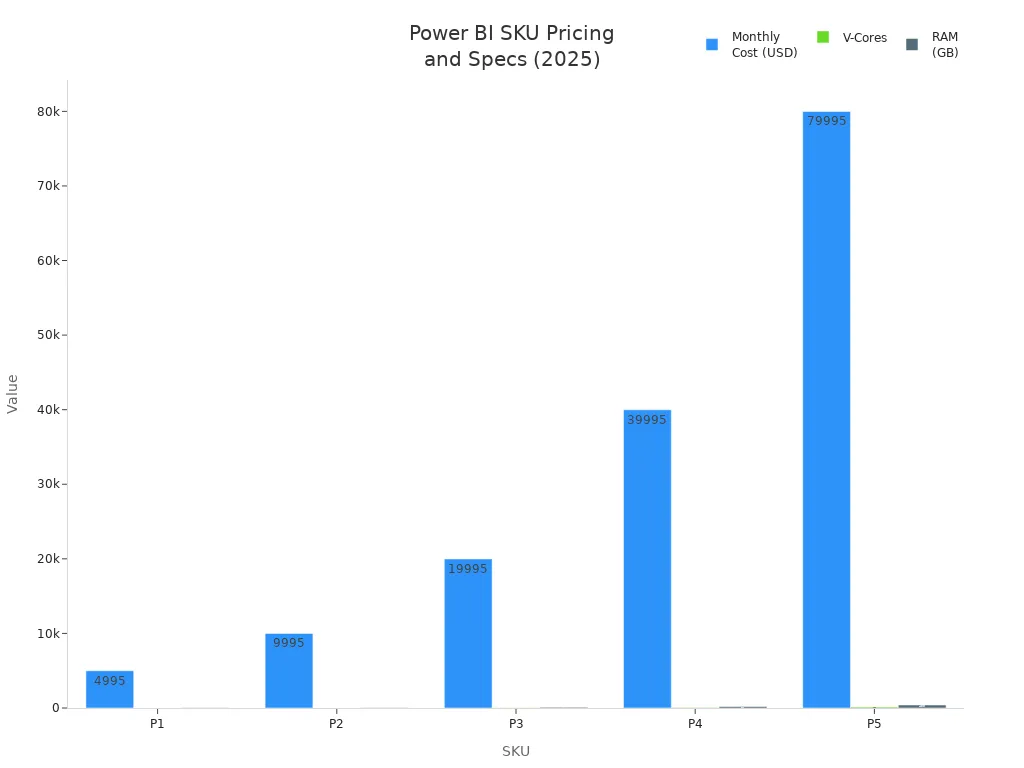
| SKU | Monthly Cost | V-Cores | RAM | Best For |
|---|---|---|---|---|
| P1 | $4,995 | 8 | 25GB | 250-500 users |
| P2 | $9,995 | 16 | 50GB | 500-1,000 users |
| P3 | $19,995 | 32 | 100GB | 1,000-2,000 users |
| P4 | $39,995 | 64 | 200GB | 2,000+ users |
| P5 | $79,995 | 128 | 400GB | 5,000+ users |
You can use Power BI for automated reporting tools, but you may run into some limits. The free tier does not support scheduling, and you need to refresh data manually. Some users find the DAX calculations and data modeling hard to learn. If you work with very large data sets, you might notice performance issues. Still, Power BI remains a top choice for reporting software and analytics.

Tableau is another leader among enterprise reporting tools. You can create interactive dashboards, use real-time analytics, and connect to many data sources. Tableau is known for its visual reporting tools and strong analytics features.
| Plan | Price (Billed annually) | What you get |
|---|---|---|
| Creator | $75/user/month | Full access (including Tableau Prep) |
| Explorer | $42/user/month | Edit and interact with dashboards |
| Viewer | $15/user/month | View and interact only |
| Embedded BI | Custom pricing | Includes Pulse, AI, embedded features |
| AI Pulse | Part of enterprise plans | Not included in base plans |
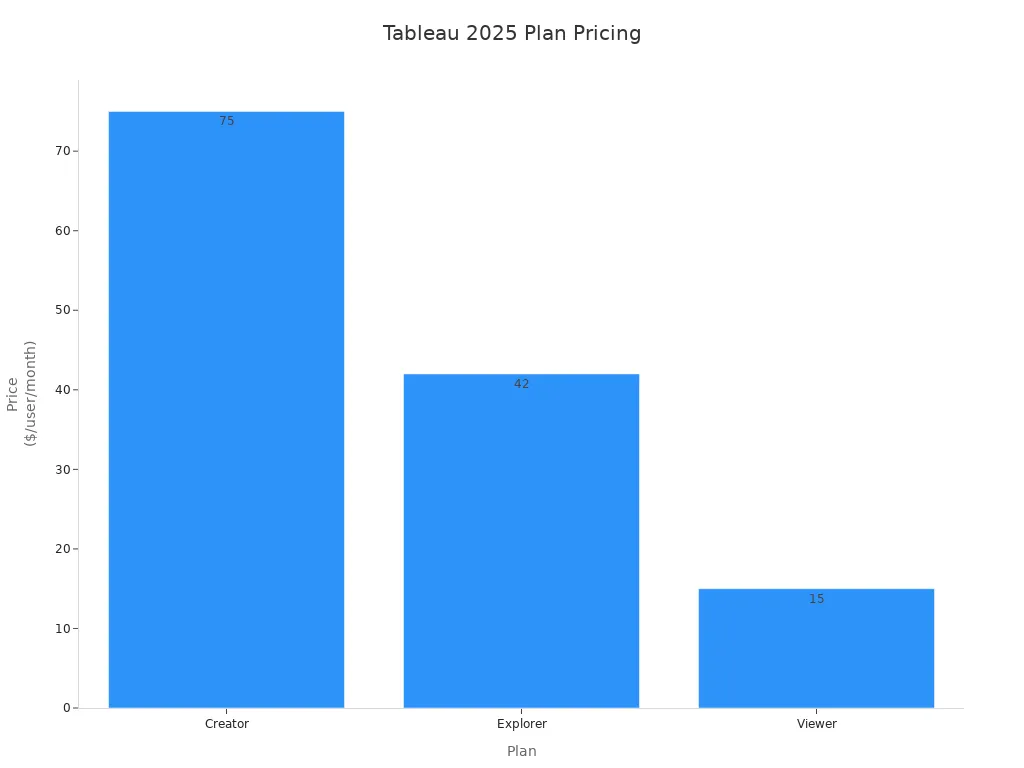
Tableau offers both cloud and on-premises options. You can use it for financial reporting software, but you may face data limits on Tableau Public and extra costs for advanced features. Viewer roles require payment, and you need to pay more for governance or AI tools. Tableau’s dashboards and analytics make it a favorite for businesses that want flexible reporting software.

Google Looker Studio gives you a free way to build dashboards and reporting tools. You can connect to Google data sources easily and use automated reporting tools for quick analytics. Looker Studio is great for businesses that want simple reporting software and dashboards.
| Feature/Limitations | Description |
|---|---|
| Stable connections | Google connectors are stable, but partner connectors can break. |
| Ease of use | Interface can be busy and hard to navigate. |
| Data blending | Limited to 5 data sources per blend. |
| Internal dashboards | Good for quick dashboards, less for long-term reporting. |
| Customizable reports | Highly customizable, but controls are hard to find. |
| Report sharing & automation | Basic automation, no centralized control. |
| Security | Shared responsibility for data encryption. |
| Plan | Price |
|---|---|
| Looker Studio (Free) | Free with unlimited dashboards. |
| Looker Studio Pro | $9 per user, per project, per month. |
| Platform | Rating |
|---|---|
| G2 | 4.4/5 |
| Capterra | 4.6/5 |
You can use Looker Studio for automated reporting tools, but you may find the interface confusing. Data blending is limited, and automation features are basic. Still, it’s a strong choice for reporting software if you want free dashboards and analytics.
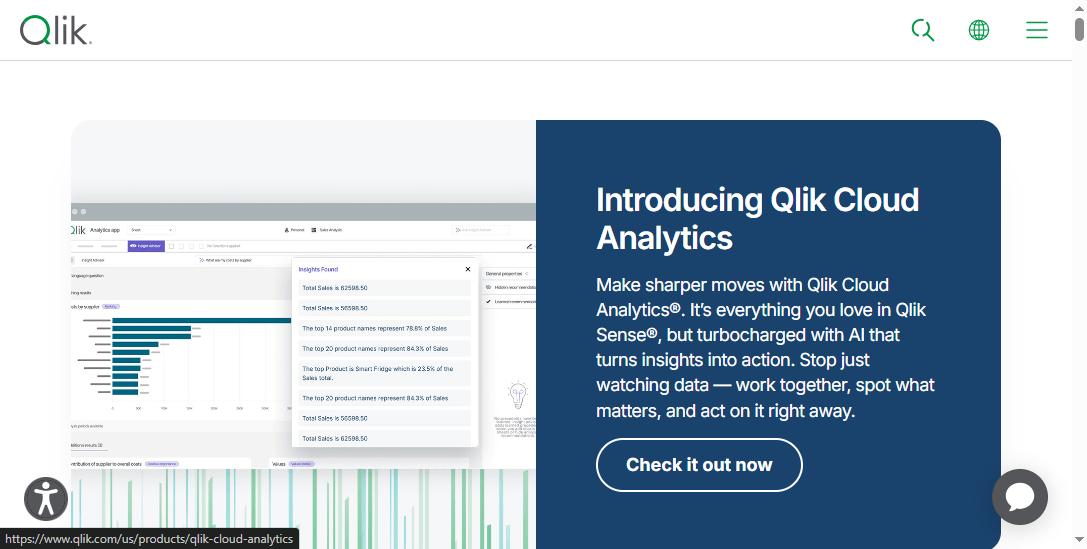
Qlik Sense is a powerful reporting software for businesses that want real-time analytics and automated reporting tools. You can use Qlik Sense to build dashboards, connect to many data sources, and explore your data with advanced analytics.
Qlik Sense stands out for its associative data model, which lets you see relationships in your data easily. You can use it for financial reporting software, and it scales well for enterprise reporting tools. Qlik Sense offers strong security, customizable dashboards, and integration with other business tools.
Some users find the learning curve steep, and pricing can be complex. Still, Qlik Sense remains a top pick for reporting tools and analytics.
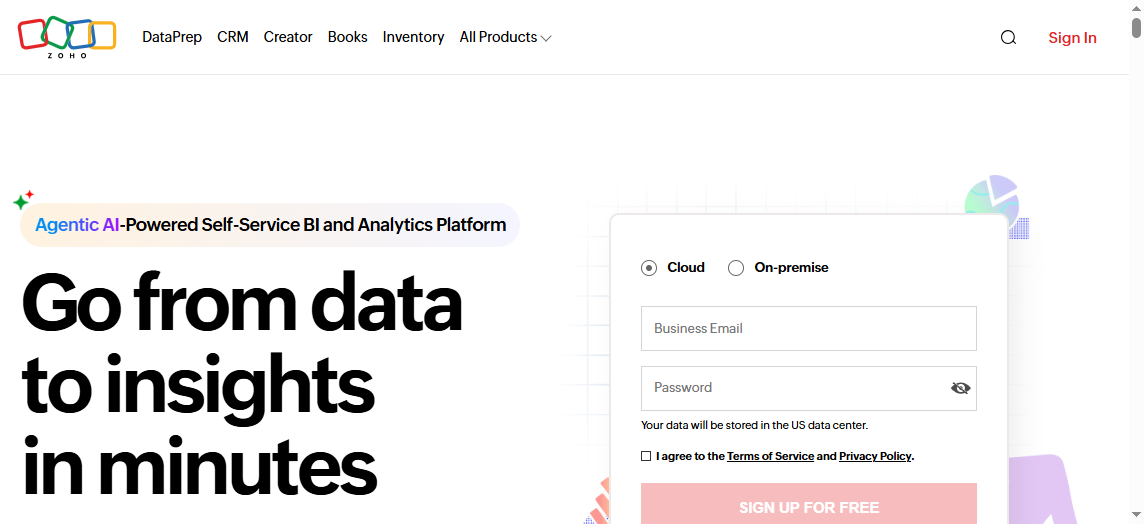
Zoho Analytics is a cloud-based reporting software that helps you create dashboards, automate reporting, and analyze your data in real-time. You can use Zoho Analytics for financial reporting software, and it integrates with over 100 business apps.
| Feature Description | User Ratings |
|---|---|
| AI-powered BI and data analytics platform | 91% recommend it |
| Integrates with 100+ business apps | 79% satisfaction |
| Create ETL data pipelines | N/A |
| Insightful visualizations | N/A |
| Interactive map charts for geographical data | N/A |
You can create ad hoc reports, use client libraries in different languages, and get support based on your plan. Zoho Analytics is a good choice for businesses that want easy-to-use enterprise reporting tools and automated reporting tools.
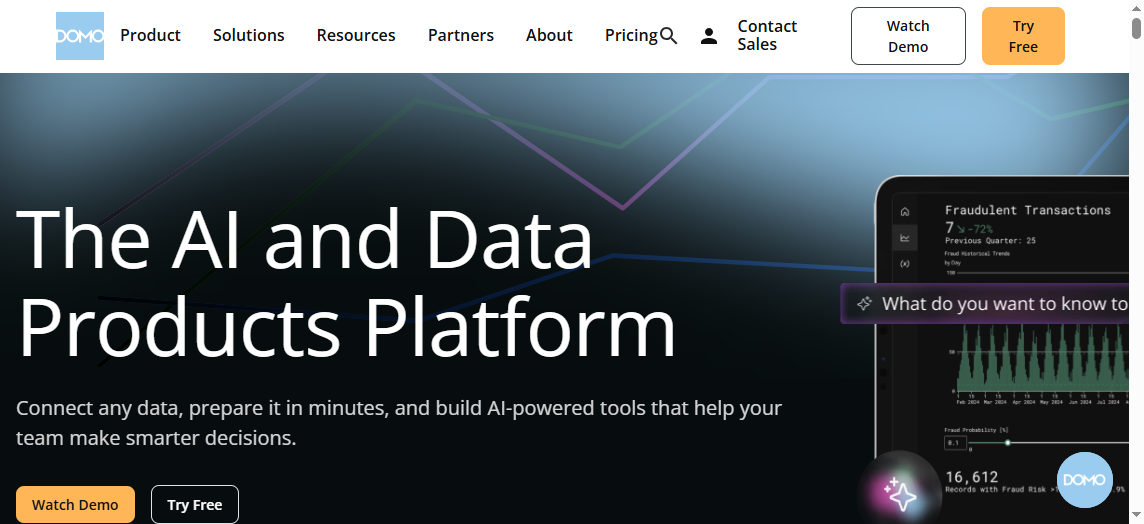
Domo is a cloud-based reporting software that focuses on dashboards, data integration, and real-time analytics. You can use Domo to connect to many data sources and automate reporting across your business.
| Feature/Limitations | Description |
|---|---|
| Dashboard Flexibility | Highly customizable and interactive dashboards. |
| Data Integration Capabilities | Strong integration with various sources. |
| Visual Clarity | Effective dashboards for complex data. |
| Setup Complexity | Setup can be complex and may need outside help. |
| High Costs | Starts at $2,000/month; enterprise plans can exceed $20,000/month. |
| Performance Issues with Large Datasets | Can be slow with big data sets. |
| Steep Learning Curve | Challenging for new users. |
| Limited Workflow and Automation Features | Workflow tools could be better. |
Pricing starts at $2,000/month for small teams, with mid-sized businesses paying $5,000 to $10,000/month. Enterprise plans can go over $20,000/month. Domo is popular for its dashboards and analytics, but setup and costs may be a challenge.
Sisense is a robust reporting software for businesses that need advanced analytics, dashboards, and automated reporting tools. You can use Sisense to integrate data from many sources and build real-time dashboards.
| Rating | Percentage |
|---|---|
| 5 Stars | 44% |
| 4 Stars | 50% |
| 3 Stars | 6% |
| 2 Stars | 0% |
| 1 Star | 0% |
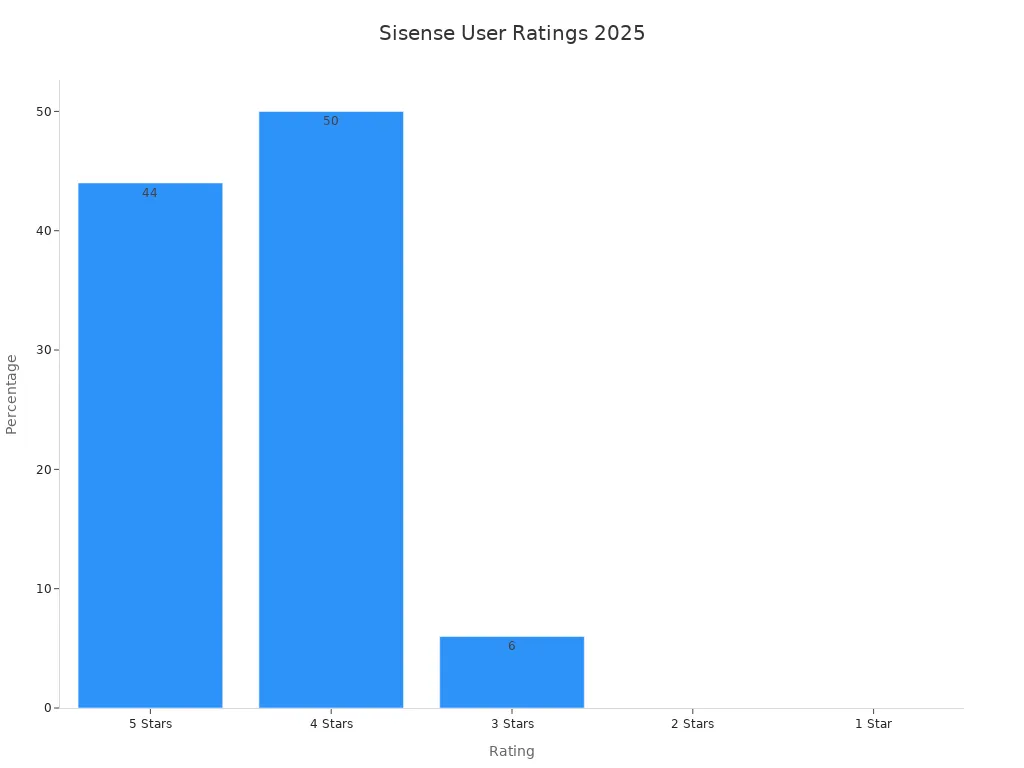
Sisense offers unified data integration, self-service analytics, and embedded analytics. Entry-level pricing for self-hosted setups starts at $10,000 per year, while cloud deployments for small teams average $21,000 annually. Prices can rise quickly for larger teams. Some users mention that the data modeling UI is less transparent, and on-premises deployments need more maintenance. Still, Sisense is a strong choice for enterprise reporting tools and analytics.
IBM Cognos Analytics is a trusted name in enterprise reporting tools. You can use it for financial reporting software, dashboards, and automated reporting tools. Cognos Analytics supports real-time data, advanced analytics, and strong security.
| Feature/Aspect | Details |
|---|---|
| User Rating | 7.8 out of 10 |
| Pricing | Contact for details |
| Limitations | SaaS can become pricey as user counts grow. |
| Less control over upgrades and customizations. | |
| Performance depends on IBM cloud region. |
You pay a subscription fee, usually per user per month or year. Different cloud packages are available. Some users find that SaaS pricing increases with more users, and there is less control over upgrades. Still, IBM Cognos Analytics remains a top choice for reporting software and analytics.
Klips is a reporting software that helps you build dashboards and automate reporting. You can use Klips for financial reporting software and analytics, but you may find some limitations.
| Feature/Limitations | Details |
|---|---|
| Highly Rated Features | N/A |
| Limitations | Time-consuming to create visualizations, slow servers, expensive pricing, poor customer service |
| Pricing | $420/month for 30 dashboards, $1025 for 80 dashboards, custom pricing for 100+ source credits |
| User Ratings | N/A |
Klips can be expensive, and some users report slow servers and poor customer service. Still, it offers dashboards and automated reporting tools for businesses that need simple reporting software.
When you choose from the top 10 reporting systems and tools for businesses, focus on your data needs, the dashboards you want, and how automated reporting tools can help your business grow. Each reporting software has its strengths, so pick the one that fits your analytics and reporting goals.

You might wonder what reporting systems actually do for businesses. These systems help you collect, organize, and analyze data from different sources. With reporting, you can turn raw data into clear, actionable information. You get to see the big picture and the details, all in one place. Reporting systems let you review results, spot trends, and share insights with your team. They simplify data preparation and analysis, so you can focus on what matters—making smart decisions. You don’t need to be a data expert to use these tools. They make reporting accessible and useful for everyone.
Reporting systems play a bigger role than ever. You need to prove your impact, meet compliance standards, and tell your story with data. Standardized reporting boosts transparency and builds trust with investors and customers. New regulations, like California’s Senate Bills 253 and 261 or the EU’s Corporate Sustainability Reporting Directive, require detailed disclosures. If you don’t keep up, you risk penalties and damage to your reputation. Reporting systems help you stay ahead by making sure your data is accurate, timely, and ready for audits.
Tip: Use reporting to set benchmarks and measure progress. This approach makes it easier to show results and improve your business.
You see big changes in business intelligence and self-service reporting. Companies want tools that give real-time data and real-time insights. You can now access dashboards with real-time analytics, thanks to cloud and hybrid architectures. AI and machine learning make it possible to ask questions in plain language and get answers fast. Self-service capabilities let you create your own reports without waiting for IT. At the same time, strong governance models keep your data secure and consistent.
Here are the top trends shaping reporting systems:
You get more power and flexibility with these trends. Self-service BI tools make data accessible for everyone, not just analysts. You can trust your data, explore it on your own, and make decisions with confidence.
You want enterprise reporting tools that make data integration and automation simple. These tools connect to cloud services like Google Cloud, on-premises databases, and third-party apps. You can pull data from everywhere and see it in one place. Automated reporting tools handle repetitive tasks, so you spend less time on manual work. With real-time data connectivity, you get live financial reporting and up-to-date analytics. Many tools use AI to automate reporting, spot trends, and deliver predictive insights. You can scale these systems as your business grows, making them perfect for financial reporting automation and dashboard-based reporting.

Dashboards and visualization features set top enterprise reporting tools apart. You get interactive dashboards that let you explore data visually. Visual dashboards help you spot trends and outliers fast. Most reporting software offers customizable dashboards, so you can track the metrics that matter. Real-time data connectivity means your dashboards always show the latest numbers. Here’s how leading tools compare:
| Feature | Domo | Zoho Analytics | Tableau | Microsoft Power BI | Qlik |
|---|---|---|---|---|---|
| User-friendly interface | Yes | Yes | No | Yes | No |
| Drag-and-drop reporting | Yes | Yes | No | Yes | No |
| Interactive dashboards | Yes | Yes | Yes | Yes | Yes |
| Integration support | High | High | Moderate | High | Moderate |
| Collaboration features | Yes | Yes | No | Yes | No |
You need reporting tools that adapt to your business. Customization lets you build reports and dashboards that fit your workflow. You can automate reporting workflows, create custom visualizations, and integrate data from multiple sources. Self-service access means you don’t have to wait for IT to get answers. Ad hoc reporting capabilities let you dig into data and find insights on your own. Tailored analytics give you role-based dashboards and predictive modeling, making financial reporting software more powerful.
| Feature | Benefits |
|---|---|
| Automation of reporting workflows | Saves time, boosts consistency, and adds flexibility. |
| Custom visualizations | Makes complex data easy to understand and increases report use. |
| Data integrations | Gives you a single source of truth and reduces IT workload. |
| Self-service access | Speeds up insights and improves productivity. |
| Ad hoc reporting capabilities | Supports quick answers and dynamic business needs. |
| Tailored analytics | Offers role-based dashboards and predictive modeling. |

Security and collaboration matter in enterprise reporting tools. You want end-to-end encryption to keep your data safe. Data loss prevention tools monitor data movement and flag risky behavior. Multi-factor authentication adds extra protection for your accounts. Compliance with privacy standards like GDPR and HIPAA shows your business intelligence system takes data seriously. Collaboration features let teams share insights and work together on reports, making financial reporting software more effective.
| Feature | Description |
|---|---|
| End-to-End Encryption | Keeps your data private, even when shared. |
| Data Loss Prevention (DLP) | Protects sensitive information and enforces company policies. |
| Multi-Factor Authentication | Adds extra security beyond passwords. |
| Data Compliance and Privacy | Meets regulations and builds trust with clients and partners. |
You get peace of mind and better teamwork with these features. Enterprise reporting tools help you manage data, automate reporting, and deliver clear, actionable insights.
You want a reporting tool that does more than just create charts. FineReport gives you a complete platform for reporting, data integration, and business intelligence. You can connect all your business data sources and manage everything in one place. The drag-and-drop designer makes it easy to build reports and dashboards, even if you don’t have a technical background.
Here’s a quick look at what sets FineReport apart:
| Feature | Description |
|---|---|
| Integration | Connects multiple data sources, keeping your business data unified. |
| Visualizations | Offers a wide range of visual charts to show the value in your data. |
| Data Entry | Lets you collect and manage data with simple forms. |
| Report Management | Centralizes staff, reports, and permissions for easy control. |
| Deployment | Deploys as a web app or integrates with OA, CRM, or MES systems. |
| Mobile Access | Lets you view reports and get notifications on the go. |
| Dashboard Components | Drag and drop components to build dashboards quickly. |
You can automate reporting tasks, schedule report delivery, and set up permissions for different users. FineReport helps you keep your reporting process smooth and secure.
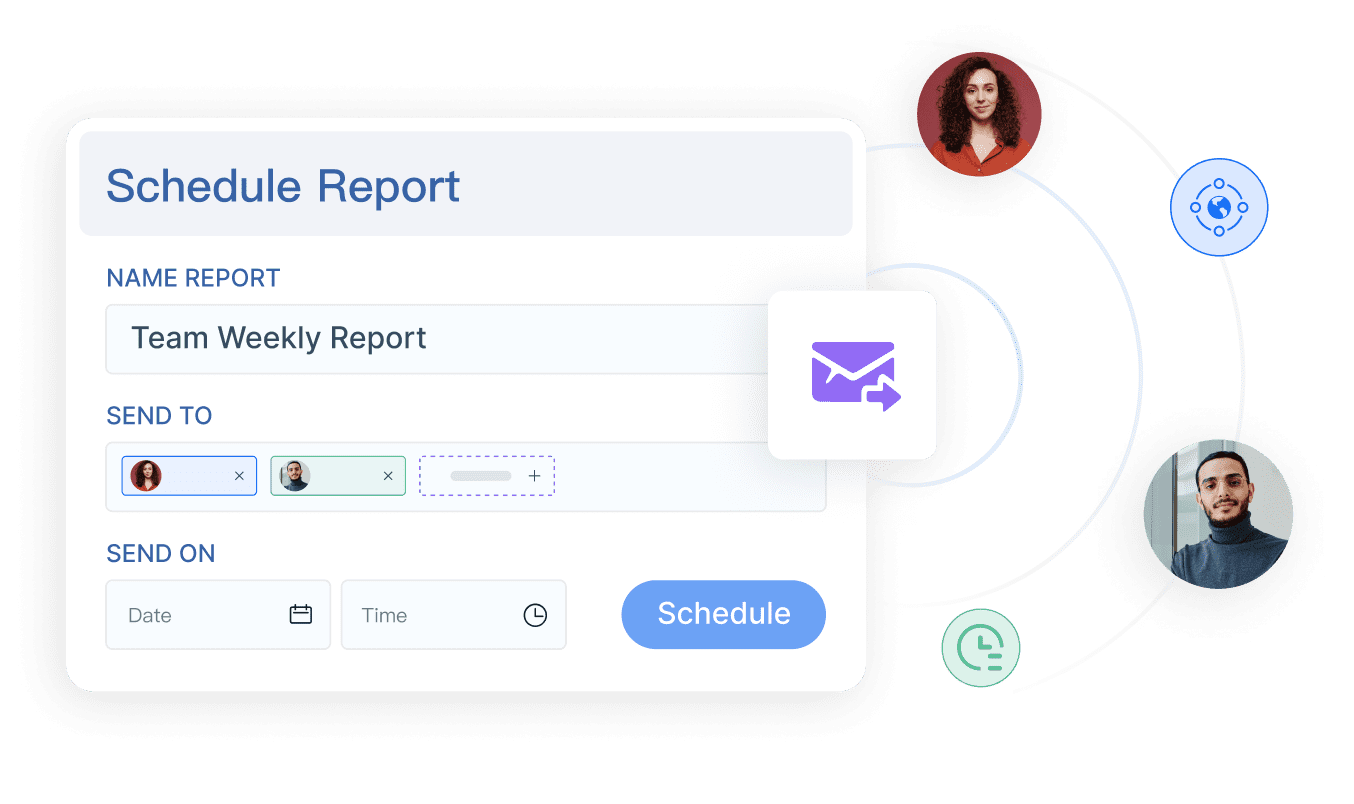
You don’t have to stay at your desk to check your data. FineReport supports mobile reporting, so you can access dashboards and reports from your phone or tablet. The platform gives you tools to design dashboards that look great and work well on any device. You can monitor real-time data, track KPIs, and get alerts wherever you are. This flexibility helps you stay connected to your business, even when you’re on the move.

Let’s see how FineReport works in the real world. SAMOA, a leading distributor for OPPO in Taiwan, faced big challenges with data silos and manual reporting. The company needed a way to unify data, automate reporting, and build real-time dashboards. With FineReport, SAMOA created a transparent management system that connects all their data sources. They standardized reports, automated performance tracking, and built dashboards for sales and operations. Now, managers get real-time insights, and teams spend less time on manual tasks. SAMOA plans to expand this system globally, showing how FineReport can scale with your business.
FineReport and FineBI work together to cover all your reporting and analysis needs. FineReport handles complex reporting and dashboards, while FineBI lets business users explore data on their own. This combination gives you a complete business intelligence solution.
When you compare enterprise reporting tools, you want to know how they help you work with data every day. Most top reporting systems give you dashboards with alerts, notifications, and KPIs. You can interact with your data, spot trends, and share insights with your team. The best automated reporting tools let you explore data visually and manage everything from a central console. You get self-service options, so you can build reports without waiting for IT. Mobile support means you can check your financial reporting software on any device.
Here’s a quick look at how features stack up:
| Feature / Aspect | Average Rating / Sentiment Score | Key Praised Attributes and User Comments |
|---|---|---|
| Dashboard | 84 | Alerts, notifications, KPIs, visual analytics, interactive features |
| Data Exploration and Visualization | 83 | Visually manipulate, interact with, and explore data; pattern detection |
| BI Platform Administration | 82 | Centralized management console |
| Collaboration | 83 | Sharing and directing work among co-workers |
| Self Service and Ad Hoc Capabilities | 81 | Enables selected users to interact with BI data |
| Mobile Support | 78 | Multi-device and platform support |
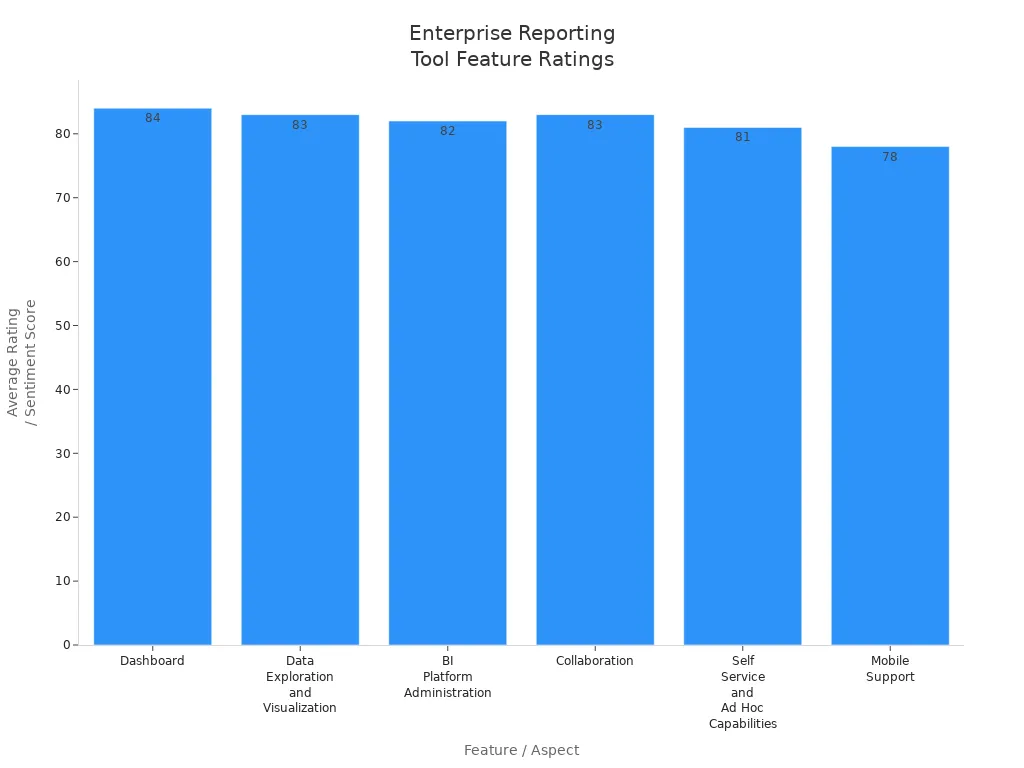
You’ll notice Qlik Sense gets high marks for collaboration and mobile support. Zoho Analytics stands out for its integration with over 250 platforms. Domo offers strong AI-powered analytics, but some users mention limits in data integration.
You want reporting systems that fit your budget and grow with your business. Power BI gives you a Premium Per User option at about $24 per user each month. For bigger teams, you can choose Premium per capacity starting at $4,995 per month. Tableau offers Creator at $75, Explorer at $42, and Viewer at $15 per user each month. Looker starts around $60,000 a year for small teams, with most businesses spending about $150,000 a year. Domo uses a consumption-based model, so you pay for what you use and can try all features for 30 days.
Tip: Start with a plan that matches your current needs. You can scale up as your data and reporting needs grow.
Integration and security matter when you pick enterprise reporting tools. The best automated reporting tools connect with RMM, PSA, endpoint management, and ticketing systems. This gives you a full view of your IT operations and financial reporting software. You get audit logs, role-based access controls, and compliance-ready templates. These features help you protect sensitive data and meet industry standards.
| Feature Type | Description |
|---|---|
| Integration Capabilities | Native connections to IT and business systems for a complete data view |
| Security Features | Audit logs, role-based access, compliance templates for organizations handling sensitive data |
You can trust these reporting tools to keep your data safe while making reporting easy for everyone.
You want a reporting system that fits your business, not just any tool from a list. Start by looking at how reporting systems can support your daily operations and financial reporting software needs. Think about what kind of data you use, how often you need reports, and who will read them. Here’s a table to help you break down the main factors:
| Factor | Description |
|---|---|
| Integration into Business Processes | Seamlessly integrates reporting into daily operations for real-time data analysis and decision-making. |
| Choosing the Right Reporting Tools | Consider various tools like dashboards and business intelligence software based on specific needs. |
| Creating a Reporting Schedule | Establishes consistency and timeliness in reporting, ensuring stakeholders are informed. |
| Maintaining Data Accuracy | Ensures that reporting data is reliable and actionable, involving stakeholders in the process. |
| Evaluating Reporting Processes | Continuously refine processes to improve reporting effectiveness and relevance. |
You should involve your team when you assess these needs. Everyone who uses financial reporting software or self-service dashboards will have different priorities.
Connecting new reporting systems to your current data platforms can feel tricky. You want a smooth transition that keeps your data secure and your reporting accurate. Here’s how you can make integration easier:
Data security matters most. Use encryption and role-based access controls to protect sensitive information during transfers. Automated processes help eliminate human error, speed up workflows, and support deeper analytics in financial reporting software.
Your reporting system should grow with your business. Look for financial reporting software that handles more data as your needs expand. Security features like end-to-end encryption and multi-factor authentication keep your data safe. Self-service options let you add users and dashboards without extra hassle. You want a system that supports compliance and protects your business intelligence.
Reporting systems should help you reach your business intelligence goals. Choose tools that offer self-service analytics, real-time dashboards, and flexible reporting. Financial reporting software should make it easy to track KPIs and share insights. When your reporting supports decision-making, you can respond faster and make smarter choices. The right system turns your data into a powerful asset for your business.
Choosing the right reporting systems shapes how your businesses use data for smarter decisions. You want reporting that fits your needs and helps you turn data into action. Start by working with your teams to find out what you need from reporting. Write down your business requirements, then research and narrow your options. Ask vendors for demos that show how their reporting tools handle your data. Try out top tools and talk with your stakeholders before you decide.

What Is a Quarterly Report and Why Investors Should Care
How to Use Inventory Report for Better Business Decisions
How to Build a Service Report Template for Your Business
What Is a Research Report and Why Does It Matter

The Author
Lewis
Senior Data Analyst at FanRuan
Related Articles

10 Custom Reporting Dashboard Tools Compared: Features, Limits, and Best-Fit Use Cases
Compare 10 custom reporting dashboard tools on features, limits, and best-fit use cases.
Lewis Chou
May 03, 2026

10 Best Dashboard Reporting Tools for 2026 Compared: Power BI, Tableau, Looker Studio, and More
Dashboard reporting tools are software platforms that turn business data into interactive dashboards, scheduled reports, and decision ready insights.
Lewis Chou
Apr 27, 2026
How to create an HTML report from scratch in 2026
Build an html report from scratch in 2026 with easy steps, tools, and tips for customization, sharing, and making your data clear and interactive.
Lewis Chou
Mar 23, 2026


