Yes, you can launch a dashboard creator online without technical skills using no-code platforms like FineReport. Imagine needing to visualize business data but not knowing how to code. You don’t have to feel stuck. Today’s no-code dashboard tools make it easy for anyone to build a dashboard that fits their needs. You just drag, drop, and customize. No-code dashboard creators help you tackle common challenges like data overload, integration with systems, and security concerns. You get speed, simplicity, customization, and strong security. The market for no-code dashboard solutions is booming, so you’re not alone in wanting an easier way to create dashboards.
- Lack of customization
- Data overload
- Integration with existing systems
- Interpretation of complex data
- Data quality and accuracy
- Cost constraints
- Security concerns
What Is a No-Code Dashboard Creator?
Dashboard Creator Overview
You might wonder what a dashboard creator actually does. In simple terms, it’s a tool that helps you build dashboards to visualize and track your business data. You don’t need to write code or have a technical background. A no-code dashboard creator lets you turn raw data into interactive dashboards using visual interfaces and drag-and-drop features.
Let’s look at how no-code dashboard creators compare to traditional dashboard building tools:
| Feature | No-Code Dashboard Creators | Traditional Dashboard Tools |
|---|---|---|
| Technical Skills Required | None | Requires technical expertise |
| User Interface | Natural language and visual interfaces | Often complex and less intuitive |
| Speed of Deployment | Fast and agile | Slower, requires setup and configuration |
| Ideal Users | Non-technical users, agile teams | Technical teams, analytics professionals |
| Use Case | Real-time visibility, quick insights | Structured reporting, complex queries |
You get a user-friendly experience that makes building a dashboard feel like working with a template or customizing a presentation.
No-Code Dashboard Benefits
No-code dashboard creators open the door for everyone to create dashboards, not just IT experts. Here’s why you’ll love using no-code tools:
- No-code dashboards transform raw data into interactive insights without coding or design skills.
- You can create hyper-connected, customized dashboards using easy drag-and-drop interfaces.
- AI features help eliminate the need for coding skills, making dashboard creation accessible to non-programmers.

Flexibility is a critical feature that any type of dashboard should have given the dynamic nature of our business and its needs. A great dashboard is one that can easily adapt to changes in the requirements of a business, whether it is a Marketing, CRM, or any other dashboard.
Organizations report big wins with no-code dashboard solutions:
| Benefit | Description |
|---|---|
| Cost and Time Savings | No-code platforms reduce the need for specialized technical resources, saving time and money. |
| Scalability and Adaptability | Scale dashboard capabilities as your needs grow, integrating new data sources easily. |
| Empowering Data-Driven Decisions | Democratize data access so everyone can analyze and act on key metrics. |
FineReport Features
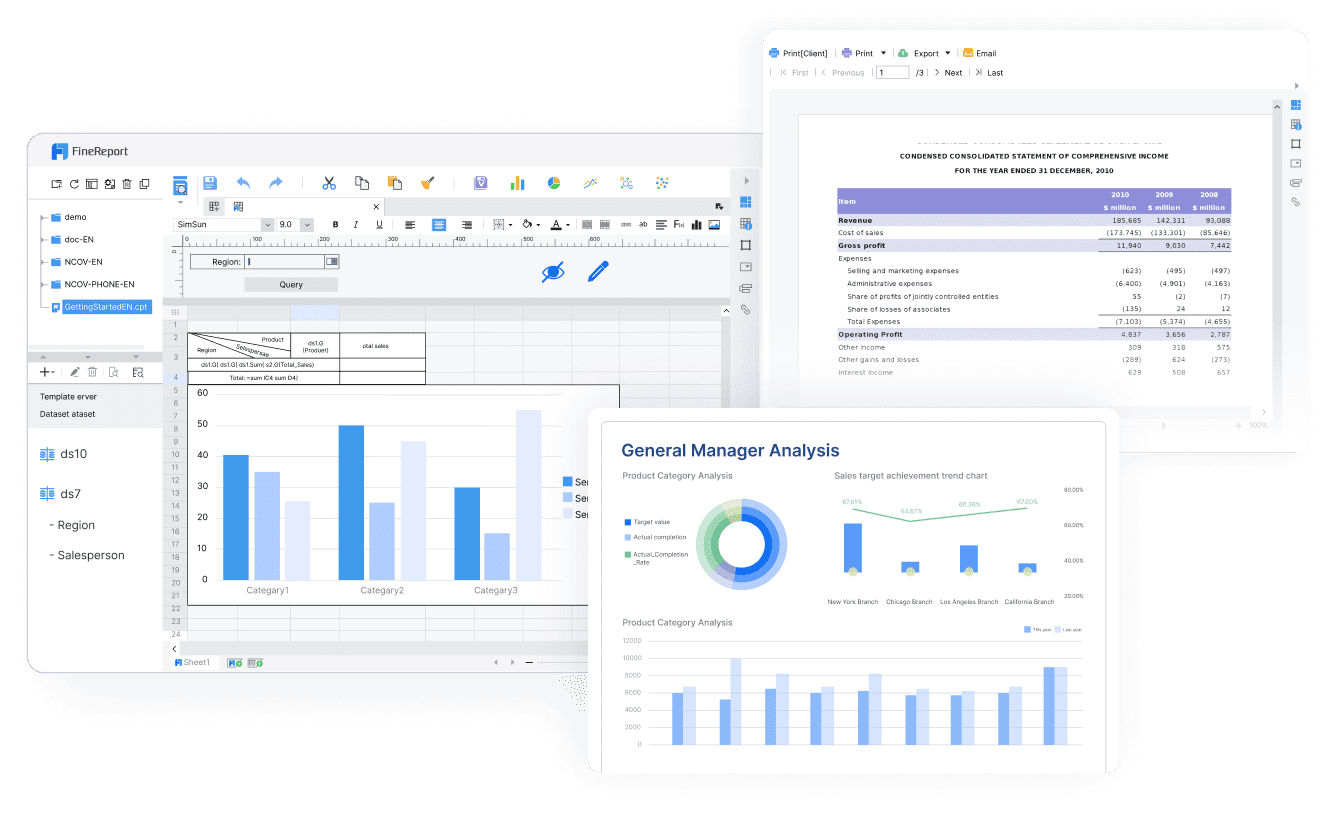
FineReport stands out as a top no-code dashboard builder. You get a drag-and-drop interface that feels familiar, like working in Excel. You can connect to all your data sources and handle millions of records with ease. FineReport offers a flexible report designer, so you can build dashboards, create pixel-perfect reports, and use stunning 3D visualizations.

Here’s what makes FineReport special:
| Feature | Description |
|---|---|
| Drag-and-Drop Interface | Build complex reports visually with formatting, grouping, sorting, and calculations included. |
| Automation Capabilities | Schedule automated generation and distribution, saving time and reducing manual errors. |
| Extensive Data Connectivity | Connect to all data sources and handle millions of records efficiently. |
| Flexible Report Designer | Enables rapid report or dashboard generation through an Excel-like interface. |

You can use templates to get started fast, and automation features help you save hours every week. FineReport reduces IT dependency by 90%, so you can focus on reporting and insights. If you want to create dashboards, FineReport makes no-code reporting simple, powerful, and accessible.

How to Build a Dashboard Creator Without Coding

So, you want to build dashboards but don’t know where to start? You’re in the right place. Let’s break down the process into simple steps. You’ll see how easy it is to launch a dashboard creator using no-code tools like FineReport—even if you’ve never touched code before.
Set Dashboard Goals
Before you jump into any dashboard building tools, take a moment to think about your goals. What do you want your dashboard to show? Who will use it? Here’s a quick checklist to help you set clear objectives:
- Understand the purpose of your dashboard. Are you tracking sales, monitoring inventory, or analyzing customer feedback?
- Talk to your team or stakeholders. Ask what information they need most.
- List the key performance indicators (KPIs) you want to monitor.
- Picture your ideal user. Is it a manager, a team member, or maybe yourself?
Tip: Setting clear goals at the start will save you time and help you create dashboards that actually solve problems.
Choose a No-Code Platform
Now, it’s time to pick a no-code dashboard builder. You want something user-friendly, flexible, and powerful. FineReport checks all these boxes. Here’s what to look for when choosing your platform:
| Criteria | Description |
|---|---|
| Ease of Use | Look for a platform with a simple interface and no steep learning curve. |
| Integrations | Make sure it connects with your existing data sources and business tools. |
| Scalability | Choose a dashboard builder that grows with your needs and supports advanced features. |
FineReport stands out because it offers a drag-and-drop interface, strong data integration, and templates to get you started fast. You don’t need to worry about technical hurdles. Just focus on your data and insights.

Connect Data Sources
You can’t build a dashboard without data. The good news? No-code platforms like FineReport make data integration simple. Here’s how you can connect your data:
- List all the data sources you want to use. This could be Excel files, Google Sheets, SQL databases, or cloud apps like Airtable and Notion.
- Use FineReport’s built-in connectors to link your data. You can connect to databases like MySQL, PostgreSQL, SQL Server, and more.
- Map your data fields using the visual interface. This helps you align information from different systems.
- Set up automatic data syncs. FineReport lets you schedule updates so your dashboard always shows the latest numbers.
- Add data quality checks. Make sure your dashboard only displays accurate, up-to-date information.
Note: FineReport supports Excel import, so you can bring in your existing spreadsheets without hassle. You can also use the Excel Batch Import Plugin for bulk uploads.
Design with Drag-and-Drop
Here’s where the fun begins. FineReport’s drag-and-drop editor makes dashboard creation feel like building with blocks. You don’t need to write code or worry about complex settings. Just drag charts, tables, and widgets onto your canvas.
| Feature | How It Helps You |
|---|---|
| Drag-and-Drop Interface | Add and arrange charts, graphs, and tables with simple mouse movements. |
| Templates | Start with a template or design your own layout from scratch. |
| Responsive Design | Your dashboard looks great on any device—PC, tablet, or phone. |
| 3D Visualizations | Make your data pop with interactive 3D charts and animations. |
You can build dashboards for sales, operations, finance, or any other area. FineReport’s dashboard management system lets you organize multiple dashboards in one place. You can even create a decision-making platform for your whole team.
Customize and Secure
Every business is unique. FineReport gives you the power to customize your dashboard layout, colors, and data sources. You can set up role-based access controls to keep sensitive data safe. Only authorized users can view or edit certain dashboards.
Here’s how you can secure your dashboard management system:
- Use end-to-end encryption to protect your data.
- Assign roles and permissions so only the right people see the right information.
- Schedule regular security audits to keep your dashboards compliant.
- Take advantage of automatic updates and threat detection features.
Pro Tip: FineReport’s dashboard management system lets you manage users, permissions, and data security from one central place. You can also export reports for audits or compliance checks.
FineReport also supports mobile dashboards. You can view and interact with your dashboards on any device, thanks to HTML5 compatibility. This means you stay connected to your data, whether you’re at your desk or on the go.

Ready to build a dashboard that makes your data work for you? With no-code reporting, you can create interactive dashboards, manage your dashboard management system, and share insights with your team—all without writing a single line of code.
FineReport No-Code Dashboard Solutions
Industry Use Cases
You might wonder where you can use a no-code dashboard creator like FineReport. The answer is almost everywhere. Many industries have adopted no-code dashboard solutions to make reporting and analytics easier. Here’s a quick look:
| Industry | Description |
|---|---|
| Healthcare | Widely used for data management and reporting. |
| Manufacturing | Essential for operational analytics and reporting. |
| Finance & Banking | Critical for financial reporting and analysis. |
| Real Estate | Used for market analysis and property management. |
| IT | Important for software development and project management. |
No-code tools help you create dashboards quickly, even if you have no technical background. You can use dashboard templates to get started fast and customize them for your needs.
Manufacturing and Smart Factory
If you work in manufacturing, you know how important real-time data is. FineReport’s no-code dashboard solutions help you build dashboards that track production, quality, and costs. You can use the drag-and-drop interface to design visual dashboards that show everything from equipment status to inventory levels.
FineReport supports lean production and smart factory management. You can connect data from different systems and see it all in one dashboard. This makes your dashboard management system more effective and user-friendly. You can use templates to monitor KPIs, spot trends, and make quick decisions.
Tip: Use dashboard templates to save time and keep your business intelligence dashboard organized.
Risk Management
Managing risk in finance or manufacturing can feel overwhelming. FineReport’s no-code dashboard solutions make it easier. You can build dashboards that show real-time insights and key risk metrics. Here’s how no-code dashboards help with risk management:
| Benefit | Description |
|---|---|
| Real-time insights | Lets you spot risks and act fast. |
| Visualizations of key metrics | Makes complex data easy to understand. |
| Analysis without technical skills | Empowers everyone to join the risk management process. |
You don’t need coding skills to create interactive dashboards for risk analysis. FineReport’s dashboard management system lets you control who sees what, keeping your data secure.
Customer Success Story
Let’s look at a real example. Kintetsu World Express used FineReport to build dashboards that connect multiple data sources. Their sales teams now use interactive dashboards to track customer visits and cargo volumes. This improved their reporting and made their operations more efficient.
FineReport’s no-code dashboard creator helped Kintetsu streamline their dashboard building tools and reporting process. They now enjoy better decision-making and faster access to business insights.
With FineReport, you can build dashboards, manage your dashboard creator, and create dashboards that drive results—no code required.
You get operational efficiency, real-time analytics, and effective dashboard management. FineReport’s templates and user-friendly design make it easy for anyone to build dashboards and manage data like a pro.
Tips for Launching Your No-Code Dashboard
Common Mistakes
When you start with a no-code dashboard creator, it’s easy to make a few rookie mistakes. You want your dashboard to shine, so watch out for these common pitfalls:
- Trusting your data is always accurate. Data can change fast, so double-check before you build dashboards.
- Using outdated tools instead of a modern dashboard management system. Old methods slow you down and make reporting harder.
- Forgetting to turn insights into action. A dashboard only helps if you use it to make real business changes.
Tip: Always review your data and update your dashboard regularly. This keeps your reporting fresh and reliable.
Best Practices
You can create dashboards that stay useful and user-friendly by following a few best practices:
- Review your dashboards often. Ask users for feedback and look for ways to improve.
- Schedule regular checkups. Data sources change, so make sure your dashboard stays accurate.
- Add feedback buttons or quick surveys right in your dashboard. This helps you spot what works and what doesn’t.
- Use analytics to see which parts of your dashboard get used most.
- Bring in outside experts if you need a fresh perspective.
- Keep your dashboard simple and easy to use. A clean template makes a big difference.
- Run manual audits to catch problems that automated tools might miss.
- Track changes with version control. This helps you keep your dashboard management system organized.
- Focus on performance and accessibility. Everyone should find your dashboard easy to use.
Remember: A great dashboard builder gives you templates and a drag-and-drop interface, so you can build a dashboard that fits your needs.
Maintenance and Updates
Keeping your no-code dashboards in top shape is key. FineReport makes this easy with strong support and resources:
- Get help from online support during business hours.
- Learn with training videos, step-by-step learning paths, and certifications.
- Use the cloud operation maintenance dashboard to monitor performance and spot issues fast.
You can update your templates and dashboards as your business grows. FineReport’s ongoing updates and reporting features help you stay ahead. With these tools, you can build dashboards that keep delivering value—no matter how your needs change.
You can launch powerful dashboards with no-code tools like FineReport, even if you have zero coding experience. Take a look at what you get:
| Benefit | Description |
|---|---|
| Faster Dashboard Creation | You describe what you want, and AI builds it for you. |
| Real-Time Data Insights | Dashboards update instantly, so you spot issues right away. |
| Automated Metric Tracking | AI watches your key numbers and sends alerts when something changes. |
No-code dashboard creators let you move fast, track metrics, and get answers without waiting for IT. Try FineReport’s free demo and see how easy it is. You don’t need technical skills to get started. You can keep your dashboards fresh with simple updates and ongoing support. Ready to make your data work for you? Jump in and build your first dashboard today!
Continue Reading About dashboard
What is a KPI Dashboard and Why Your Business Needs One
What is a Digital Dashboard and How Does It Work
How to Craft an Effective Analytics Dashboard


FAQ

The Author
Lewis
Senior Data Analyst at FanRuan
Related Articles

How to Build an Investment Portfolio Reporting Dashboard for Executives: KPIs, Benchmarks, and Drill-Down Views
Investment portfolio reporting for executives is not about showing every holding, transaction, and chart your investment team can produce. It is about giving CEOs, CFOs, CIOs, boards, and investment committees a fast, re
Yida YIn
Jun 25, 2026

12 KPI Reporting Examples for Executive Dashboards: What to Show in Weekly, Monthly, and Quarterly Reviews
Executive leaders do not need more data. They need decision ready $1 examples that match how often they review the business and what actions they are expected to take. A weekly $1 should surface fast moving risks and per
Yida YIn
Jun 25, 2026

How to Build a Digital Marketing Reports Dashboard: Executive Examples, KPIs, and Templates
A $1 is the control layer that helps executives and marketing leaders turn scattered channel data into fast, confident decisions. If you are a CEO, CMO, operations director, or marketing analytics lead, the real problem
Yida Yin
May 07, 2026