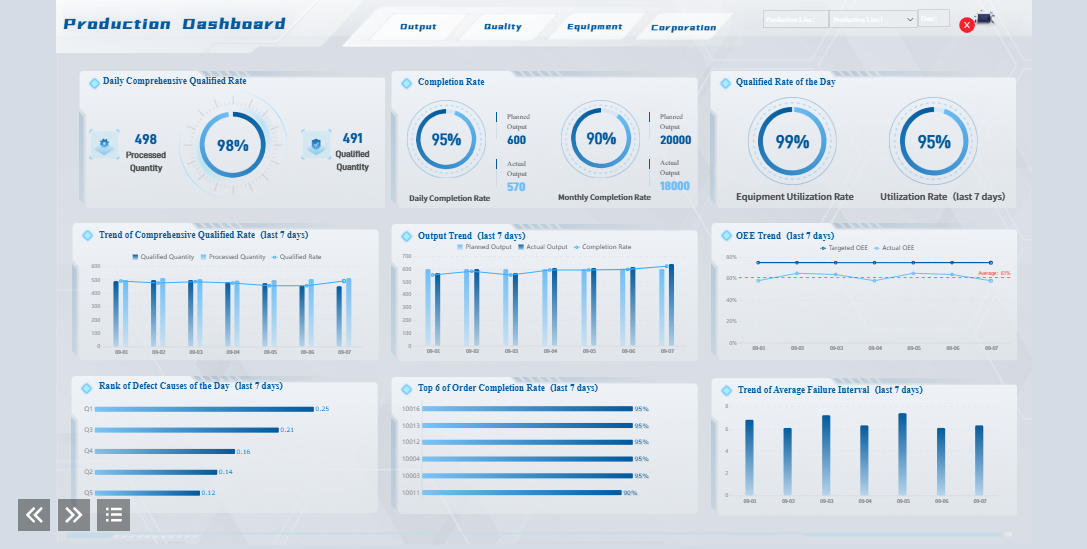
What is a personal productivity dashboard? It’s a visual workspace where you can track your goals, habits, and daily tasks in one place. This tool gives you a clear overview of your progress and helps you stay organized, whether you work from home or in an office.
You face many challenges without a personal productivity dashboard. Distractions at home, missed deadlines, and manual time tracking can make it tough to measure your real productivity. When you use a dashboard, you can spot these problems early and take action to improve your routine.
What Is a Personal Productivity Dashboard?
A personal productivity dashboard gives you a single place to see everything that matters for your day. Experts describe it as a tool that goes beyond simple note-taking. It brings together your goals, habits, and important data, so you can make better decisions and take action that fits your style. You get a clear, organized view of your tasks and progress, which helps you stay focused and motivated.
Key Features of a Productivity Dashboard
When you set up a productivity dashboard, you pull all your information into one spot. This is what makes it different from other tools. You do not have to jump between apps or search for lost notes. Here are some features you might find:
- Visual summaries that show how your activities match up with your time and energy.
- Tables that link your goals to projects, deadlines, and notes.
- Checklists you can move around to match your changing priorities.
- Financial dashboards that show your current status at a glance.
- Integration with other tools, so you can see everything in one place.
A productivity dashboard is dynamic. It changes as your needs change. You can add or remove sections, update your goals, and adjust your focus as you grow.
Benefits for Your Personal Productivity System
You get real benefits when you use a productivity dashboard. You can track habits like daily steps or sleep hours, which makes it easier to stick with them. Seeing your progress in charts or tables keeps you accountable. Small wins, like finishing a task or hitting a milestone, show up clearly and keep you motivated.
A productivity dashboard also saves you time. You do not need to enter data in many places. Integrations with other apps reduce errors and help you work faster. You get a workspace that fits your needs and helps you make decisions based on real data. Over time, you build a system that supports your goals and helps you improve every day.
Define Your Goals and Metrics in Productivity Dashboard
Before you build your productivity dashboard, you need to know what you want to track. Your goals and metrics shape your entire personal productivity stack. When you set clear goals, you make it easier to measure progress and stay motivated.
Setting Up Your Personal Productivity Stack
Start by thinking about what matters most to you. Do you want to finish more projects, build better habits, or manage your time more effectively? Your personal productivity stack should include tools that fit your workflow. Many people use task managers to organize daily work, habit trackers to build routines, and note-taking apps to capture ideas. You might also want to track engineering productivity metrics if you work in a technical field.
Here’s a quick look at common dashboard types and who they work best for:
| Dashboard Type | Description | Best For |
|---|---|---|
| Personal OKR Dashboard | Private dashboard with objectives, tasks, and updates. Encourages self-driven progress. | Hybrid/remote workers, high-autonomy roles. |
| Teammate OKR Dashboard | Displays individual goals and peer feedback. Raises accountability and engagement. | Growth-minded teams and managers. |
| Team Alignment OKR Dashboard | Maps cross-team OKRs, showing overlaps and shared accountabilities. Encourages collaboration. | Cross-functional initiatives. |
| Project-Based OKR Dashboard | Ties objectives to project milestones for a full-circle view. Connects tactical work to strategic goals. | Product teams and project-driven divisions. |
Choose the dashboard type that matches your style and needs. Your personal productivity system should support your unique way of working.
Choosing Metrics for Your Daily Dashboard
Once you know your goals, pick the right metrics for your daily dashboard. If you use task managers, you might track projects completed or tasks checked off. For habit tracking, you could measure streaks or consistency. If you want to improve time management, look at time spent on key activities.
Some useful metrics include:
- Projects completed
- Sales close rate
- Revenue per employee
- Effectiveness ratio
- Overtime hours
- Turnover rate
You can also group metrics by type:
- Output metrics: Number of tasks finished or sales made.
- Efficiency metrics: Time to complete a task or cost per unit.
- Quality metrics: Customer satisfaction or error rates.
- Engagement metrics: Turnover or absenteeism.
FineReport makes it easy to centralize and visualize these metrics. With its drag-and-drop dashboard builder, you can pull data from your task managers and other tools into one place. FineReport offers over 50 chart styles, mobile access, and simple integration with different systems. This helps you see your progress clearly and adjust your personal productivity stack as your needs change.

Select Tools and Build Your Productivity Dashboard

Choosing the right tools is a big step in building a productivity dashboard that fits your workflow. You want something that makes tracking goals, habits, and engineering productivity metrics simple. The right tool helps you stay organized and keeps your daily dashboard clear and easy to use.
Comparing FineReport and Other Tools
You have many options when you start implementing a productivity dashboard. Notion and ClickUp are popular choices for personal dashboards. They offer flexible templates and easy integration with task managers. You can drag and drop tasks, set reminders, and link notes. These tools work well for simple tracking and collaboration.
FineReport stands out when you need more advanced features. You get a drag-and-drop designer that lets you build custom dashboards without coding. FineReport supports multi-source data integration, so you can pull information from databases, spreadsheets, and even SAP systems. You can access your dashboard on your phone or tablet, making it easy to check your progress anywhere.
Here’s a quick look at how FineReport compares to other tools:
| Feature/Aspect | FineReport | Power BI |
|---|---|---|
| Built-in Charts | 19 types including Bar, Column, Radar, Line | Fewer built-in chart types |
| 3D Maps | 7 types, supports combination with other charts | Limited 3D map support |
| User Management | Multi-dimensional, cell-level security | Basic user management |
| Pricing | Free for personal use, flexible plans available | Minimum $10/user/month for Pro, $4,995/month for Premium |
FineReport also offers features that make personal dashboards more useful:
| Feature | Description |
|---|---|
| Data Portal | A unified data query entrance that helps you find reports and announcements quickly. |
| Customizable Portals | You can adjust portal content based on your usage habits. |
| Quick Access | Favorites and recent visits help you locate important data swiftly. |
| Dynamic Notifications | Get updates on new reports and changes through reminders. |
| Drag-and-Drop Development | Configure dashboards easily without coding. |
| Personalized Dashboards | Create dashboards tailored to your role, featuring key data indicators and recent activities. |
Industry experts recognize FineReport as a top choice for client reporting. Its flexibility and customization options make it easy to create dashboards that match your needs. The drag-and-drop builder is a favorite among users who want to build a productivity system that adapts as their goals change.
Mapping Your Personal Productivity Dashboard Layout
When you start building a productivity dashboard, layout matters. You want your dashboard to show the most important information first. This helps you focus on key metrics and make decisions faster.
Here are some strategies for mapping your dashboard layout:
| Strategy | Description |
|---|---|
| Prioritize Information | Put the most important data at the top or center. This helps you focus on what matters most. |
| Maintain Design Consistency | Use the same colors, fonts, and styles throughout your dashboard. This makes it look professional and easy to use. |
| Enable Interaction | Add buttons, filters, or dropdowns so you can customize your view and dig deeper into your data. |
- Establish a clear visual hierarchy. Guide your attention to critical information.
- Use appropriate visualizations. Limit visual elements to avoid clutter.
Good dashboard design makes it easy to interpret data. A clear hierarchy helps you spot trends and track progress. Responsive design ensures your dashboard works well on any device, boosting engagement.
You can use different visualization methods to show your productivity data:
| Visualization Method | Description | Best Use Case |
|---|---|---|
| Bar Charts | Uses bars to compare categories. | Comparing tasks or projects. |
| Pie Charts | Shows proportions of a whole. | Tracking habit completion rates. |
| Line Charts | Shows data over time. | Visualizing progress or trends. |
| Heat Maps | Uses colors to show data density. | Spotting patterns in large datasets. |
| Scatter Plots | Shows relationships between variables. | Finding links between habits and outcomes. |
Interactive and dynamic visualizations make your dashboard more engaging. You can customize chart types and layouts to fit your workflow.
Integrating Data Sources for Your Productivity System
A strong productivity dashboard pulls data from many sources. You might want to connect task managers, habit trackers, spreadsheets, or even engineering productivity metrics. FineReport makes this easy with its multi-source integration.
You can connect data in several ways:
- Data connection through the designer
- Data connection through the platform
- JDBC
- JNDI
- SAP
- XMLA
- FineBI
| Data Connection Type | Description |
|---|---|
| JDBC | Standard Java database connectivity. |
| JNDI | Java Naming and Directory Interface for database access. |
| SAP | Integration with SAP systems. |
| XMLA | XML for Analysis, used for OLAP data sources. |
| FineBI | Connection to FineBI data sources. |
FineReport lets you create multi-source reports. You can pull data from different databases and link them in one dashboard. This means you see everything in one place, from daily tasks to long-term goals.
When building a productivity dashboard, you may face some challenges:
| Challenge | Solution |
|---|---|
| Lack of Clear Purpose | Know your dashboard’s objective and how to use the data for decisions. |
| Overcrowded Dashboards | Keep it simple. Focus on key insights and best design practices. |
| Lack of consideration for the mobile experience | Design for mobile viewing. Make sure your dashboard works on small screens. |
| Getting buy-in and identifying what’s needed | Work with everyone involved to ensure data accuracy and efficiency. |
| Insufficient User Training | Provide guides and documentation to help users understand the dashboard. |
Personal dashboards work best when you keep them simple and clear. Make sure your dashboard is easy to use on any device. Collaborate with others to get the data you need. Provide training so everyone can use the dashboard effectively.
If you want to build a productivity system that grows with you, choose a tool that supports customization and integration. FineReport gives you the flexibility to create dashboards that match your style and needs. You can track everything from daily habits to engineering productivity metrics, all in one place.

Maintain and Evolve Your Productivity Dashboard
Building your personal productivity dashboard is just the beginning. To get the most value, you need to keep it fresh and make sure it grows with you. This section will help you set up routines for regular updates, use smart tools for maintenance, and show you how to audit and improve your system over time.
Keeping Your Daily Dashboard Up to Date
You want your dashboard to reflect your current goals and tasks. If you let it get outdated, it loses its power to help you stay on track. Here are some practical steps you can follow to keep your dashboard relevant and useful:
- Schedule regular reviews. Set aside time each week or month to check your dashboard. Update your progress, remove old data, and clear out anything that no longer matters.
- Keep it simple. Avoid adding too many widgets or charts. Focus on the essentials so you can see what matters at a glance.
- Build consistency with micro habits. Make updating your dashboard a small part of your daily routine. For example, spend five minutes each morning or evening reviewing your progress.
- Experiment with layouts. Try different arrangements and widgets. See what helps you focus and what feels distracting.
- Make adjustments as you go. When your goals or routines change, update your dashboard to match.
Tip: Simplicity is your friend. The best personal dashboards are easy to use and quick to update.
Mobile access can make a big difference in keeping your dashboard up to date. With mobile-friendly dashboards, you can check your progress, update tasks, and manage your goals from anywhere. This flexibility means you never lose track, even when you’re away from your desk.
| Feature | Description |
|---|---|
| Real-time Updates | Get instant notifications about changes to your tasks or projects. |
| Task Management | Add, edit, or check off tasks on the go for better organization. |
| Customizable Features | Adjust your dashboard layout to fit your workflow, right from your phone or tablet. |
| Offline Functionality | Access and update key features even without an internet connection. |
You can also sync your dashboard across devices. This ensures you always have the latest information, whether you’re using your laptop, tablet, or phone. Drag-and-drop customization lets you arrange your dashboard the way you like, making it more personal and user-friendly.
Regular maintenance does more than keep your dashboard looking good. It ensures your data stays accurate and relevant. When you monitor your dashboard in real time, you can spot problems early and fix them before they grow. This leads to better decisions and improved productivity.
Auditing and Improving Your Personal Productivity System
Your dashboard should evolve as your needs change. Regular audits help you see what’s working and what needs improvement. Here’s a routine you can follow to keep your personal productivity system sharp:
- Analyze your use of time. Look at how you spend your day. Find activities that take up time but don’t help you reach your goals.
- Evaluate task efficiency. Check how well you complete tasks. Are you focused? Do you finish on time? What gets in your way?
- Identify distractions. Notice what interrupts your work. Think about ways to reduce these distractions.
- Define your metrics. Make sure you’re tracking the right things. Your metrics should match your current goals, whether that’s finishing projects or improving engineering productivity metrics.
- Track your time. Use your dashboard or task managers to see where your time goes. Look for patterns and areas to improve.
- Use a task management system. Organize and prioritize your tasks. This helps you stay focused and avoid overwhelm.
- Monitor your progress. Check your results against your goals. Celebrate wins and look for ways to improve.
- Reflect and seek feedback. Take time to think about your habits. Ask others for feedback if you work in a team.
- Assess quality. Review the quality of your work. Look for ways to raise your standards.
- Check your well-being. Make sure you’re not burning out. Good productivity includes taking care of yourself.
Note: User feedback is powerful. When you ask for input from others, you get new ideas and spot blind spots in your dashboard. Interactive features and real-time feedback can turn your dashboard into a tool that truly fits your needs.
You’ll know it’s time to revise or upgrade your dashboard when you notice new events or changes in your routine. Stay flexible. Adapt your dashboard to fit new priorities or unexpected challenges. Use both leading and lagging indicators to track your progress. Watch for trends and adjust your actions as needed.
Regular monitoring and updates promote continuous improvement. When you know you’re tracking your progress, you stay motivated and perform better. Over time, your dashboard becomes a living part of your daily routine, helping you make smarter choices and reach your goals.
Personal dashboards work best when you treat them as evolving tools. Don’t be afraid to try new layouts, add new metrics, or remove what no longer serves you. With the right habits and tools, your dashboard will keep you moving forward—no matter how your goals change.
You can make your personal productivity dashboard part of your daily routine for real results. Review and adapt it often, since your needs and goals change over time. This habit keeps your dashboard relevant and effective. Check out some key benefits:
| Benefit Description |
|---|
| Enables smarter decision-making by identifying workload issues early. |
| Offers real-time insights for quicker decisions and less admin work. |
| Fosters a culture of continuous improvement through tracking and accountability. |
Try adding gamification or progress tracking to stay motivated. Start building your dashboard today and see how it helps you grow.

Continue Reading About Productivity Dashboard
Best Dashboard Apps for Business Insights
What is a Call Center Dashboard and Why Does It Matter
What is a Reporting Dashboard and How Does it Work
What is An Interactive Dashboard and How Does It Work
What is a Call Center Metrics Dashboard and How Does It Work


FAQ

The Author
Lewis
Senior Data Analyst at FanRuan
Related Articles

How to Build an Investment Portfolio Reporting Dashboard for Executives: KPIs, Benchmarks, and Drill-Down Views
Investment portfolio reporting for executives is not about showing every holding, transaction, and chart your investment team can produce. It is about giving CEOs, CFOs, CIOs, boards, and investment committees a fast, re
Yida YIn
Jun 25, 2026

12 KPI Reporting Examples for Executive Dashboards: What to Show in Weekly, Monthly, and Quarterly Reviews
Executive leaders do not need more data. They need decision ready $1 examples that match how often they review the business and what actions they are expected to take. A weekly $1 should surface fast moving risks and per
Yida YIn
Jun 25, 2026

How to Build a Digital Marketing Reports Dashboard: Executive Examples, KPIs, and Templates
A $1 is the control layer that helps executives and marketing leaders turn scattered channel data into fast, confident decisions. If you are a CEO, CMO, operations director, or marketing analytics lead, the real problem
Yida Yin
May 07, 2026