The AARRR framework (also known as the Pirate Metrics) is a widely used model in startup and growth marketing to track and optimize the customer journey and business growth. It was developed by Dave McClure, a well-known entrepreneur and investor.
The AARRR framework provides startups with a clear path to sustainable growth and actionable decision-making. AARRR metrics—acquisition, activation, retention, revenue, and referral—allow startups to measure every stage of the user journey, from customer acquisition to product engagement and beyond. Companies that align their product and marketing strategies with AARRR metrics experience higher conversion rates and improved campaign performance.
- Integrating AARRR metrics into product development can increase conversion rates by up to 400%.
- A 10% increase in UX budgets, guided by AARRR metrics, leads to an 83% rise in conversions.
Startups use AARRR metrics to optimize marketing campaigns, track users, and refine product features for better growth outcomes.
What Is AARRR?
AARRR Pirate Metrics Explained
In 2007, Dave McClure introduced the AARRR pirate metrics framework during a talk at Ignite Seattle. As the founder of 500 Startups and Practical Venture Capital, McClure designed the AARRR framework to help startups focus on the most important metrics for growth. The name "pirate metrics" comes from the way AARRR sounds like a pirate’s call. This framework breaks down the customer journey into five key stages. Each stage helps companies understand user behavior and improve their product and marketing strategies.
| Component | Definition |
|---|---|
| Acquisition | The first step where people find your product through marketing efforts and become visitors or leads. |
| Activation | When leads take positive actions to engage with the product, such as starting a free trial or converting to paying customers. |
| Retention | The process of keeping customers engaged and continuing to use the product over time. |
| Referral | Measures whether users like the product enough to recommend it to others, often tracked by Net Promoter Score. |
| Revenue | The stage where paying customers generate income, tracked by metrics like customer acquisition cost, LTV, MRR, and ARPU. |
The AARRR metrics framework helps startups track user-behavior metrics at every stage. It allows teams to see where users drop off and where campaigns succeed. By focusing on these five components, companies can optimize customer acquisition, activation, retention, referral, and revenue.

Why Startups Need AARRR
Startups face many challenges as they try to grow. The AARRR framework addresses these common problems:
- Acquisition: Startups must attract users in a cost-effective way. The AARRR metrics framework helps identify the best channels for customer acquisition, such as marketing campaigns or app store optimization.
- Activation: Ensuring users have a positive first experience increases customer engagement. Actions like completing onboarding or making a first purchase improve activation rates.
- Retention: Keeping users coming back shows strong customer retention and product-market fit. Analyzing churn rates and using personalized campaigns can boost retention.
- Referral: Satisfied users can drive organic growth by inviting others. Referral programs encourage users to share the product, increasing reach.
- Revenue: Monetizing the user base is key for sustainable growth. The AARRR framework helps find the right pricing and upselling strategies.
The AARRR metrics framework also prevents organizational silos. It encourages cross-functional collaboration between marketing, product, and sales teams. This approach ensures all teams work together to improve every stage of the user journey. Startups that use the AARRR framework can make better decisions, improve customer acquisition, and increase revenue. By tracking the right metrics, they can adapt quickly and achieve lasting growth.
Applying the AARRR Framework for Growth
The AARRR framework gives startups a structured approach to measure and optimize every stage of the user journey. Each metric—acquisition, activation, retention, revenue, and referral—plays a unique role in driving product-led growth and sustainable business success. FineBI, as part of FanRuan’s analytics suite, empowers teams to track, visualize, and act on these metrics for continuous improvement.
Acquisition with AARRR Metrics
Acquisition is the first step in the AARRR framework. It measures how new users discover and start interacting with a product. Startups use acquisition metrics to understand which marketing channels bring in the most valuable users and to optimize their customer acquisition strategies.
Best practices for acquisition:
- Identify user personas to target the right audience.
- Choose the most effective marketing channels, such as search engines, social media, or advertising.
- Track key acquisition metrics like website traffic, organic search traffic, cost per click (CPC), customer acquisition cost (CAC), and conversion rate.
- Use these metrics to build a strong customer base and support long-term growth.
FineBI helps startups analyze acquisition metrics by integrating data from multiple sources. Teams can visualize which campaigns drive the highest conversion metrics and adjust their marketing spend accordingly. For example, Dropbox used a referral program to boost acquisition, rewarding both referrers and new users with extra storage. This approach lowered acquisition costs and accelerated growth.
Activation for User Engagement
Activation measures how many users take meaningful actions after acquisition. This stage focuses on customer engagement and the first experience with the product. Activation metrics show if users find value quickly, such as completing onboarding or making a first purchase.
| Strategy | Description | Example App(s) |
|---|---|---|
| Behavior-based onboarding | Guide users through activation by sending messages triggered by specific user actions. | Headspace |
| Segmented onboarding | Tailor activation flows for different user segments. | Headspace, Duolingo |
| Show product value early | Highlight key features and benefits from the start. | Freeletics |
| Incentivize activation | Offer discounts or gifts to encourage activation events. | Kindle, Burger King |
| Offer in-app exclusives | Provide exclusive content for activated users. | News media apps |
| Optimize communication flow | Refine messaging based on user behavior and click rates. | Pushwoosh customers |
| Omnichannel campaigns | Use multiple channels to re-engage inactive users. | Pushwoosh customers |
Improving activation rates can lead to significant growth. A 25% increase in activation may result in a 34% rise in monthly recurring revenue within a year. Startups should define what counts as an activation event, segment users, and use behavior-based onboarding to guide them. FineBI enables teams to track activation metrics, analyze drop-off points, and test new onboarding flows.
Startups also measure customer engagement during activation by tracking onboarding completion, time-to-value, feature adoption, and churn rate. FineBI’s dashboards help visualize these metrics, making it easier to spot friction points and optimize the user experience.
Retention Strategies
Retention is the process of keeping users engaged and returning to the product over time. Retention metrics reveal how well a startup maintains customer engagement and loyalty. High retention rates indicate strong product-market fit and customer satisfaction.
Actionable retention strategies:
- Send email newsletters and push notifications to keep users informed and engaged.
- Track user behavior to identify churn points and improve features.
- Engage loyal customers to learn what they value most.
- Provide responsive customer support to reduce churn.
- Continuously enhance the user experience and popular features.
- Measure session duration and repeat visits to gauge engagement.
FineBI supports retention analysis by calculating retention metrics over different time frames, such as weekly or monthly. Teams can use FineBI to monitor user cohorts, identify reasons for churn, and implement targeted campaigns to boost customer retention.
Retention is often more cost-effective than acquisition. Startups that focus on retention maximize the value of each user and create a stable foundation for growth.
Revenue Optimization
Revenue is the stage where startups monetize their user base. Revenue metrics track how much income the product generates and help teams refine their monetization strategies.
Effective revenue optimization tactics:
- Upsell and cross-sell with relevant recommendations.
- Use personalized pricing for different customer segments.
- Streamline the checkout process to increase conversion metrics.
- Track metrics like Average Order Value (AOV), Conversion Rate, and Customer Lifetime Value (CLV).
- Retarget abandoned carts and offer exclusive deals to returning users.
- Bundle products or use tiered pricing to boost transaction value.
- Leverage subscription models for recurring revenue.
Startups monitor revenue metrics such as Monthly Recurring Revenue (MRR), Average Revenue Per User (ARPU), revenue growth rate, and CLV. FineBI provides real-time dashboards to track these metrics, helping teams spot trends and optimize pricing or upselling strategies.
Ongoing analysis of revenue metrics, combined with insights from other AARRR stages, enables startups to drive sustainable growth and maximize profitability.
Referral and Viral Growth
Referral measures how many users recommend the product to others. Referral metrics show the effectiveness of word-of-mouth and viral growth strategies. This stage can turn satisfied users into advocates, expanding the customer base at a low cost.
Grammarly and Airbnb both achieved viral growth by implementing referral programs that rewarded users for inviting friends. These programs integrated with CRM and in-app platforms, used scoring models to identify loyal customers, and triggered targeted invitations to maximize impact. Referral marketing software enabled real-time tracking and optimization of these campaigns.
| Metric | Description |
|---|---|
| Percentage of customers who refer friends | Share of customers making referrals. |
| Number of referred customers | New customers acquired through referrals. |
| Percentage of total purchases by referred customers | Contribution of referred customers to sales. |
| Lifetime value of referred customers | Long-term revenue from referred customers. |
| Positive reviews | Customer satisfaction and endorsement. |
| Social media shares | Frequency of sharing on social platforms. |
| Sent invitations & successful invitations | Number of invites sent and converted. |
| Viral coefficient | Average new customers generated per existing customer. |
| Viral cycle time | Speed of referral-driven customer acquisition. |
| Net Promoter Score (NPS) | Customer loyalty and likelihood to recommend. |
FineBI enables startups to calculate referral metrics, such as the viral coefficient and K-factor, and visualize the impact of referral campaigns. Teams can identify which users drive the most referrals and design targeted incentives to encourage more sharing.
Referral strategies, when combined with strong customer engagement and retention, can accelerate growth and create a self-sustaining user acquisition engine.
Tracking AARRR Metrics with FineBI
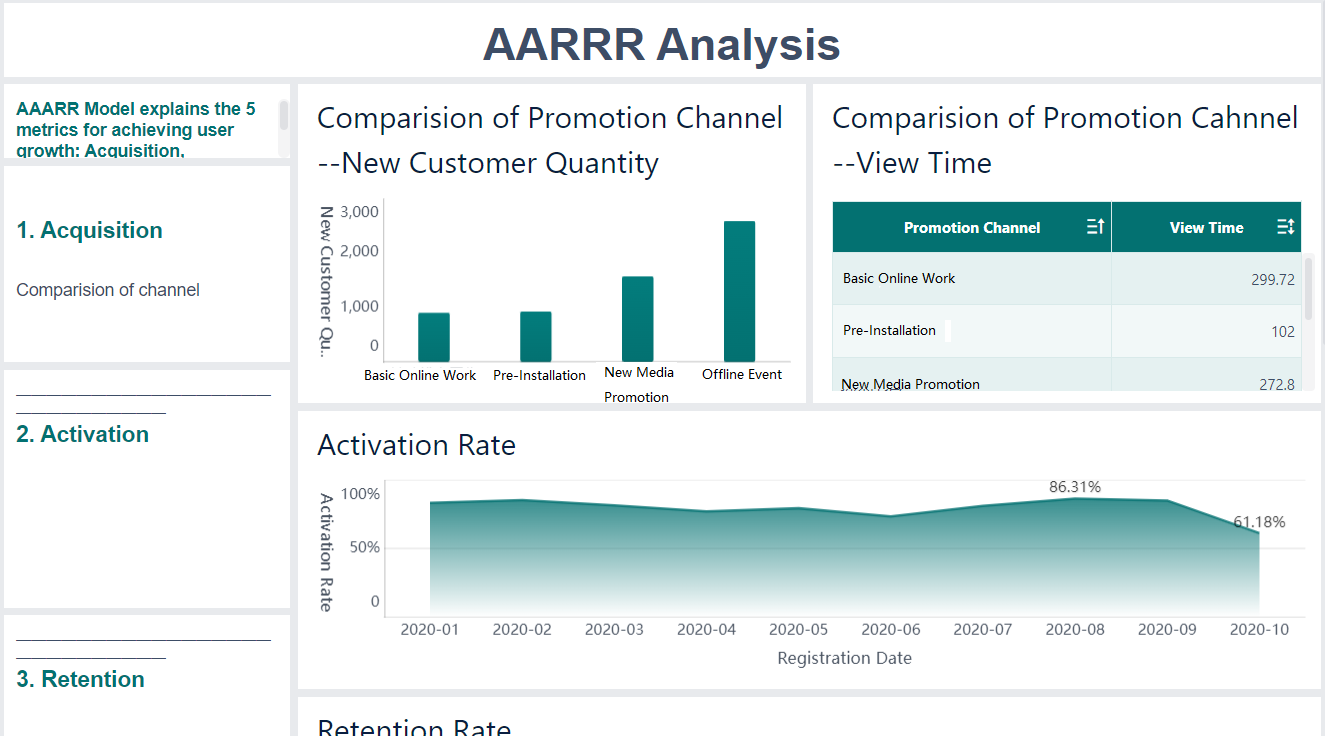
FineBI gives startups the tools to track and analyze AARRR metrics across every stage of the user journey. The platform connects to many data sources, including databases, files, and APIs. This integration helps teams collect all their user data in one place. FineBI then transforms this data into clear dashboards and charts, making it easy to see trends and patterns.
The table below shows how FineBI supports each AARRR metric stage with specific features and examples:
| AARRR Metric Stage | FineBI Feature Supporting Analysis | Example / Explanation |
|---|---|---|
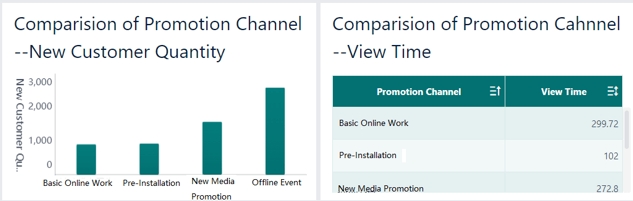
| Acquisition | Channel analysis by quantity and quality | Uses average browsing time to evaluate customer quality; identifies best channels like offline activities |
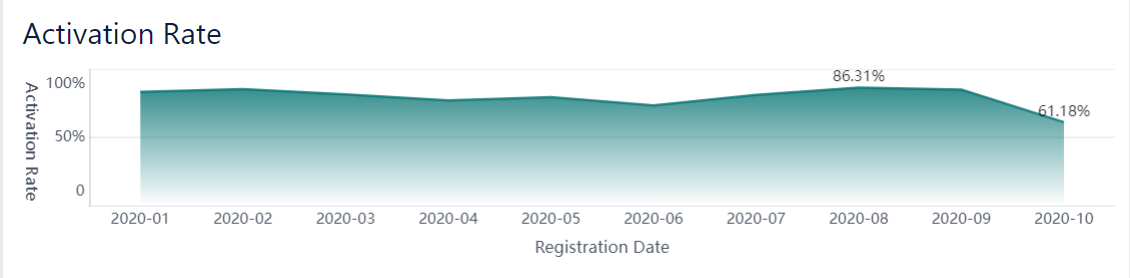
| Activation | Tracks user engagement with core product functions | Defines activation as users who have purchased once; analyzes monthly activation rates and trends |
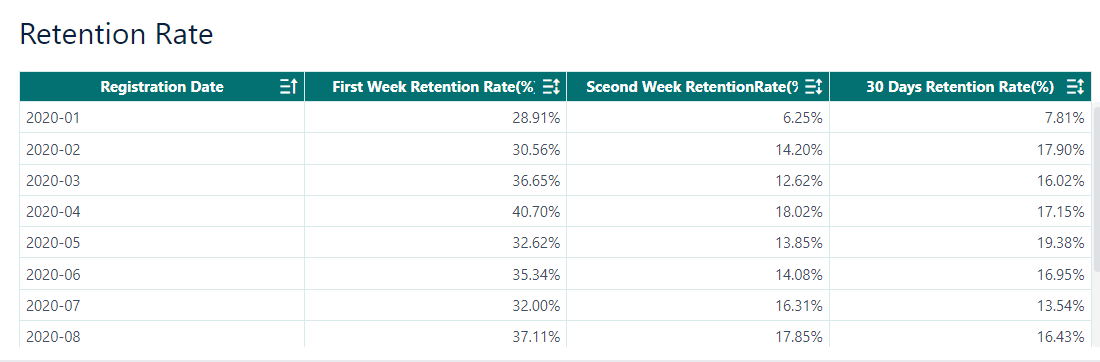
| Retention | Calculates retention rates over different periods (1 week, 2 weeks, 30 days) | Retention analysis helps identify user loss and improve product experience |
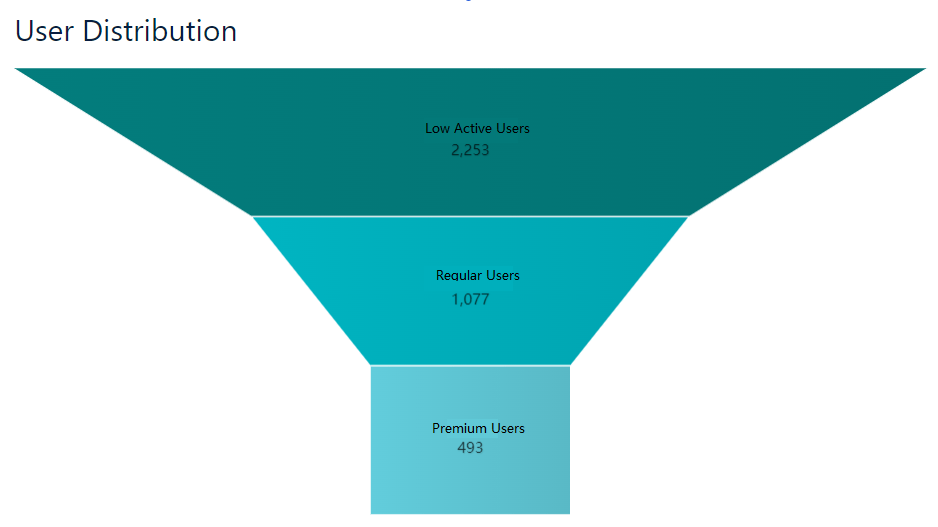
| Revenue | Segments users by activity level and visualizes with funnel charts | Categorizes users into low active, ordinary, and members to identify revenue potential |
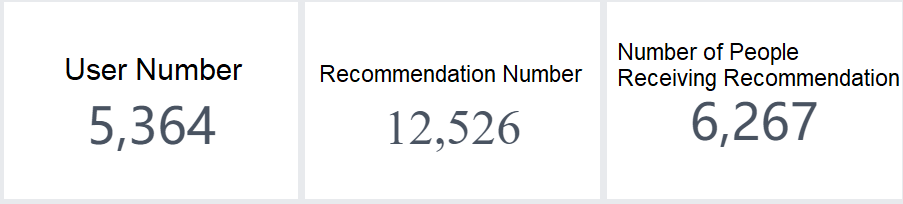
| Referral | Measures K-factor (recommendation coefficient) to assess self-propagation power | Calculates K value to evaluate viral growth potential; suggests operational activities to increase K |
Start Free Trial of FineBI to unlock your business potential with AARRR framework.

FAQ

The Author
Lewis
Senior Data Analyst at FanRuan
Related Articles
Unlocking Startup Success with the AARRR Metrics Framework
Use the AARRR metrics framework to boost startup growth by optimizing acquisition, activation, retention, revenue, and referral strategies.
Lewis
Jul 14, 2025

Perform Market Basket Analysis to Upgrade Your Business
Follow a clear step-by-step guide to perform market basket analysis, from data preparation to generating association rules and interpreting actionable insights.
Lewis
Jul 14, 2025
Understand Customer Loyalty Analytics with Data and Metrics
Use customer loyalty analytics to track key metrics, boost retention, and improve satisfaction with actionable data-driven insights for your business.
Lewis
Jul 14, 2025