Market basket analysis is an analysis method that associates two different products and explores their relations by analyzing user consumption data. Market basket analysis helps businesses find patterns in customer purchases. To perform market basket analysis, analysts collect transaction data, prepare and encode it, apply algorithms, generate association rules, and then interpret the results. This process reveals which products customers often buy together. Companies use these insights to improve cross-selling, create targeted promotions, and manage inventory more effectively. Many retailers and e-commerce platforms rely on market basket analysis to boost sales, personalize marketing, and optimize store layouts.

Market basket analysis is a technique in data science application that helps businesses discover patterns in large sets of transaction data. In data mining literature, experts define market basket analysis as a method within association rule mining. This method focuses on finding meaningful patterns, especially frequent itemsets, from transactional databases. The main goal is to identify items that are frequently purchased together. Analysts use algorithms like Apriori and FP-Growth to find these patterns. Market basket analysis does not rely on strict assumptions, which makes it flexible for many types of data. Businesses use this approach to understand customer buying habits and to uncover relationships between products. This process helps companies make better decisions about product placement and marketing strategies.
Market basket analysis plays a key role in retail and e-commerce. Companies want to know which products are frequently purchased together so they can improve sales and customer satisfaction. The primary objectives include:
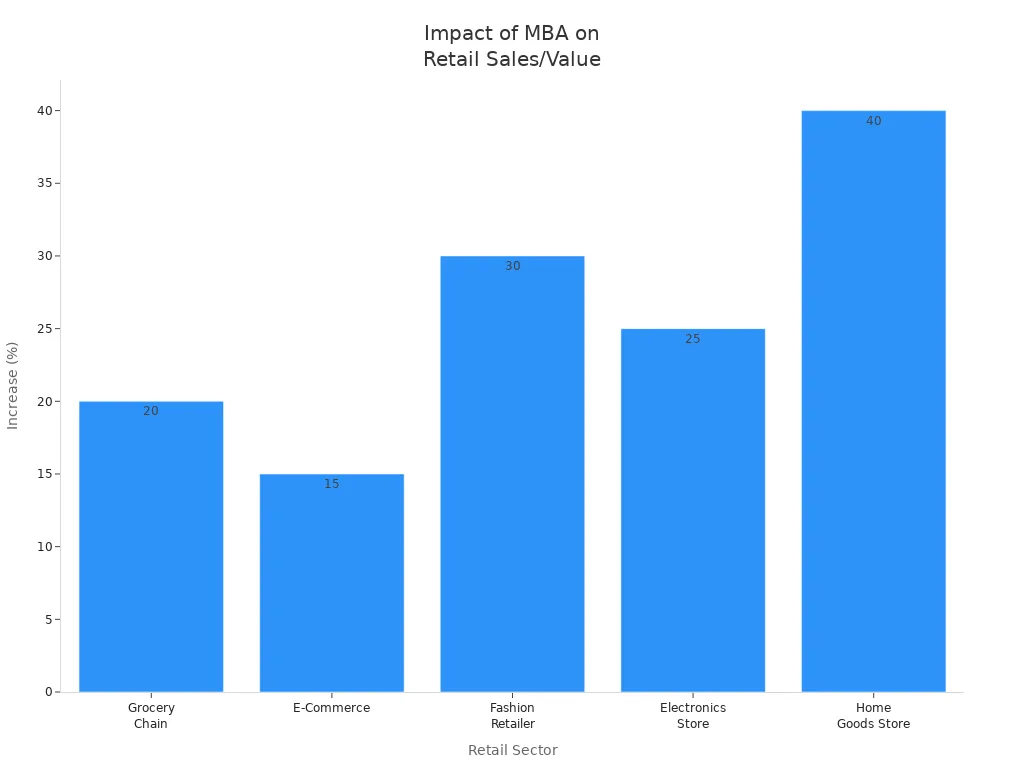
Market basket analysis supports many business goals. For example, grocery chains have used it to place diapers and baby wipes together, leading to a 20% increase in sales for both products. E-commerce platforms link novels and music genres, raising sales by 15%. Fashion retailers bundle handbags with dresses, increasing accessory sales by 30%. The table below shows how different sectors benefit from this analysis:
| Retail Sector | MBA Application | Outcome / Impact |
|---|---|---|
| Grocery Chain | Optimized store layout by placing diapers and baby wipes together | 20% increase in sales of both products |
| E-Commerce | Personalized recommendations linking novels and music genres | 15% increase in sales of books and music |
| Fashion Retailer | Bundled offers (e.g., discount on handbags with dresses) | 30% increase in accessory sales |
| Electronics Store | Bundle deals on gaming consoles with controllers and games | 25% increase in average transaction value |
| Home Goods Store | Package deals on coffee machines and premium coffee beans | 40% increase in coffee-related product sales |
Market basket analysis helps companies identify cross-selling opportunities, manage inventory, and create targeted promotions. This technique gives businesses a deeper understanding of what drives customers to buy certain products together.
The first step in market basket analysis involves preparing transaction data. Analysts collect raw transaction records, which usually include transaction IDs, customer IDs, item names, quantities, and timestamps. Clean data forms the foundation for accurate analysis. Data cleaning often presents several challenges:
Tip: Focusing on top-selling items or using data sampling can help manage large datasets and speed up the analysis.
After cleaning, analysts must encode the data for association rule learning. Most algorithms require a binary matrix that shows whether each item appears in each transaction. One-hot encoding is the most common technique for this step. Each row represents a transaction, and each column represents an item. A value of 1 means the item was purchased in that transaction; 0 means it was not.
Other encoding methods, such as frequency encoding, can reduce the number of features and improve computational efficiency, especially when the dataset contains thousands of unique items. The table below compares one-hot encoding and frequency encoding:
| Aspect | One-Hot Encoding | Frequency Encoding |
|---|---|---|
| Dimensionality | High (many features) | Low (fewer features) |
| Computational Efficiency | Lower | Higher |
| Information Preservation | High | May lose detail |
Note: One-hot encoding is preferred for algorithms like Apriori, but frequency encoding may be better for very large item sets.
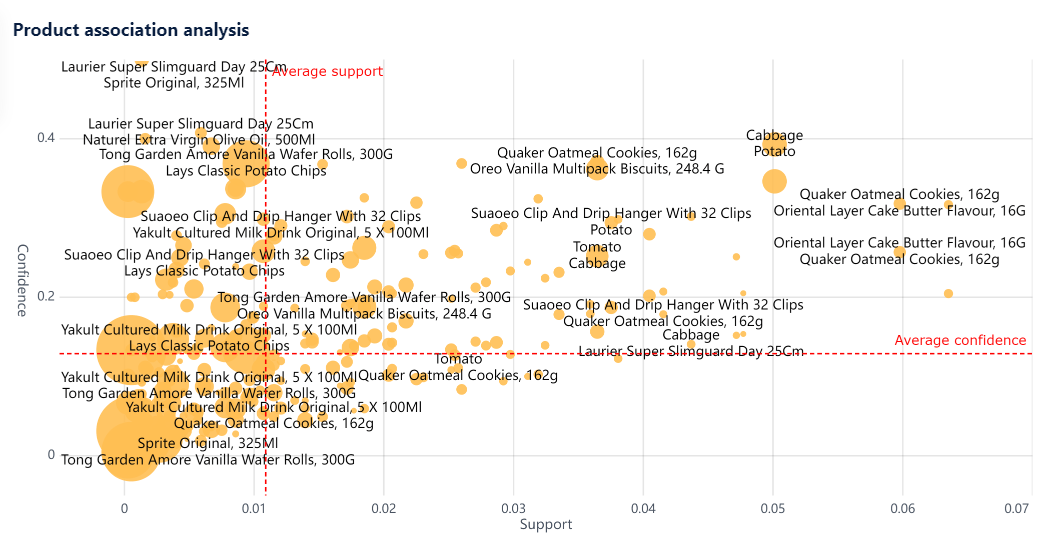
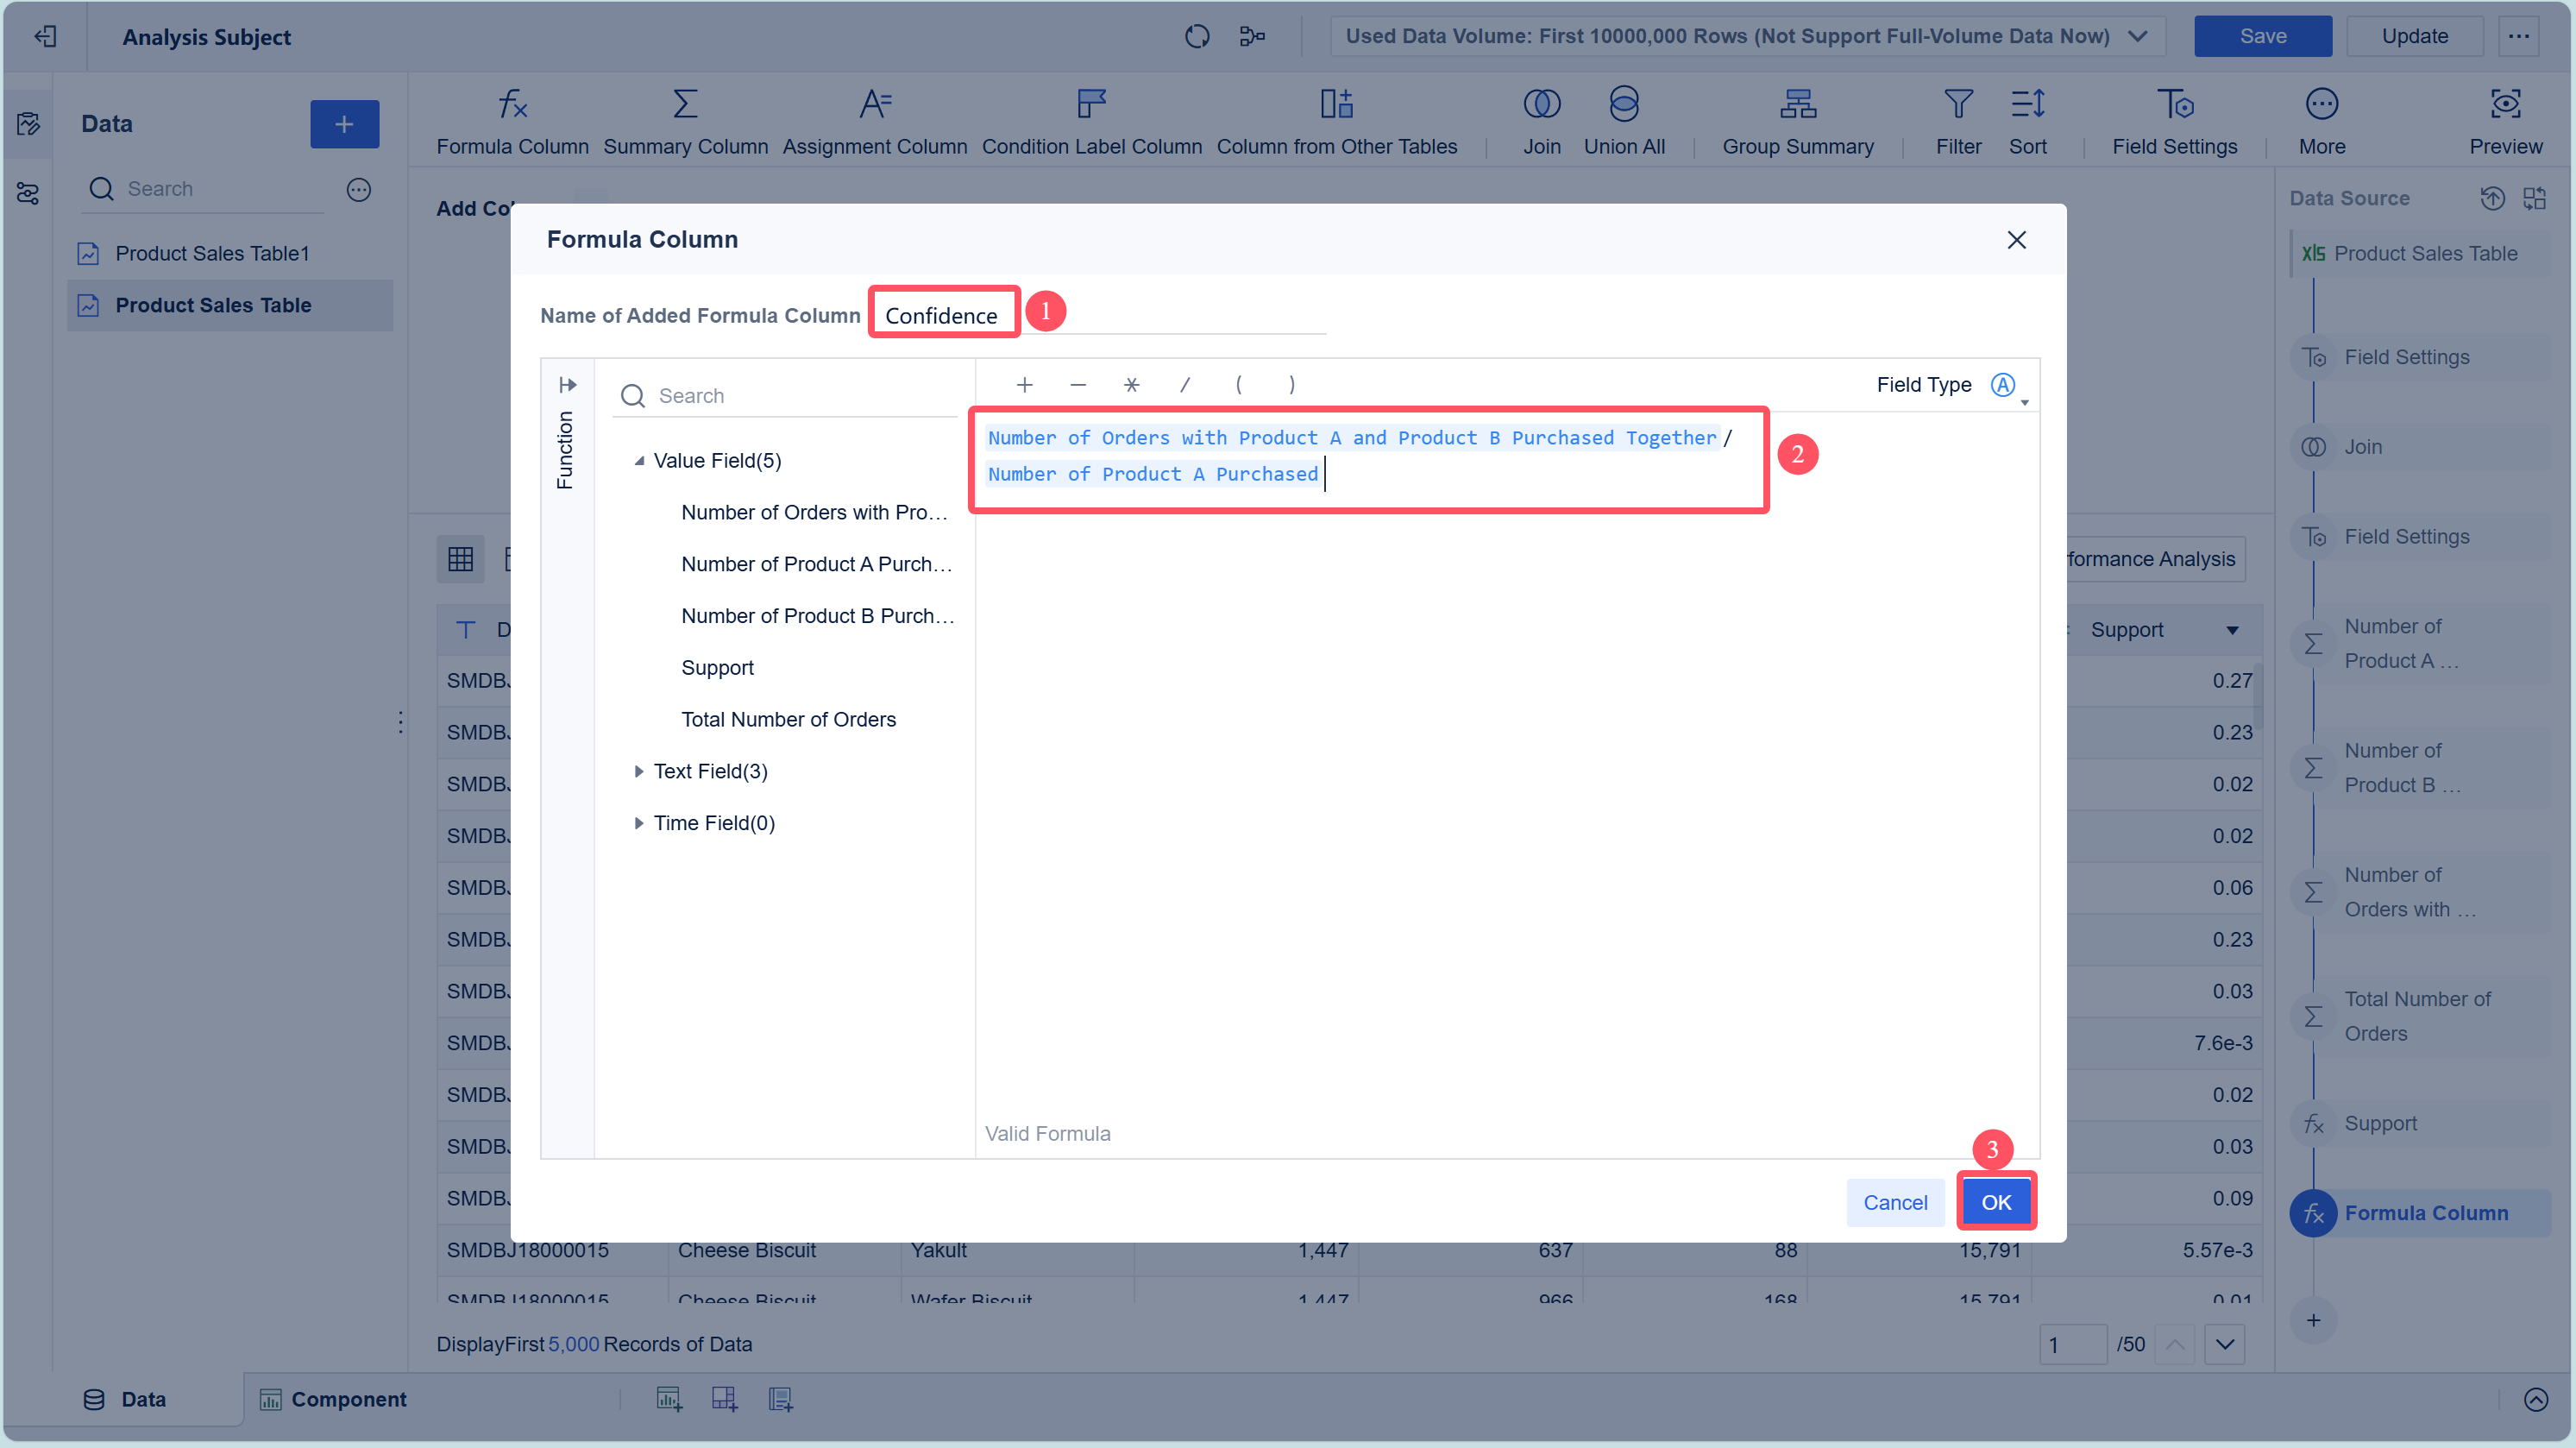
Analysts must set thresholds for support and confidence before running association rule learning algorithms. Support measures how often an itemset appears in the dataset. Confidence measures how likely customers are to buy one item if they have already bought another. Industry standards suggest a minimum support of 1-2% and a minimum confidence of about 40%. These values help filter out rare or unreliable patterns.
Lowering the support threshold increases the number of rules but may include less meaningful associations. Raising the confidence threshold results in fewer, stronger rules. Analysts should adjust these values based on business needs and dataset size.
Tip: Start with support at 2% and confidence at 40%, then adjust as needed to balance rule quantity and quality.
The next step is to find frequent item sets—groups of products that appear together in transactions more often than the support threshold. Analysts use algorithms such as Apriori, FP-Growth, or vertical data format methods like Eclat.
| Algorithm | Key Principle | Advantages for Large Datasets |
|---|---|---|
| Apriori | Candidate generation, breadth-first | Simple, prunes search space |
| FP-Growth | FP-tree, depth-first, no candidates | Fast, memory efficient, fewer database scans |
| Eclat | Transaction ID lists, set intersection | Reduces memory, speeds up mining |
Apriori is easy to understand and implement, but it can be slow with large datasets because it generates many candidate itemsets and scans the database multiple times. FP-Growth is faster and more memory-efficient, especially for large datasets, because it compresses data and avoids candidate generation.
Once frequent itemsets are identified, analysts generate association rules. The process follows these steps:
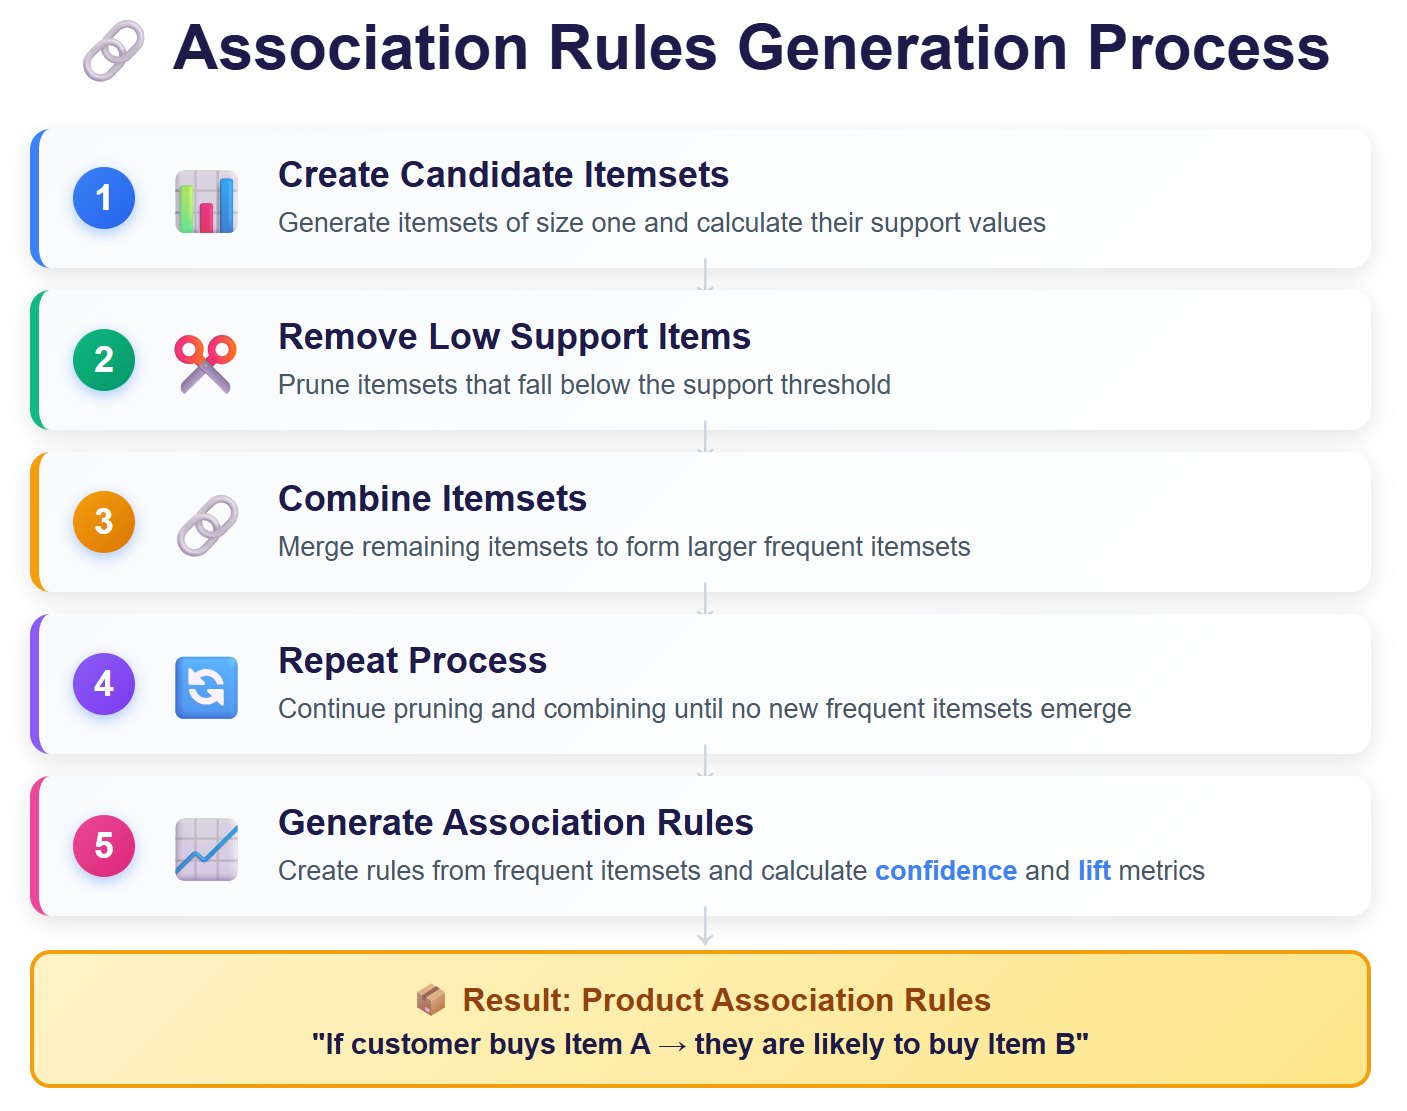
Association rules take the form "If a customer buys item A, they are likely to buy item B." Analysts use these rules to discover which products are frequently purchased together.
Interpreting association rules is crucial for turning analysis into business action. Analysts focus on three main metrics:
| Metric | What It Measures | Why It Matters |
|---|---|---|
| Support | Frequency of itemsets in all transactions | Shows how common the pattern is |
| Confidence | Likelihood of buying B after buying A | Indicates rule strength |
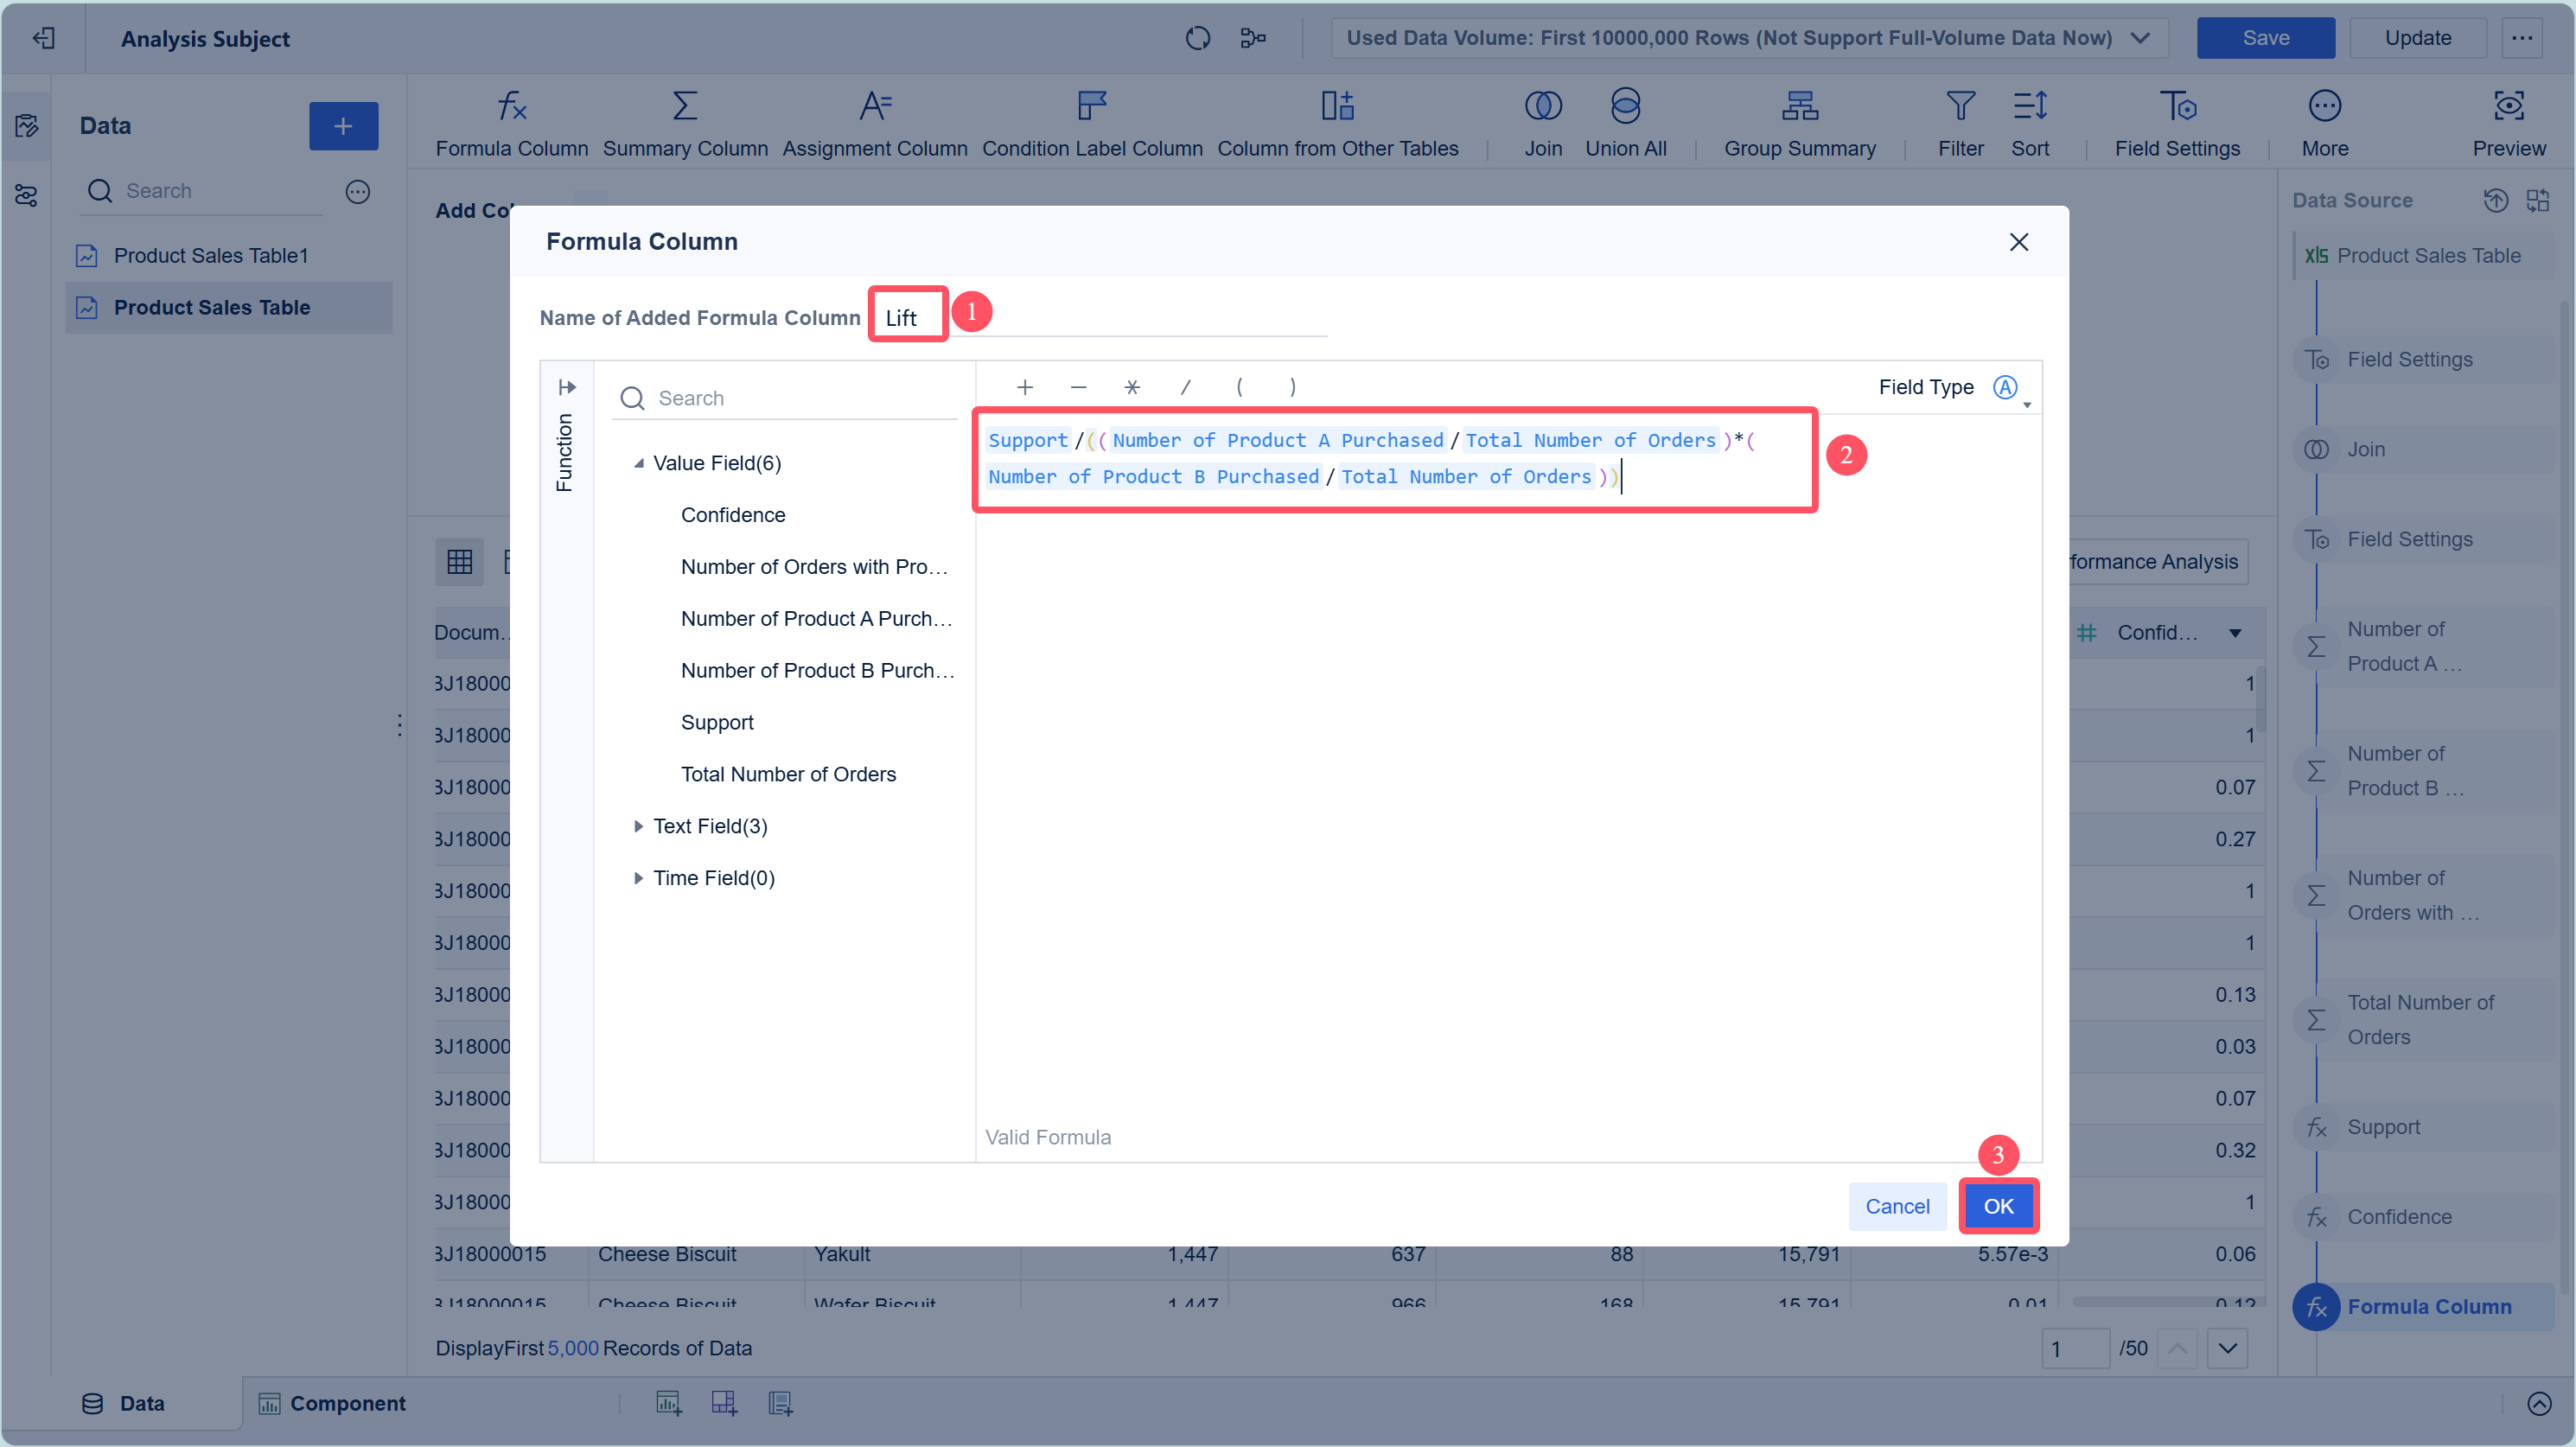
| Lift | Strength of association beyond random chance | Reveals true product relationships |
Lift is calculated as the ratio of observed support for both items to the expected support if the items were independent. A lift value greater than 1 indicates a positive association. For example, a lift of 2 means customers are twice as likely to buy both items together compared to random chance.
For more details about market basket analysis procedure, refer to the Help Document.
Best Practices for Interpretation:
- Prioritize rules with high support, confidence, and lift.
- Filter out trivial or weak rules using business knowledge.
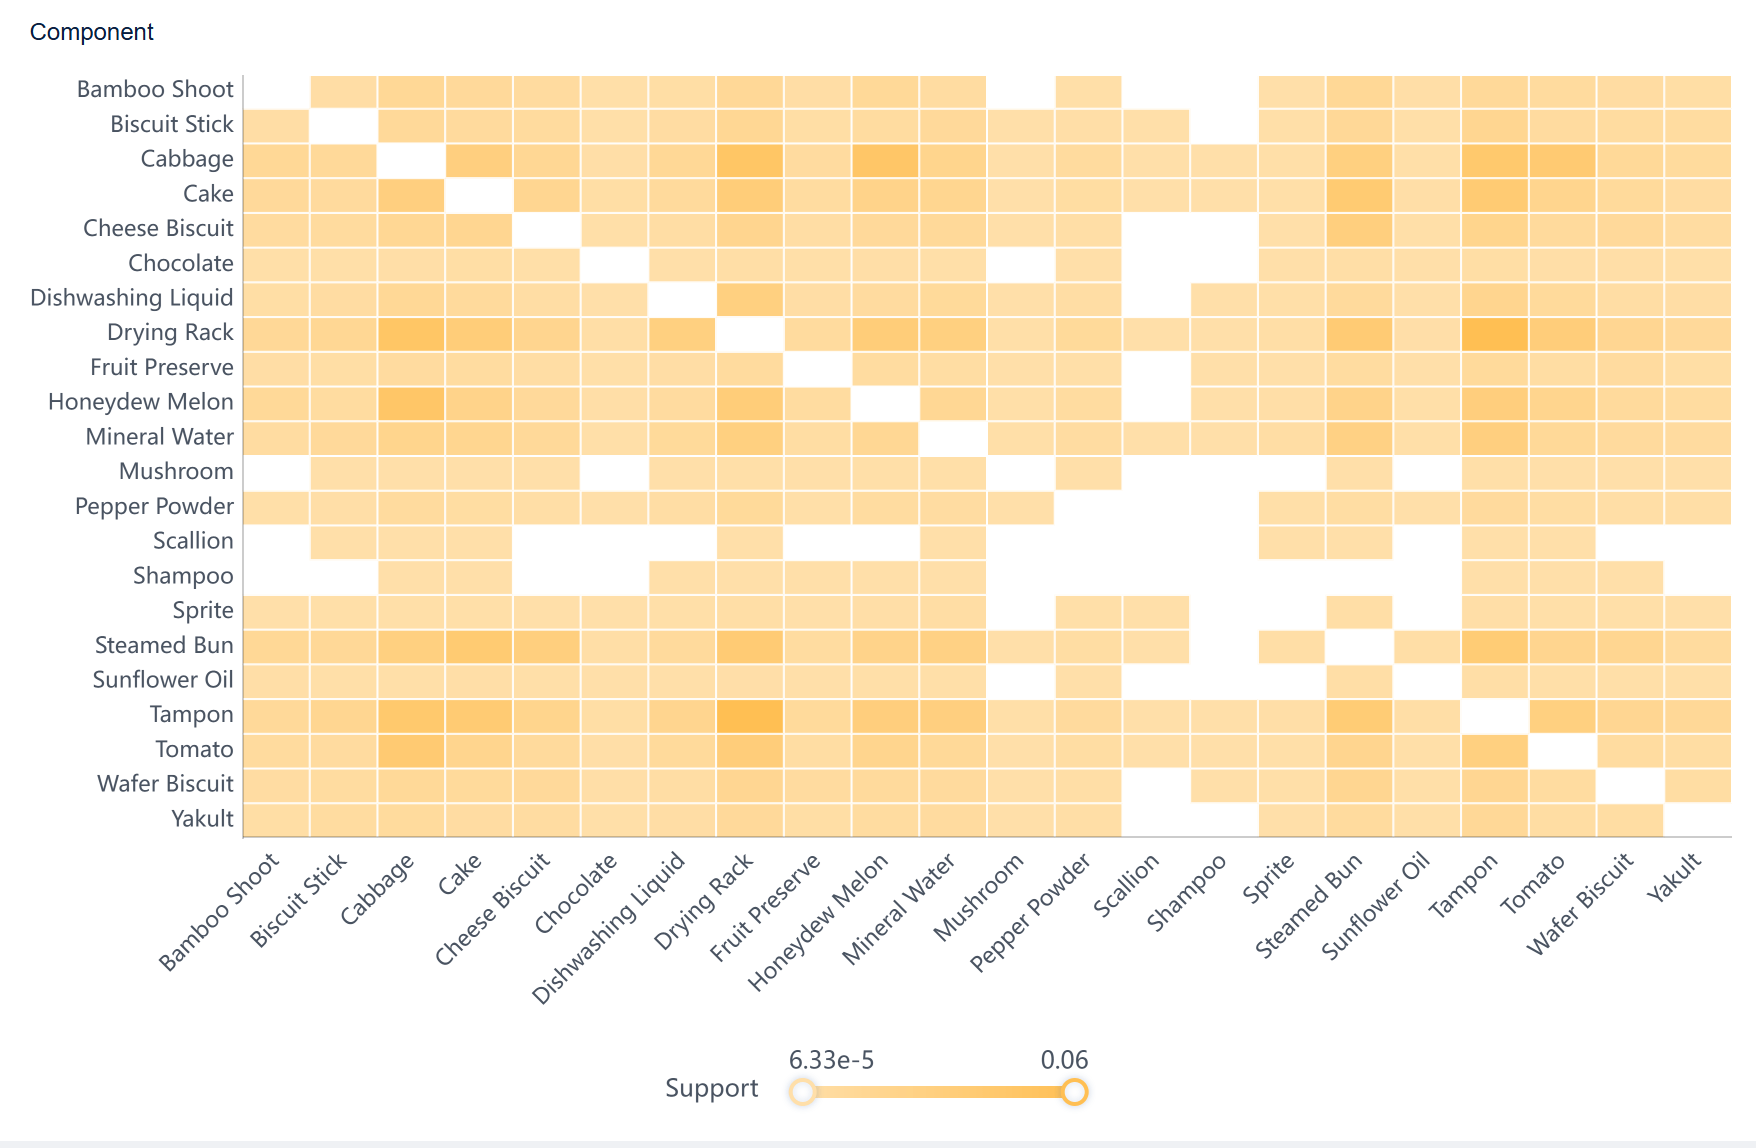
- Visualize rules with charts or heatmaps to spot patterns.
- Validate rules with statistical tests or pilot programs.
- Apply rules to real business scenarios, such as cross-selling or product placement.
Common pitfalls include poor data quality, improper metric selection, and misinterpreting complex results. Analysts should always clean and filter data thoroughly, choose metrics that align with business goals, and use visualization tools to clarify findings. Combining market basket analysis with other methods and understanding the business context ensures that insights lead to effective strategies.
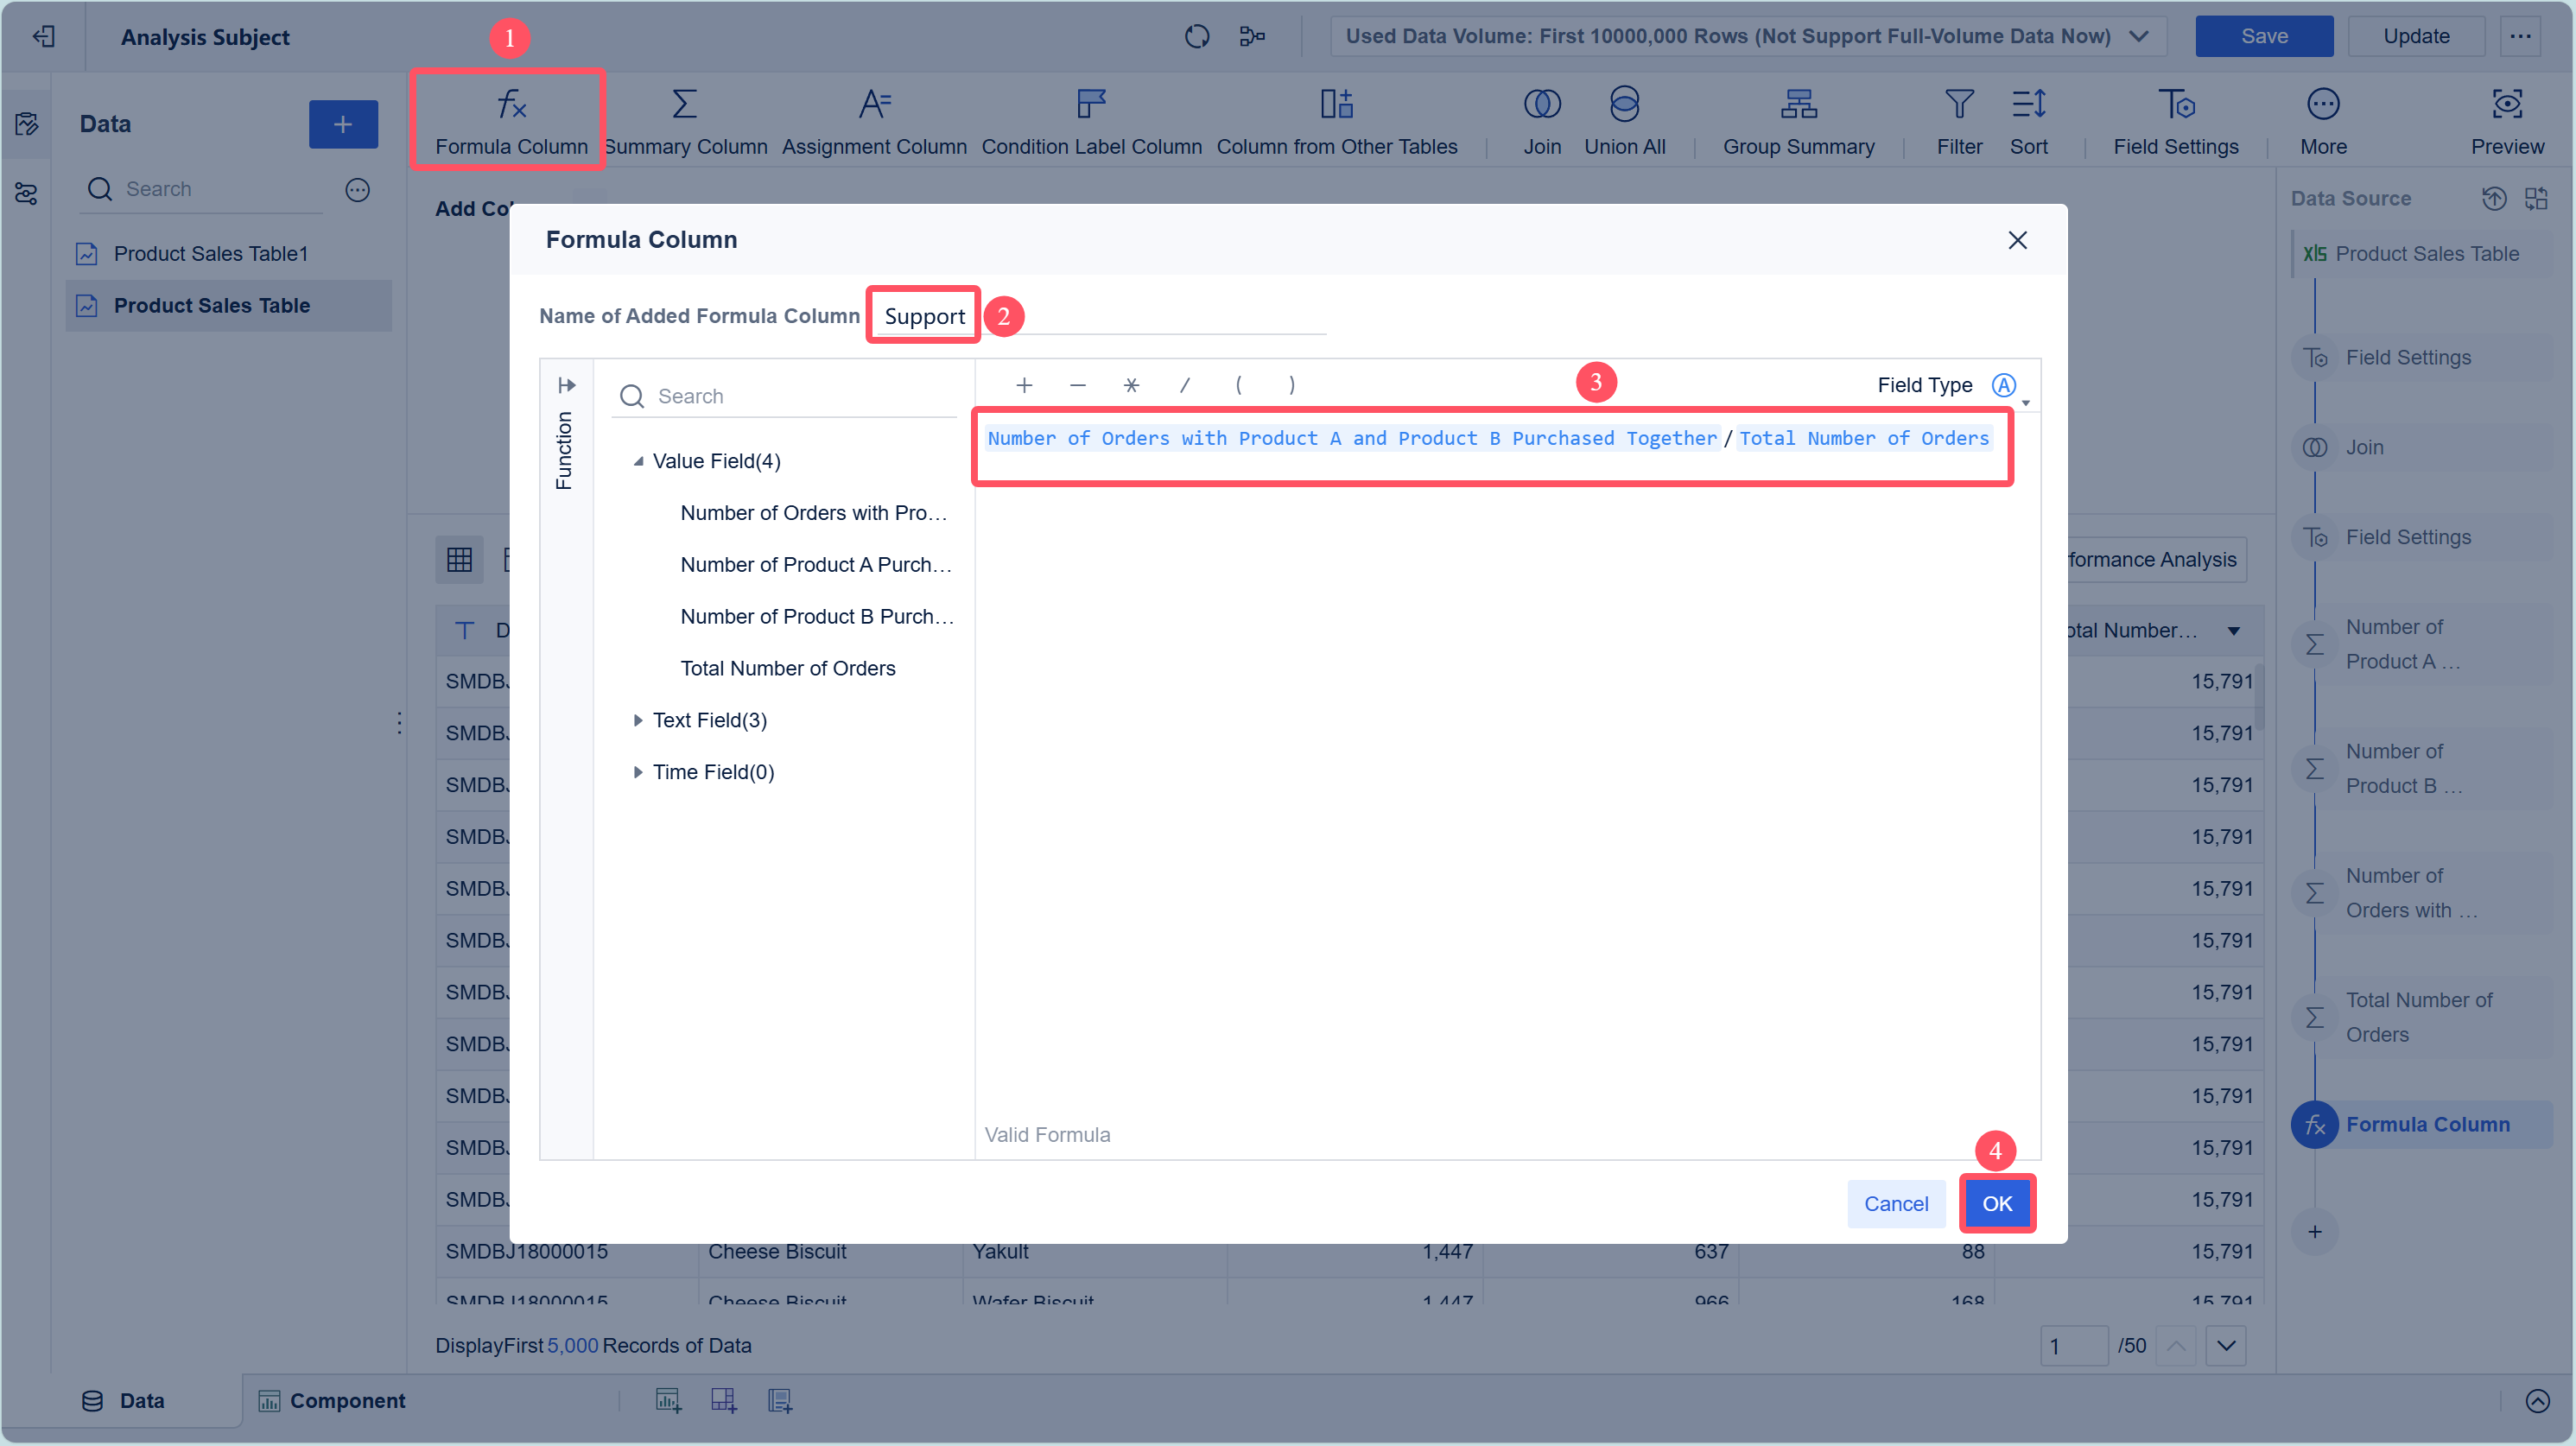
FineBI offers a streamlined workflow for market basket analysis. The platform guides users through four main stages: data integration, data processing, visual exploration, and publishing. Each stage supports users in preparing and analyzing transaction data. FineBI’s self-service analytics tools allow business users to perform complex analyses without coding. The workflow ensures that users can move from raw data to actionable insights quickly.
To explore more functions of FineBI, refer to the product guide.
Market basket analysis empowers businesses to understand customer buying patterns, optimize inventory, and develop effective pricing and promotional strategies. FineBI enables teams to uncover these insights efficiently and visually. Companies can advance their analytics by exploring cohort analysis, path analysis, and attribution modeling. Integrating multiple data sources and leveraging advanced tools helps organizations stay competitive and continuously improve decision-making.

What is Pareto Chart and How Does it Work
How DuPont Analysis Helps You Understand Your Business

The Author
Lewis
Senior Data Analyst at FanRuan
Related Articles
What is Ecommerce Analytics and Why Does It Matter
Ecommerce analytics helps online stores track data, optimize sales, and enhance customer experience for better growth and profitability.
Lewis
Jan 04, 2026
What is Ad-Hoc Analysis and Why is it Important
Ad-hoc analysis lets you answer unique business questions instantly, offering flexible, real-time insights that drive smarter, faster decisions.
Lewis
Sep 16, 2025

What Is a Data Model and Why Does It Matter
A data model defines how data is structured and connected, making information easier to manage, analyze, and use for smarter business decisions.
Lewis
Aug 04, 2025


