You can transform your business by understanding customer loyalty through data. Customer loyalty analytics gives you the facts you need to measure, track, and improve how customers interact with your brand. When you focus on customer loyalty, you see real growth in retention and satisfaction. Analyzing customer loyalty helps you spot patterns and make better decisions. Tools like FineBI from FanRuan let you leverage your data, turning raw numbers into clear insights. Customer loyalty analytics empowers you to create stronger relationships and drive long-term success.
Customer Loyalty Analytics Overview
What Is Customer Loyalty Analytics?
Customer Loyalty Analytics refers to the process of collecting, analyzing, and interpreting customer behavior data to understand how loyal your customers are—and why.
Customer loyalty analytics helps you understand how and why customers stay with your brand. You use technology and data to track customer behavior, preferences, and satisfaction. This process gives you a 360-degree view of your customers. You can see their purchase history, feedback, and how they interact with your business across different channels.
Customer loyalty analysis uses data from many sources, such as transaction histories, surveys, social media, and loyalty program engagement. You collect this information and analyze it with business intelligence tools. These tools help you spot trends, measure satisfaction, and predict future actions. You can segment your customers, personalize their experiences, and respond quickly to their needs.
Here is a quick look at the main steps in customer loyalty analytics:
- Set clear goals, like improving customer retention or increasing Net Promoter Score (NPS).
- Gather data from multiple sources, including website activity and customer feedback.
- Analyze the data to find patterns and insights.
- Create strategies to boost satisfaction and loyalty, such as loyalty programs or better customer service.
- Use advanced analytics and AI to make the process faster and more accurate.
- Train your team to use these insights across your company.
Why Customer Loyalty Matters
Customer loyalty analysis is vital for your business growth. Loyal customers buy more, stay longer, and recommend your brand to others. When you focus on customer retention, you spend less on finding new customers. Studies show that keeping a customer costs much less than acquiring a new one. In fact, a 5% increase in loyalty can boost your profits by up to 86%. Loyal customers are also six times more likely to engage with your brand and respond to your marketing.
| Metric | Impact |
|---|---|
| Cost to recruit vs retain | 15-22x more expensive to recruit new customers |
| Profit increase | 5% loyalty boost can raise profits by up to 86% |
| Brand loyalty and market share | Loyalty links to higher market share (0.87 correlation) |
| Customer behavior | Loyal customers engage and repurchase more often |
Brand loyalty helps you build long-term relationships and stand out in a crowded market. By analyzing customer loyalty, you can improve every step of the customer journey and create a strong foundation for your business.
Key Metrics of Customer Loyalty Analytics
Understanding customer loyalty starts with tracking the right customer loyalty metrics. These metrics help you measure how well your loyalty programs work and where you can improve. FineBI by FanRuan makes it easy to track, visualize, and analyze these metrics by connecting data from all your systems. When you integrate data from sources like CRM, POS, and ecommerce, you get a complete view of your customers and their loyalty behaviors.

Retention Rate
Customer retention rate shows how many customers stay with your brand over time. You calculate it using this formula:
Retention Rate = ((E - A) / S) × 100
Where:
- E = Number of customers at the end of the period
- A = Number of new customers acquired during the period
- S = Number of customers at the start of the period
| Industry | Average Customer Retention Rate (CRR) | Notes |
|---|---|---|
| SaaS | Approximately 68% (range: 55%-72%) | Good CRR ≥ 70%, Top performers > 85% |
| Retail | About 63% | Industry benchmark for retail |
Net Promoter Score (NPS)
Net Promoter Score measures how likely your customers are to recommend your brand. You ask customers to rate you from 0 to 10. Promoters score 9-10, Passives 7-8, and Detractors 0-6. Subtract the percentage of Detractors from Promoters to get your NPS. Scores above 50 are excellent in e-commerce.
| Industry | Typical NPS Range / Benchmark | Notes |
|---|---|---|
| E-commerce | Mid-40s to 50s | Above 50 is excellent |
| Hospitality | Lower and more variable | Pandemic impact |
| General B2C | 16 to 80 | Wide variation |
FineBI dashboards help you visualize NPS trends and compare them to your loyalty programs’ performance.

Customer Lifetime Value (CLV)
Customer lifetime value tells you how much revenue you can expect from a customer during their relationship with your brand. Use this formula:
- CLV = Average Purchase Value × Average Purchase Frequency × Average Customer Lifespan
For subscription models, use:
- CLV = (Average Revenue per Customer per Period × Gross Margin) / Customer Churn Rate
FineBI enables you to calculate and monitor CLV by combining sales, subscription, and loyalty program data. This helps you focus on high-value customers and improve your loyalty programs.
Repeat Purchase Rate
Repeat purchase rate shows the percentage of customers who buy from you more than once. Calculate it as:
Repeat Purchase Rate = (Number of Repeat Customers / Total Number of Customers) × 100
| Category/Product Type | Typical Repeat Purchase Rate (%) |
|---|---|
| Overall eCommerce Average | 15% - 30% (avg. ~28.2%) |
| Consumable Products | Up to 40% - 45% |
| High-ticket/Durable Goods | 10% - 15% |
| Healthy Online Store Rate | Above 20% |
| Top-performing eCommerce | 40% or higher |
Additional Metrics
You should also monitor other customer loyalty metrics, such as customer satisfaction score (CSAT), cross-sell and up-sell rates, customer effort scores, churn rate, and likelihood to renew. FineBI brings all these metrics together by integrating data from multiple sources. This unified approach gives you a 360-degree view of your loyalty programs and customer loyalty, helping you make smarter decisions and improve your program’s success.
Tip: Integrating data from all your systems with FineBI ensures your customer loyalty metrics are accurate and actionable. This helps you personalize loyalty programs, improve customer satisfaction, and drive long-term loyalty.
Customer Loyalty Analytics Process
Data Preparation
You start customer loyalty analysis by preparing your data. This step ensures you work with accurate and useful information. Begin by collecting data from different sources, such as social media, transaction records, and customer feedback. You want to understand your customers’ needs and behaviors, so gather as much relevant information as possible.
Next, segment your customers. Group them by their actions, preferences, or demographics. This helps you tailor your loyalty programs and track how different groups respond. Use automated tools like ETL (extract, transform, load) to bring data together from systems like CRM, e-commerce, and web platforms. Cleanse your data by removing duplicates and correcting errors. Standardize formats so everything matches. This makes your customer loyalty analysis more reliable.
Track key metrics, such as redemption rate, engagement rate, and participation rate. Align your data efforts with your business goals. When you use predictive analytics, you can forecast future customer behavior and personalize rewards. This proactive approach helps you get the most out of customer loyalty analysis. Here are the detailed steps of the data preparation process in FineBI.
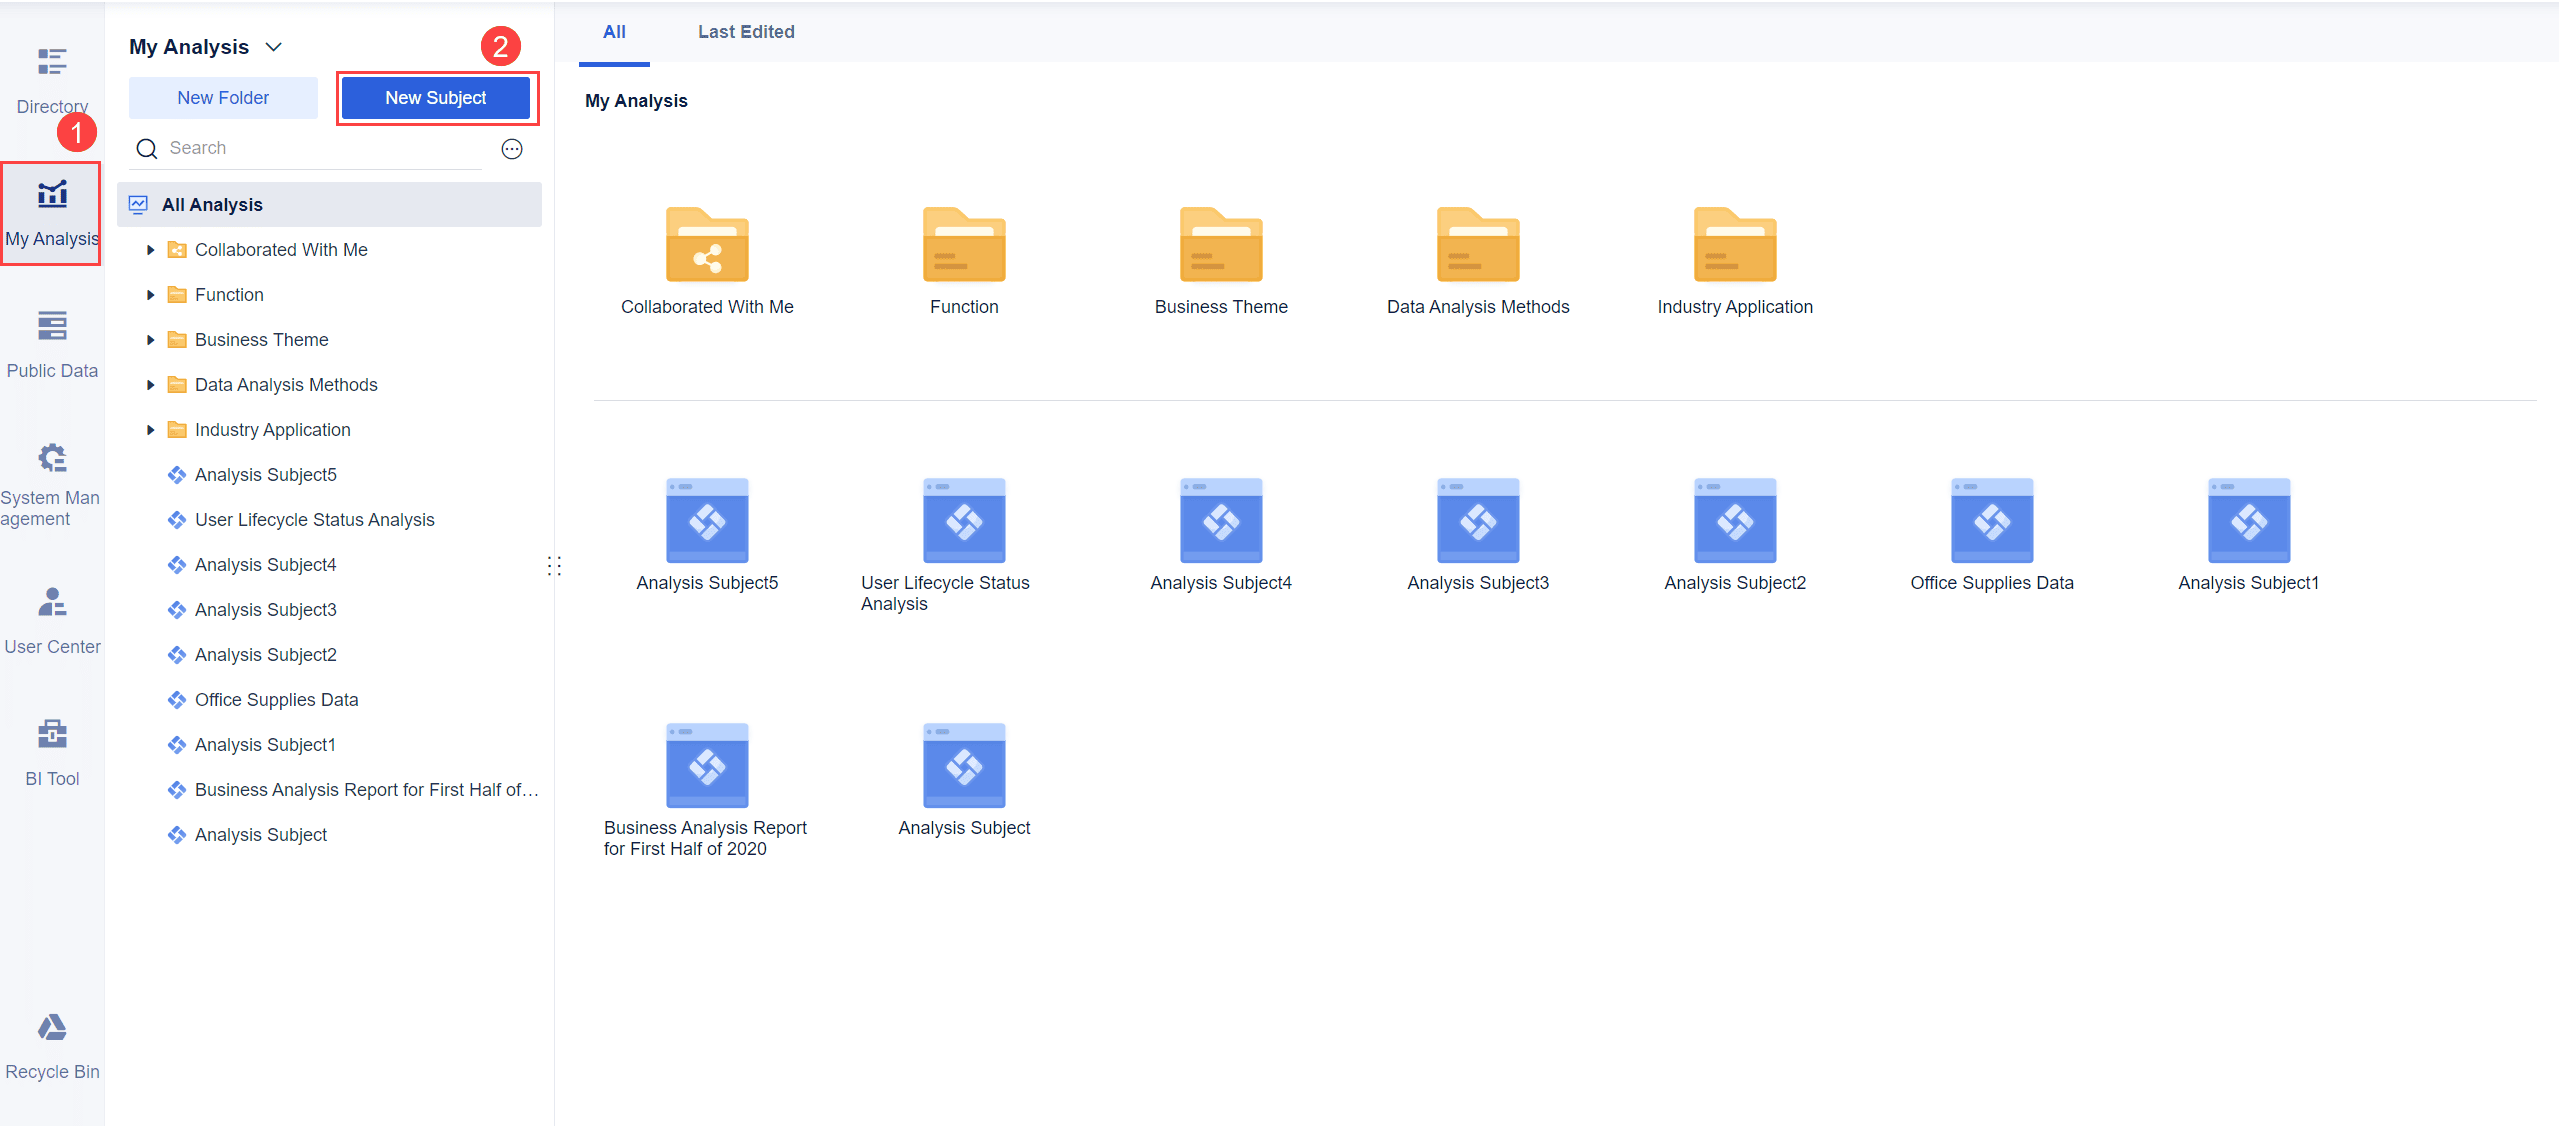
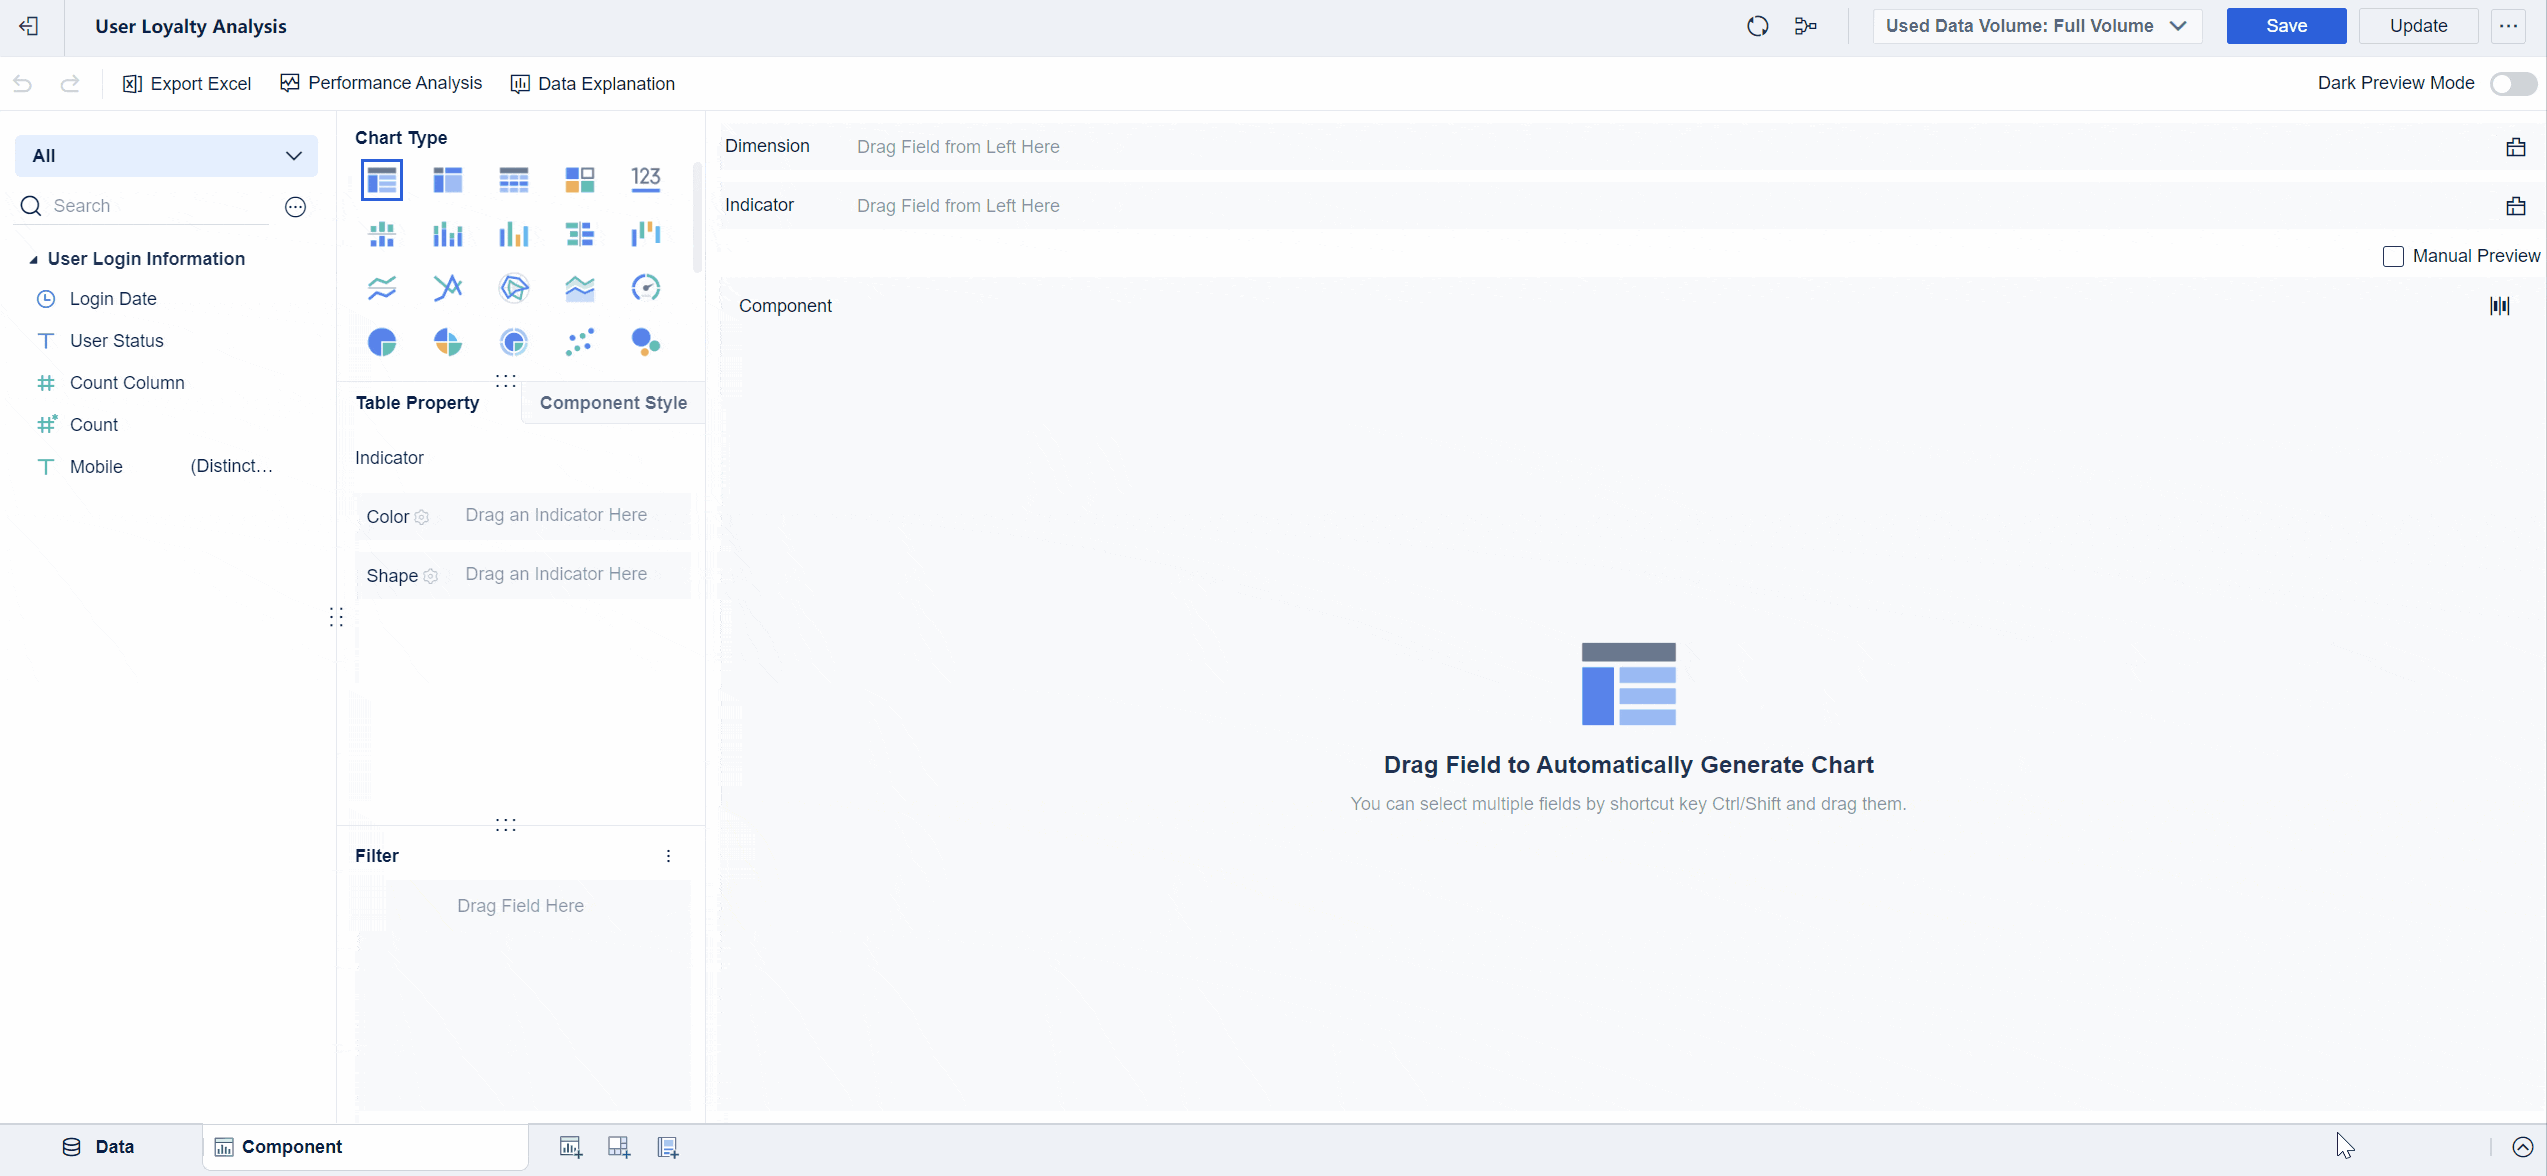
1. Create an analysis subject and upload the sample data User Login Information.
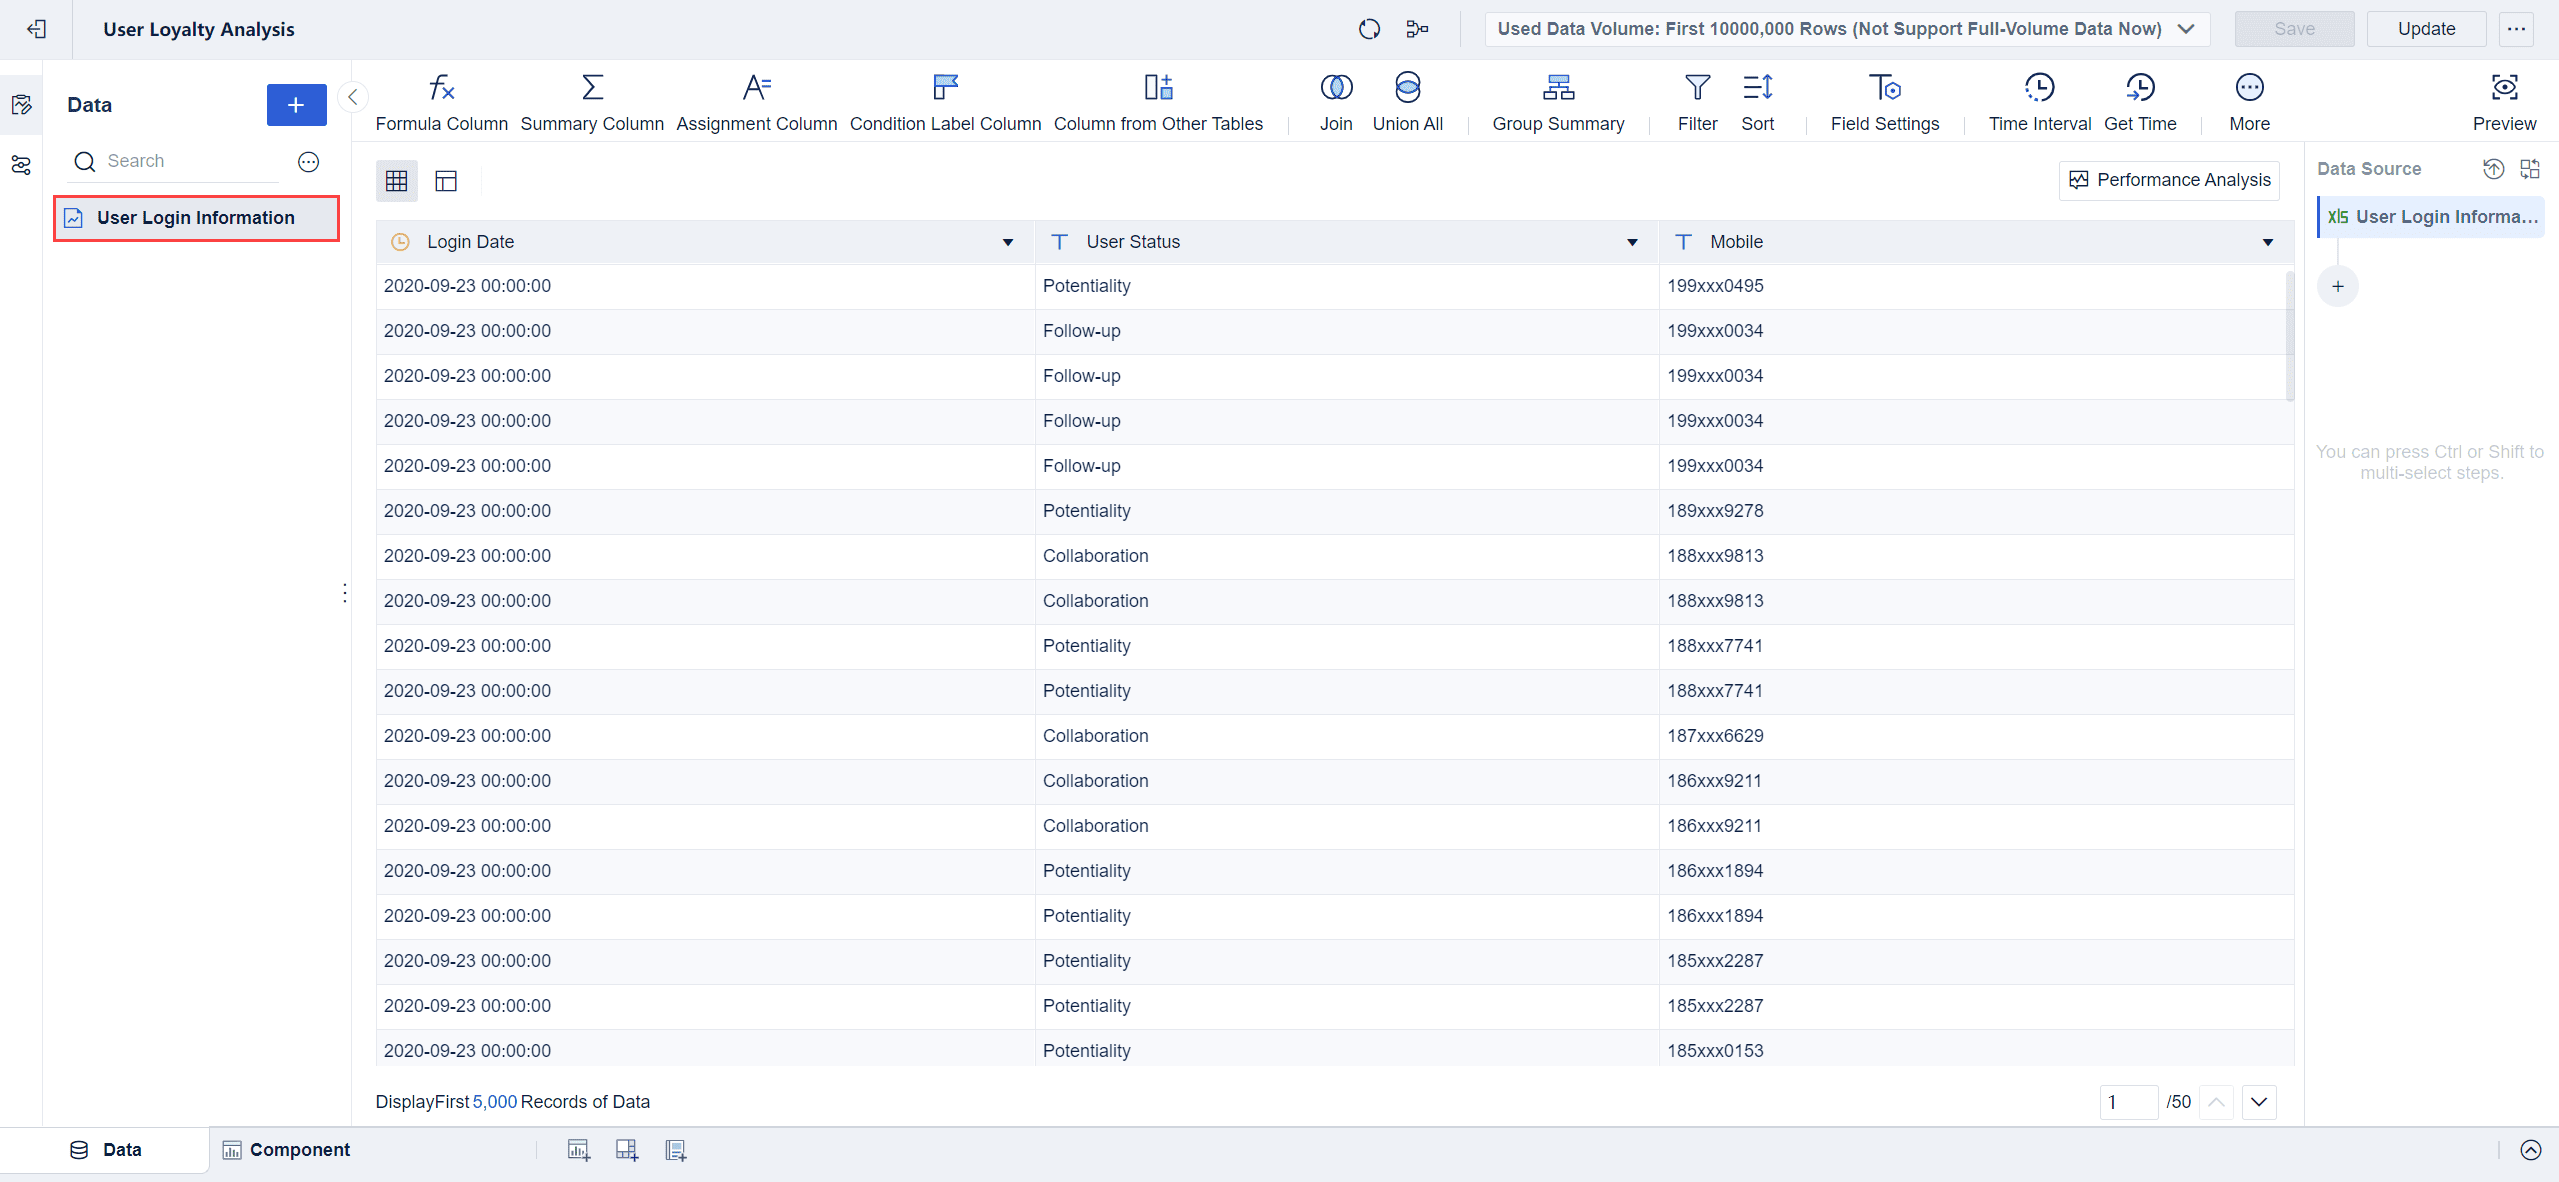
2. Add data and select all the fields in User Login Information, as shown in the following figure.
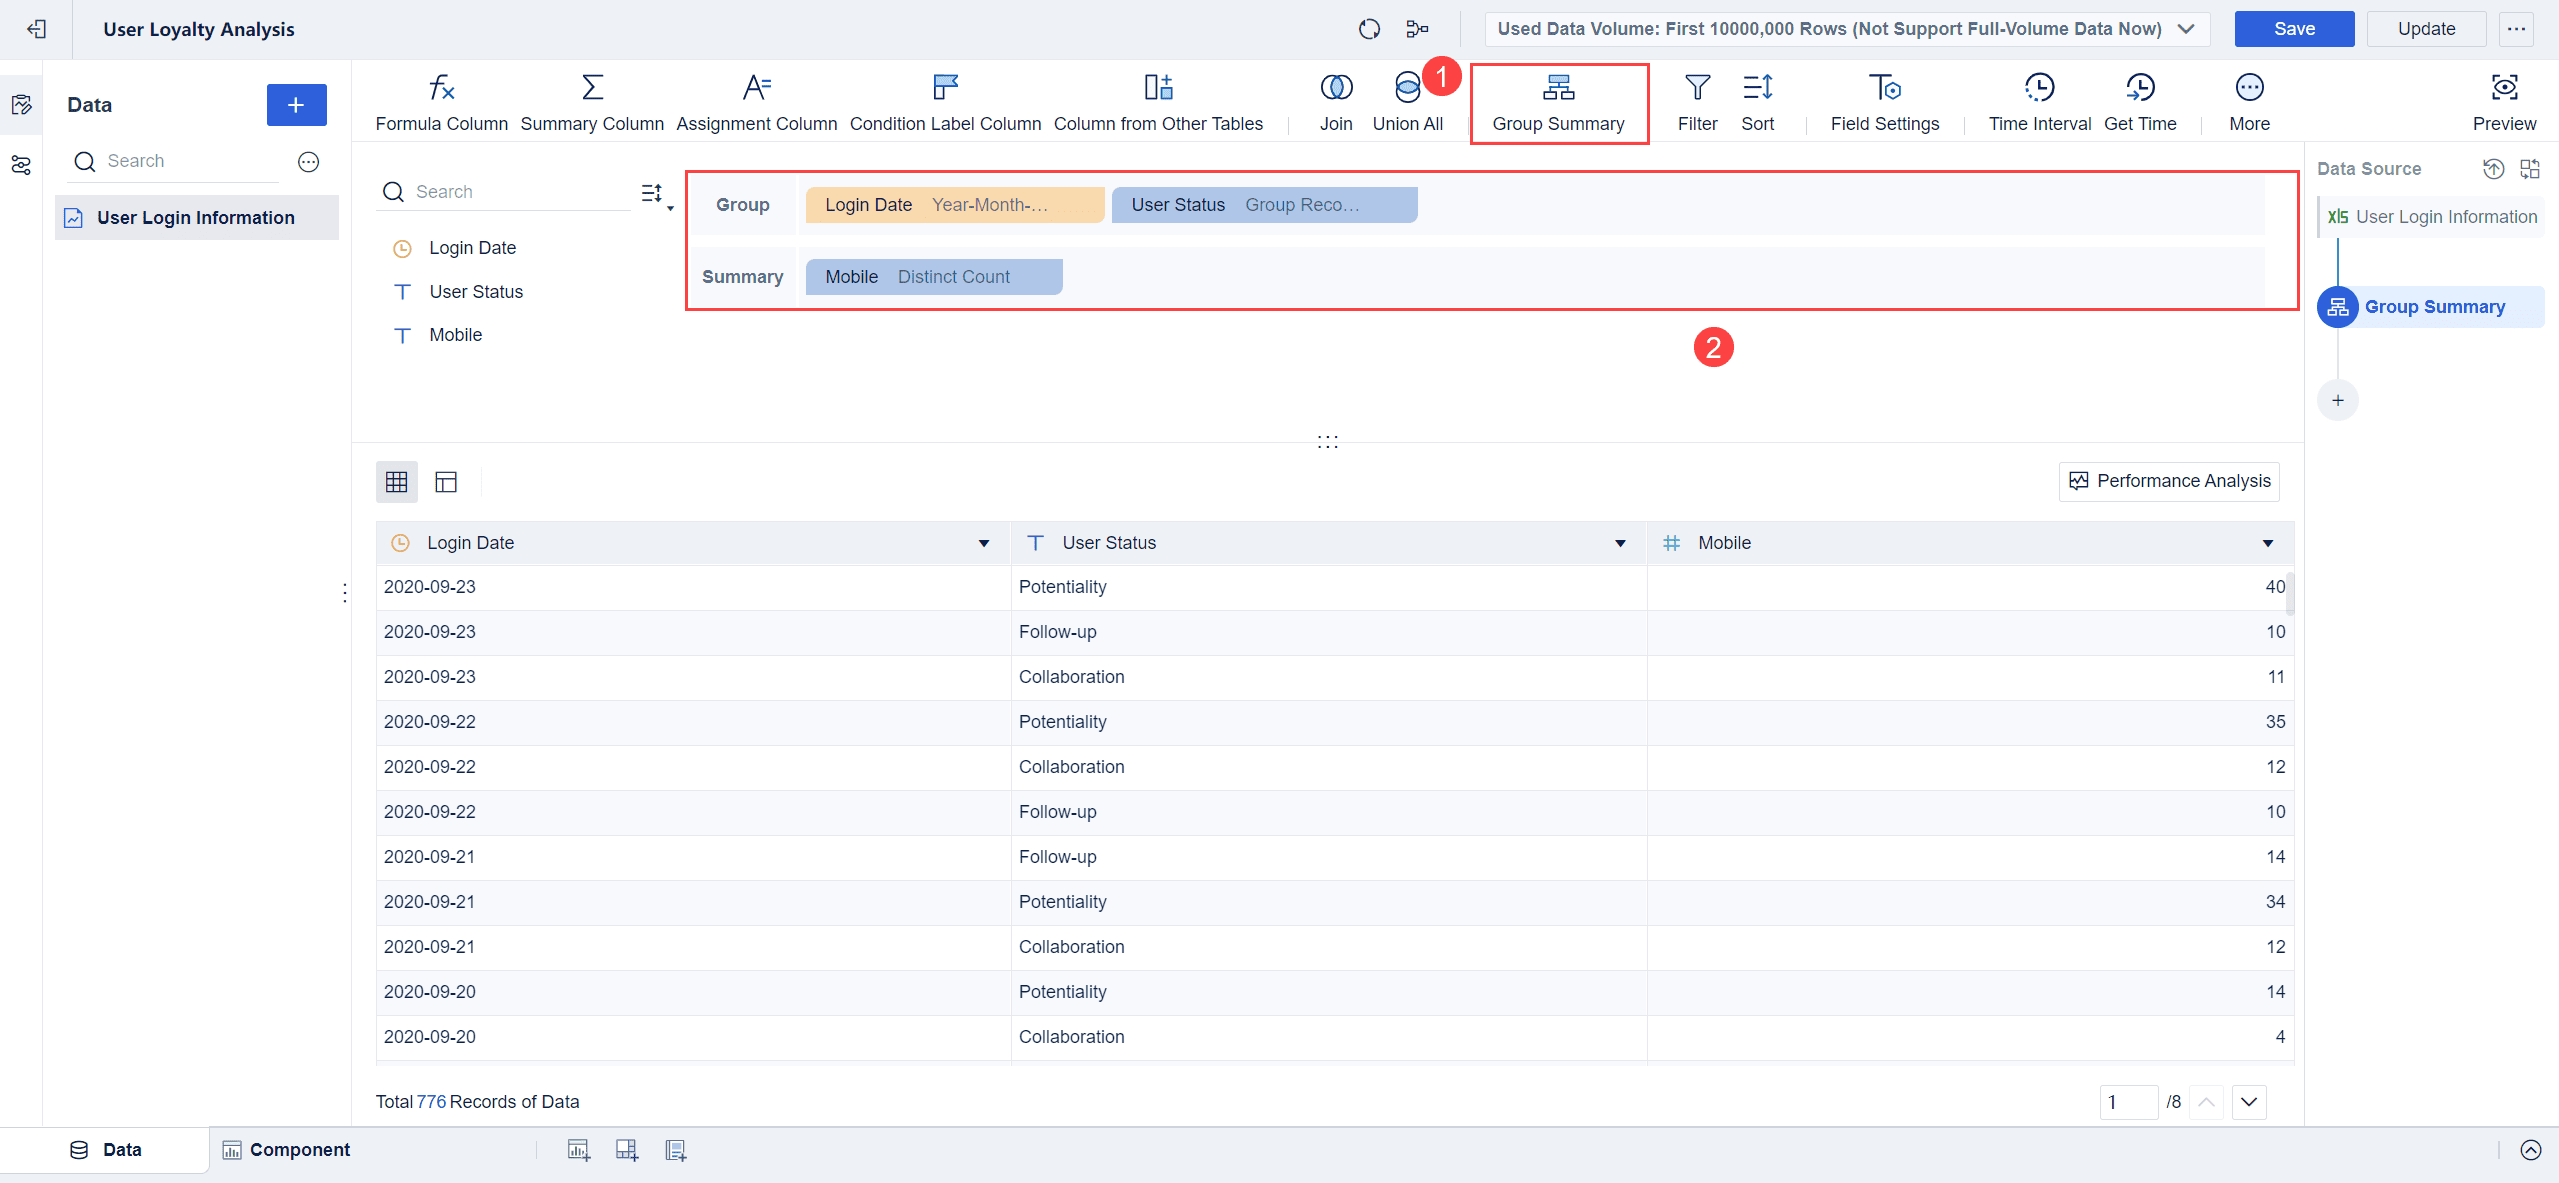
3. Click Group Summary, as shown in the following figure. (The following steps are to deduplicate the data. If a user logs in multiple times a day, you only need to retain one record of that user.)
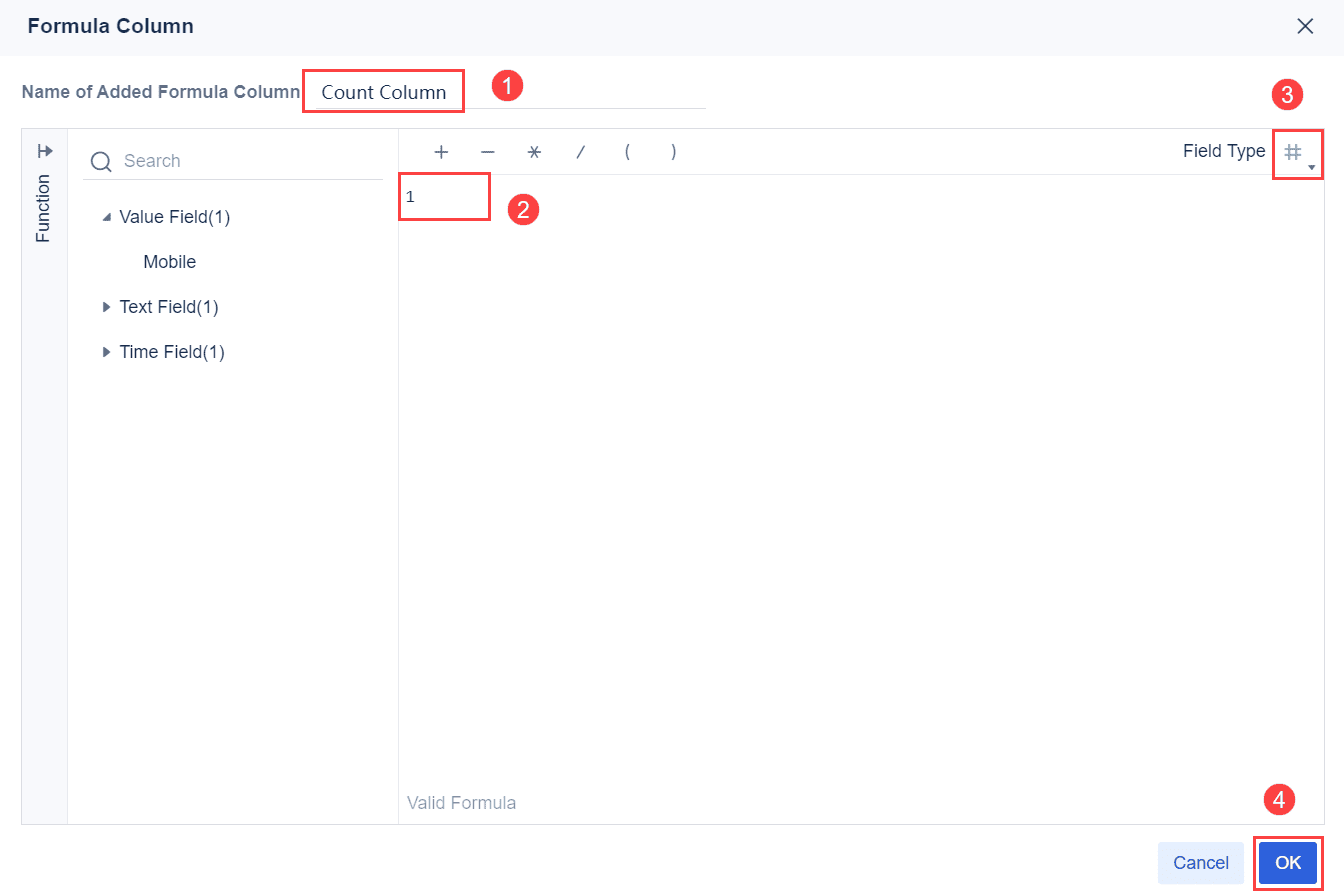
4. Click Formula Column to add a count column to mark each row of deduplicated data with 1, as shown in the following figure.
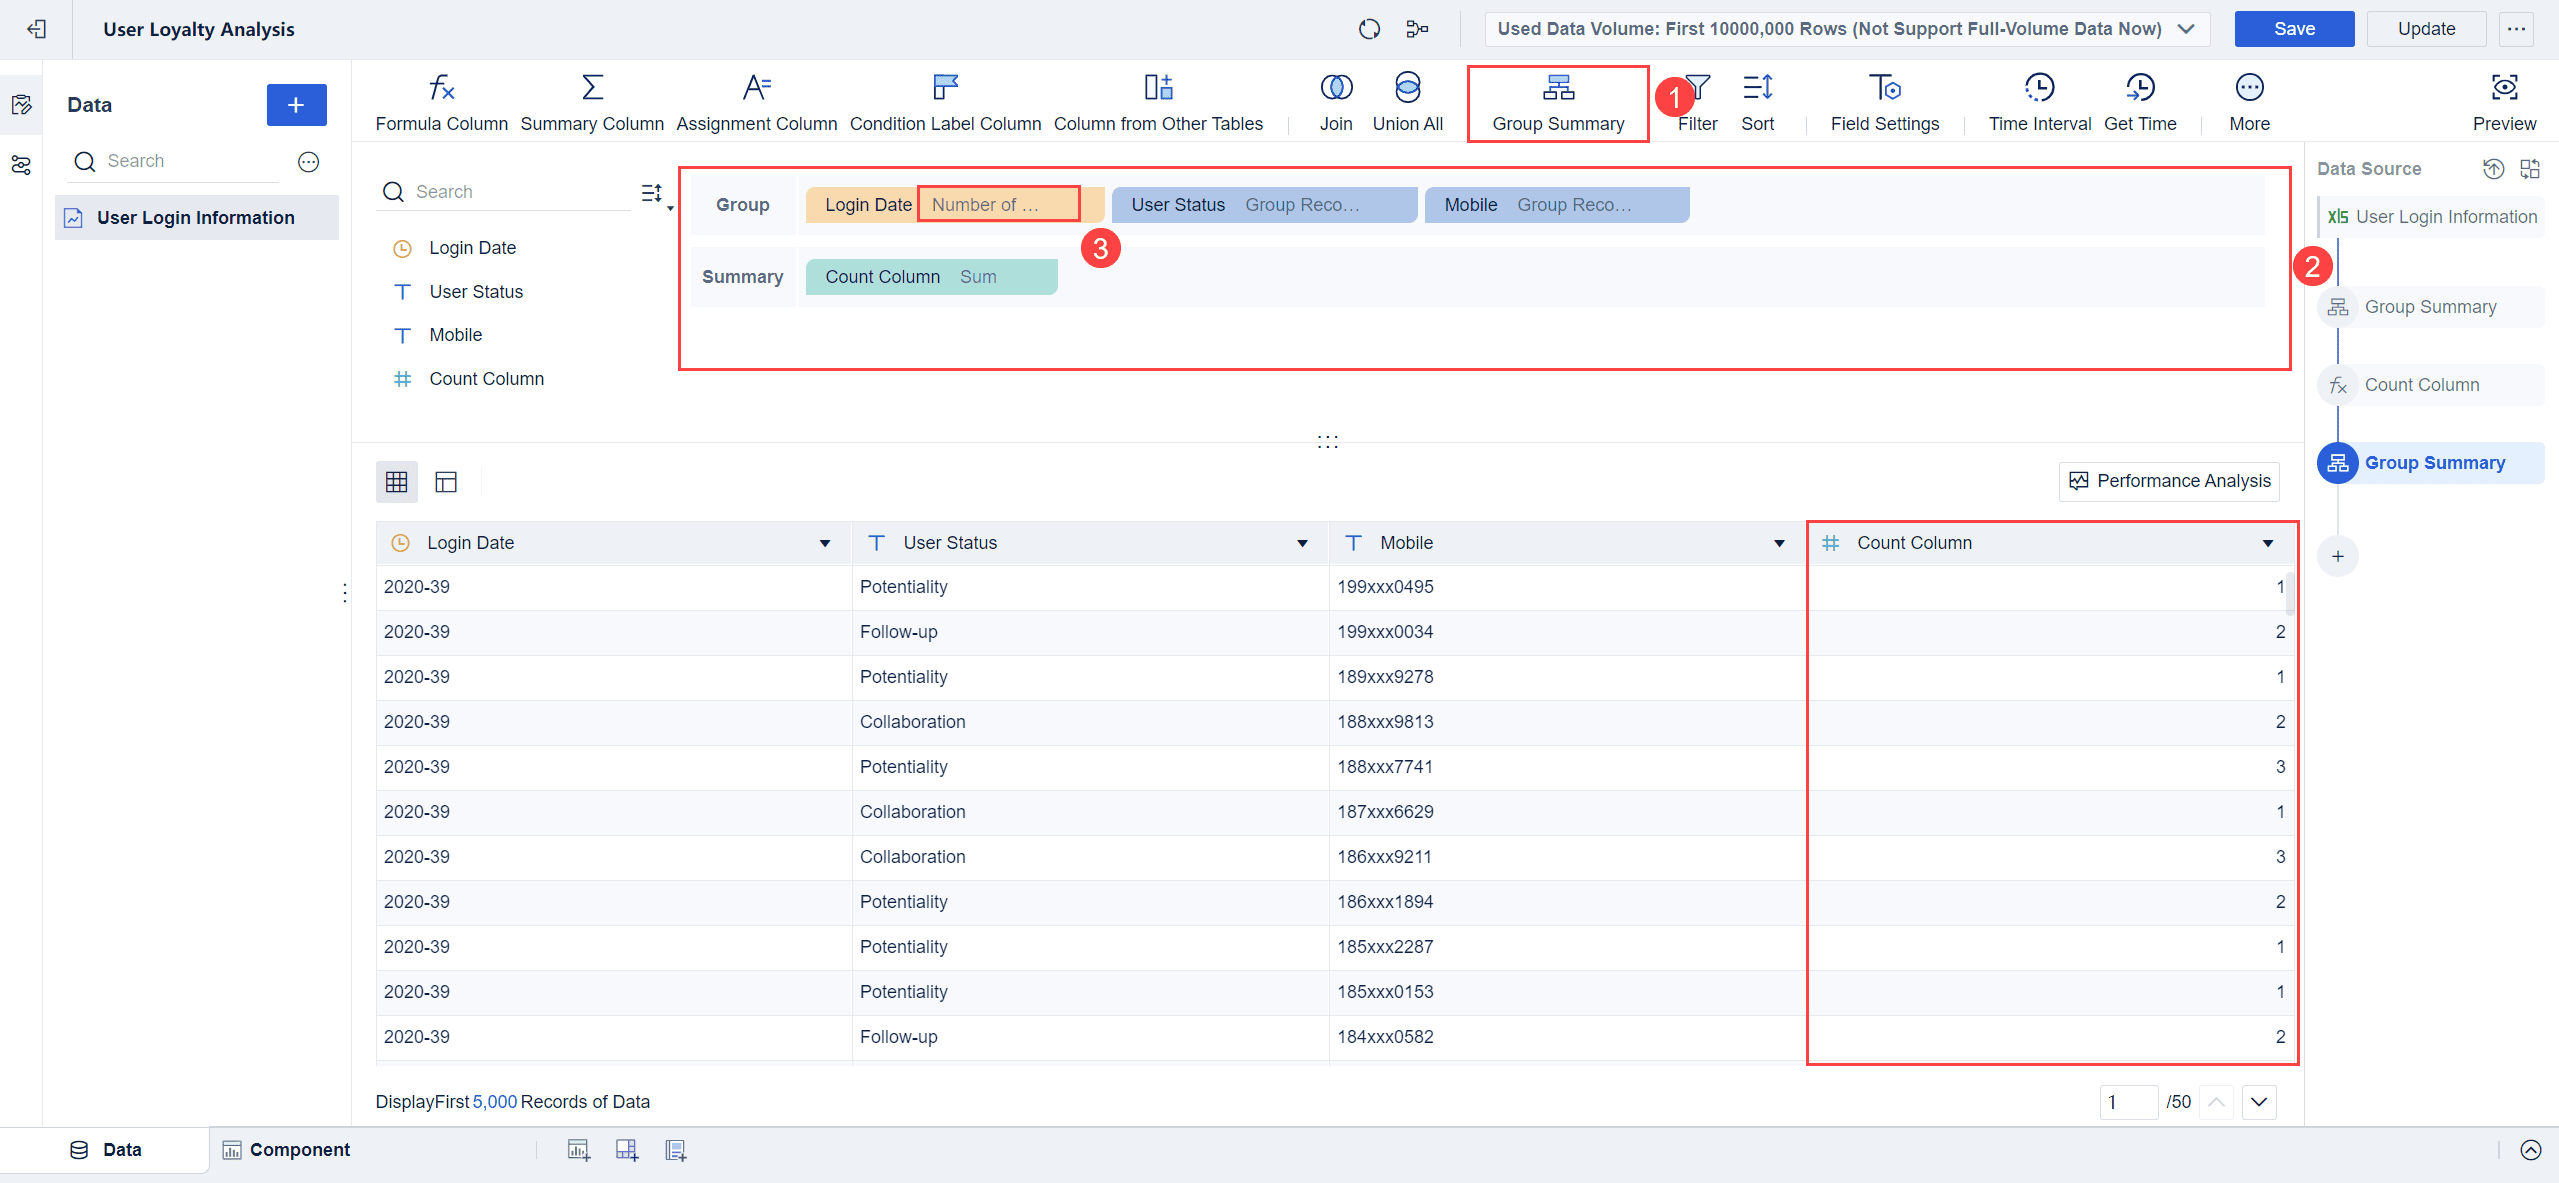
5. Click Group Summary, drag fields into Group and Summary, click the icon next to the field Login Date, and select Number of Weeks in Year from the drop-down list to calculate the number of logins per user per week.
6. Click Save and Update.
Component Creation
After preparing your data, you move on to building dashboard components for customer loyalty analysis. Start by understanding who will use the dashboard and what they need to see. Define clear goals for your dashboard, focusing on the most important metrics.
Select key performance indicators (KPIs) that match your business objectives. Avoid overcrowding your dashboard with too much information. Choose the right visualizations, such as trend charts or bar graphs, to make data easy to understand. Unify important data, like Net Promoter Score, into a single view. This helps you track trends without switching between tools.
Add interactivity to your dashboard. Let users filter data or drill down into specific customer segments. Compare your results to industry benchmarks to see how you measure up. Regularly update your dashboard with new data and feedback. This keeps your customer loyalty analysis current and valuable. Here are the detailed steps of the component creation process in FineBI.
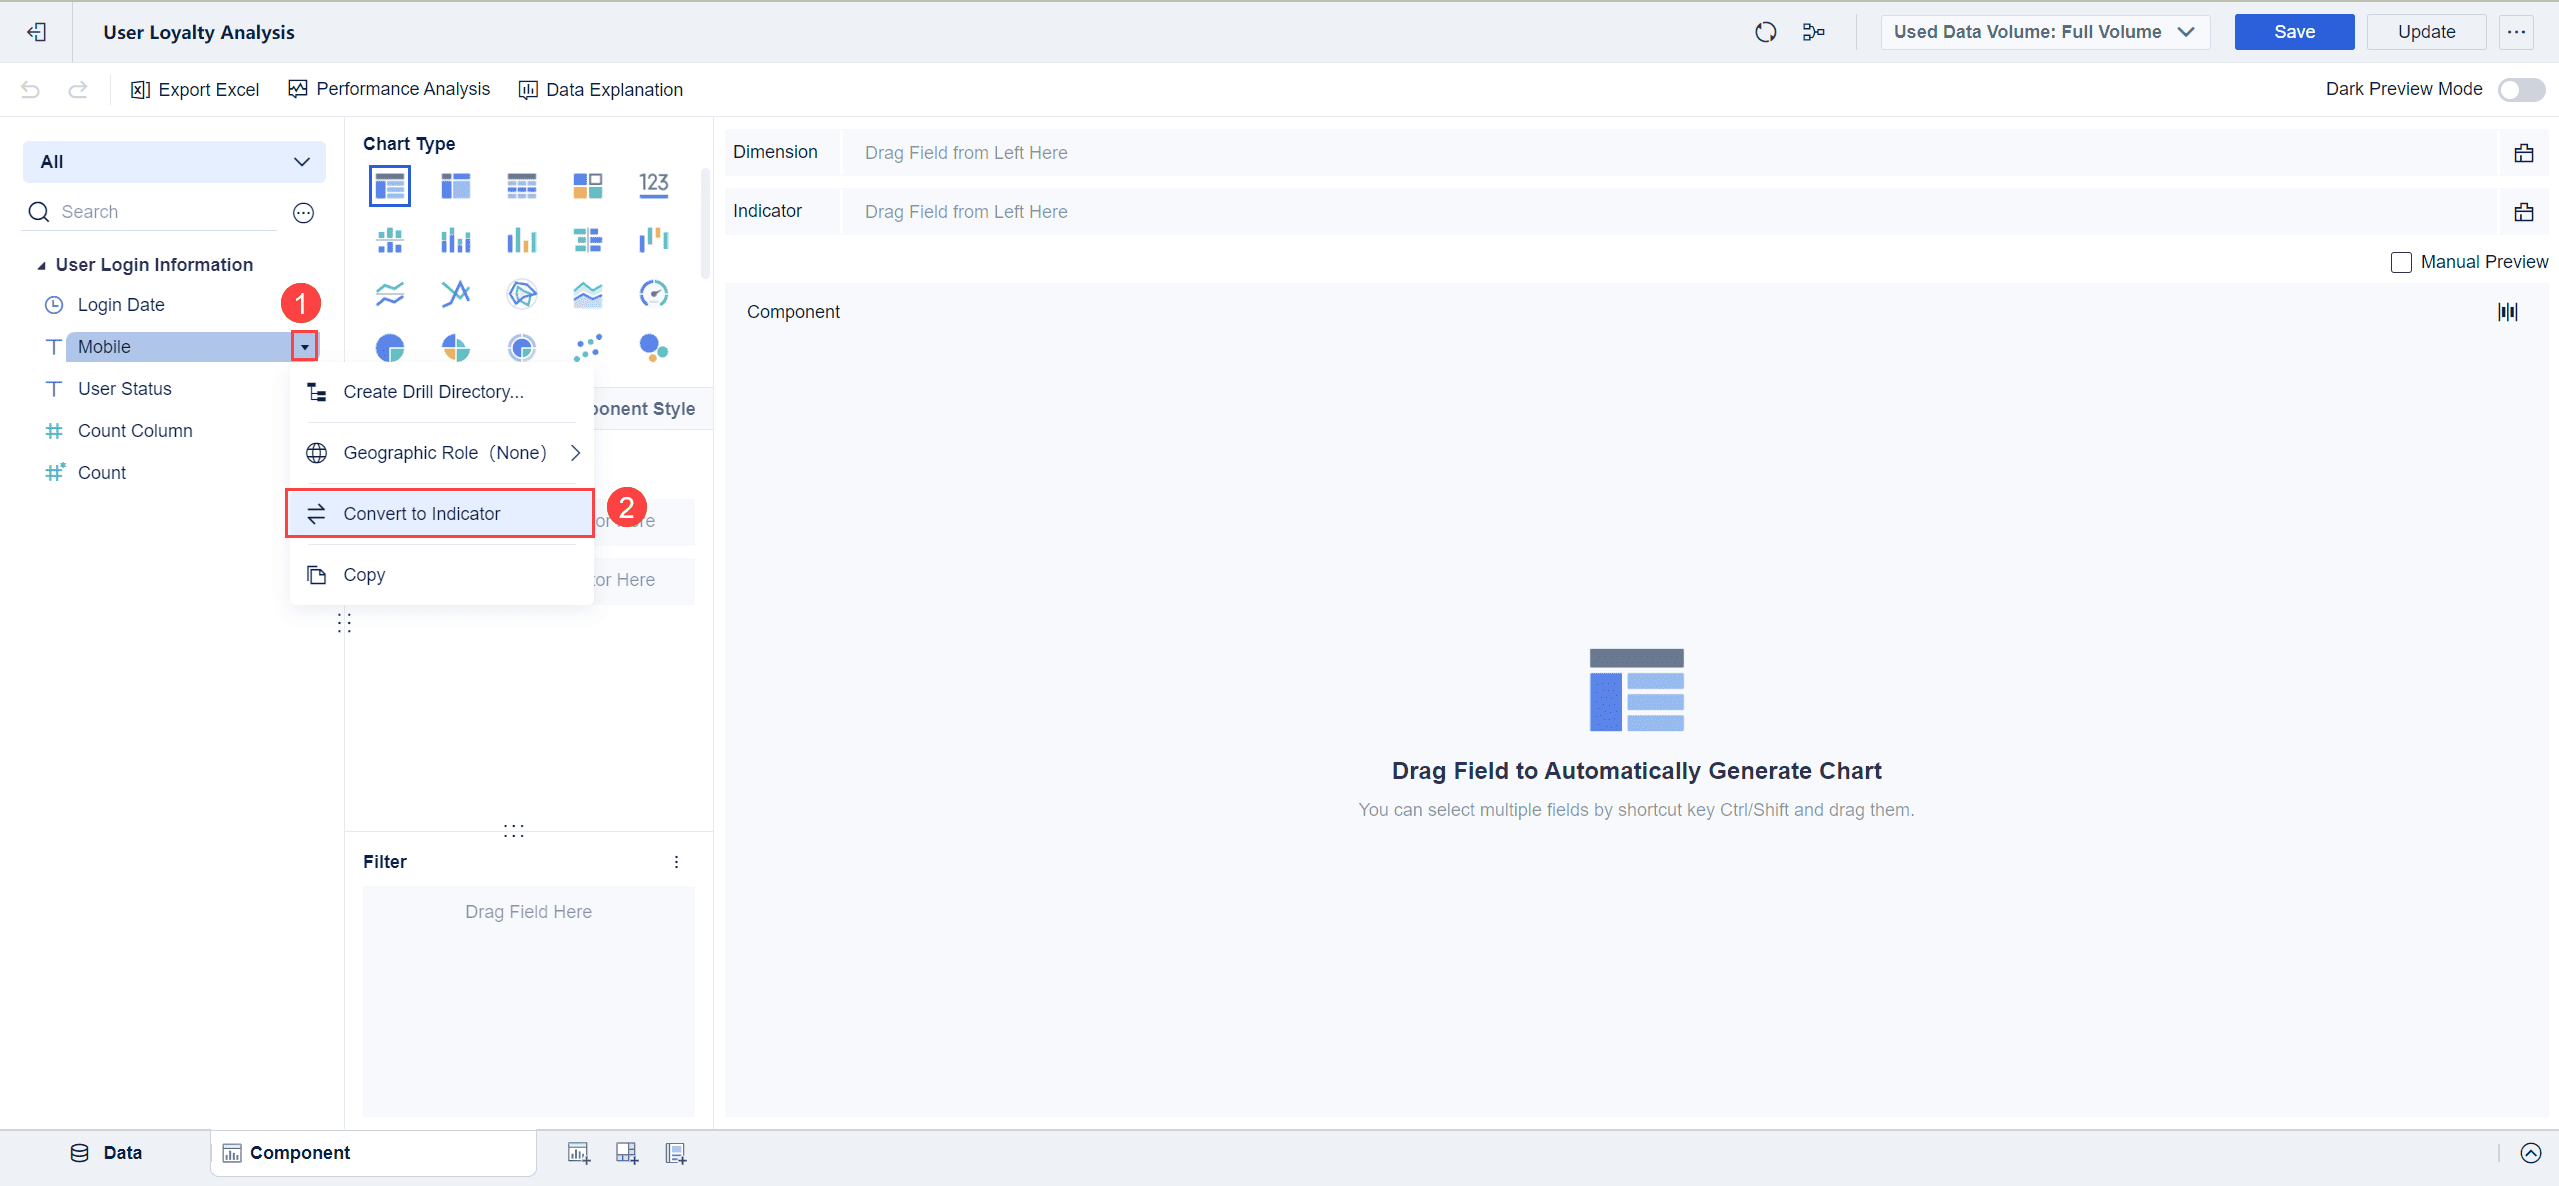
1. Click the icon next to the field Mobile and select Convert to Indicator from the drop-down list to obtain the deduplicated count on the Mobile data (namely the total number of users).
2. Perform Indicator Condition to the field Mobile (after the deduplicated count) to obtain the number of users who log in more than once a week.
3. Set Chart Type to Custom Chart, drag the field Login Date into Horizontal Axis, and drag the field Mobile into Vertical Axis to create a trend area chart.
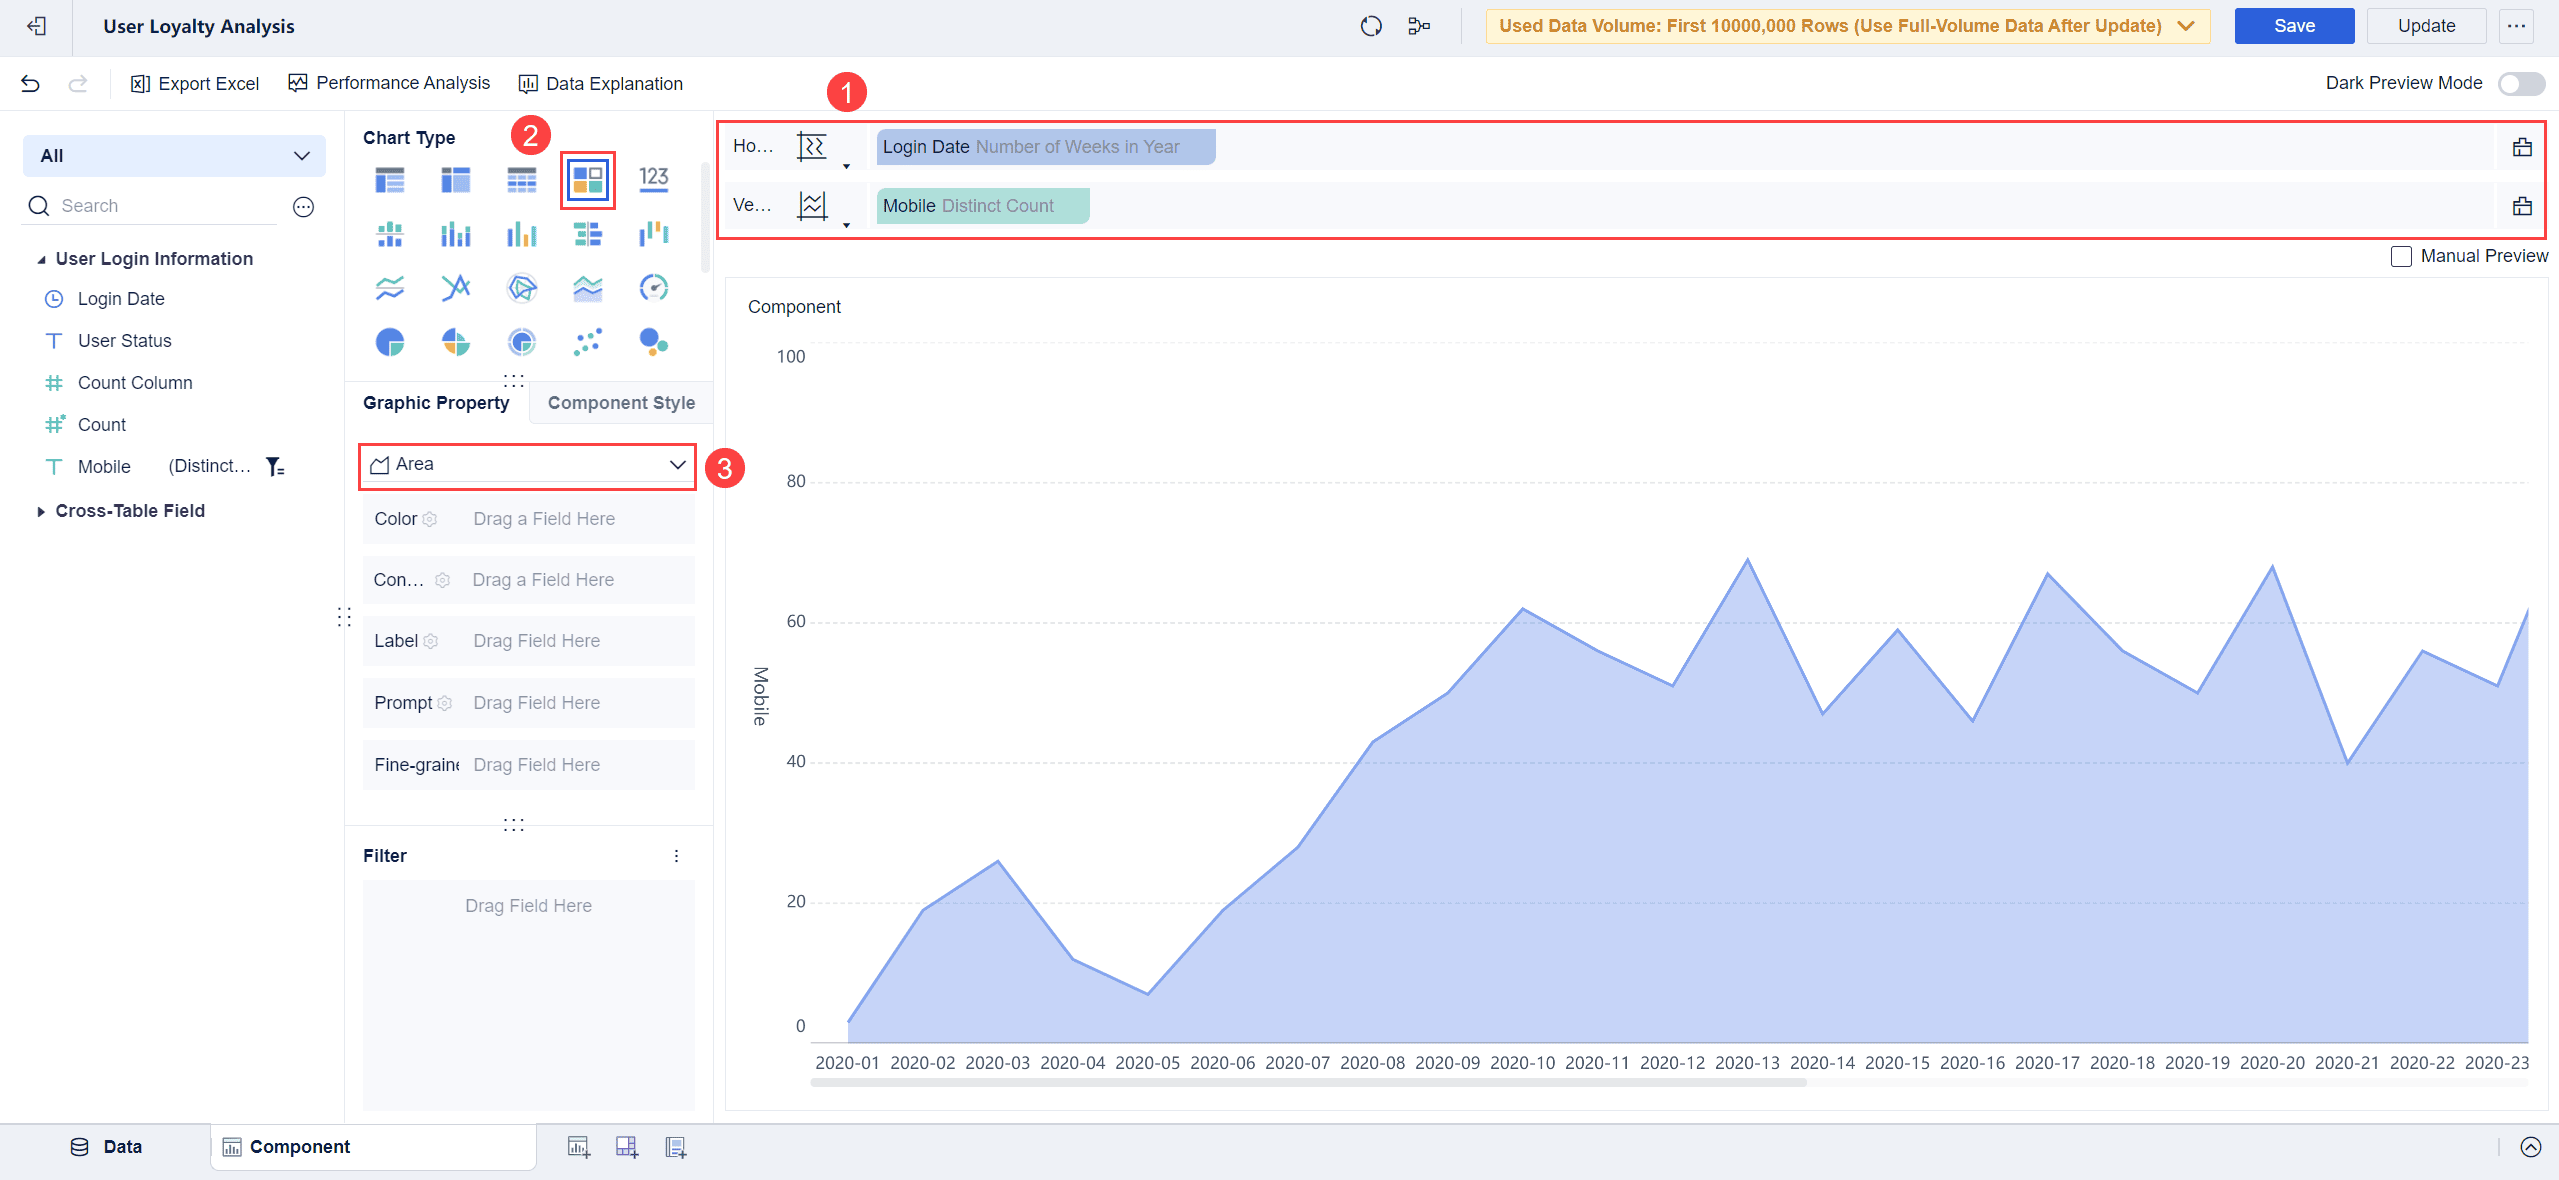
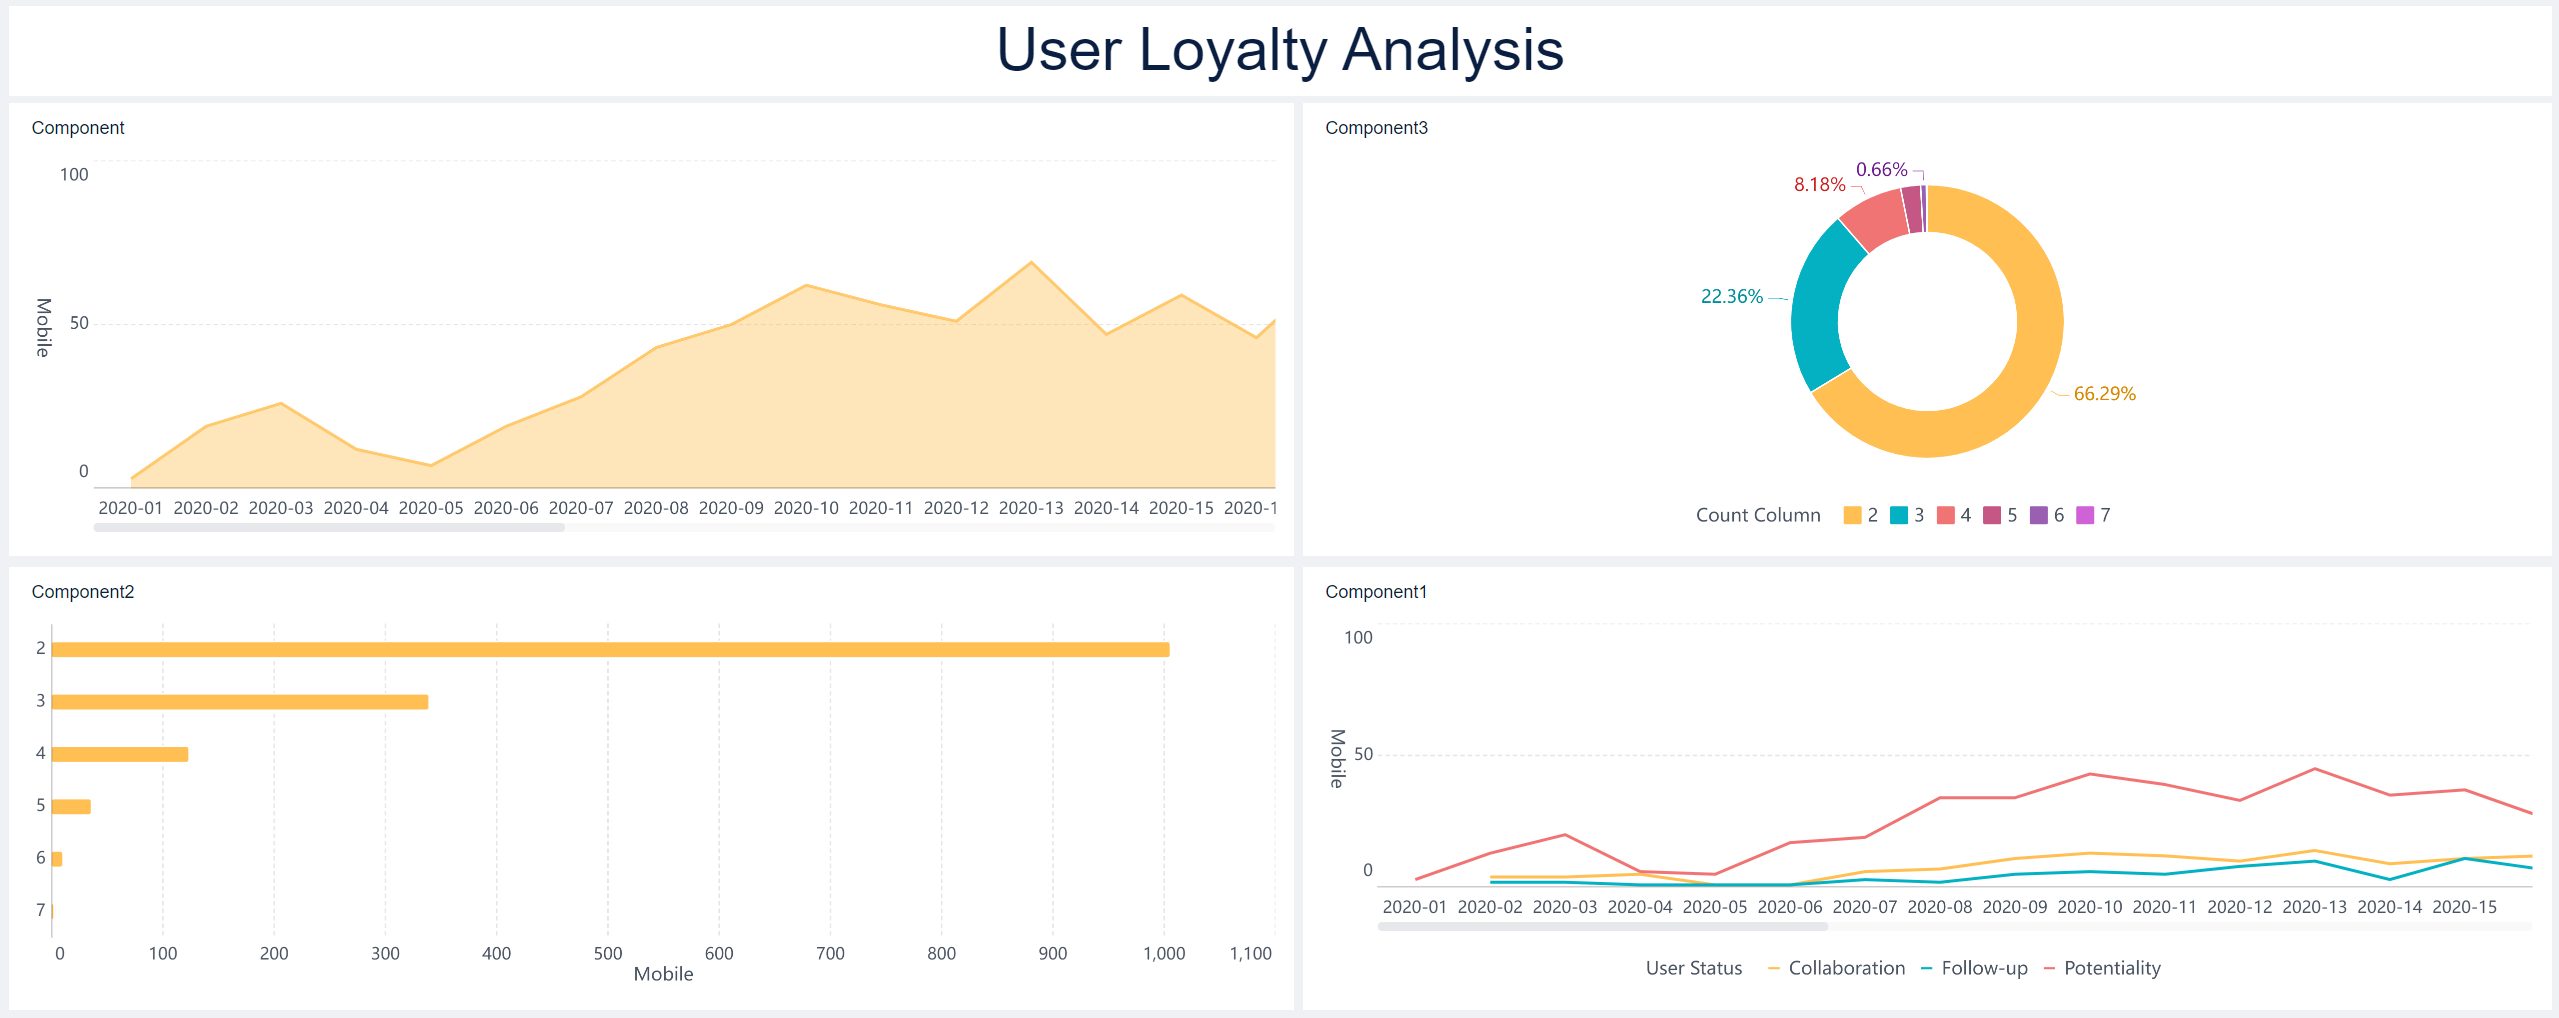
You have successfully created the trend area chart showing the number of users who log in more than twice a week. Viewing the Trend of the Number of Users in Different Status who Log in more than Twice a Week
Copy the component created in section "Viewing the Trend of the Number of Users who Log in more than Twice a Week", drag the field User Status into Color, and change Area to Line.
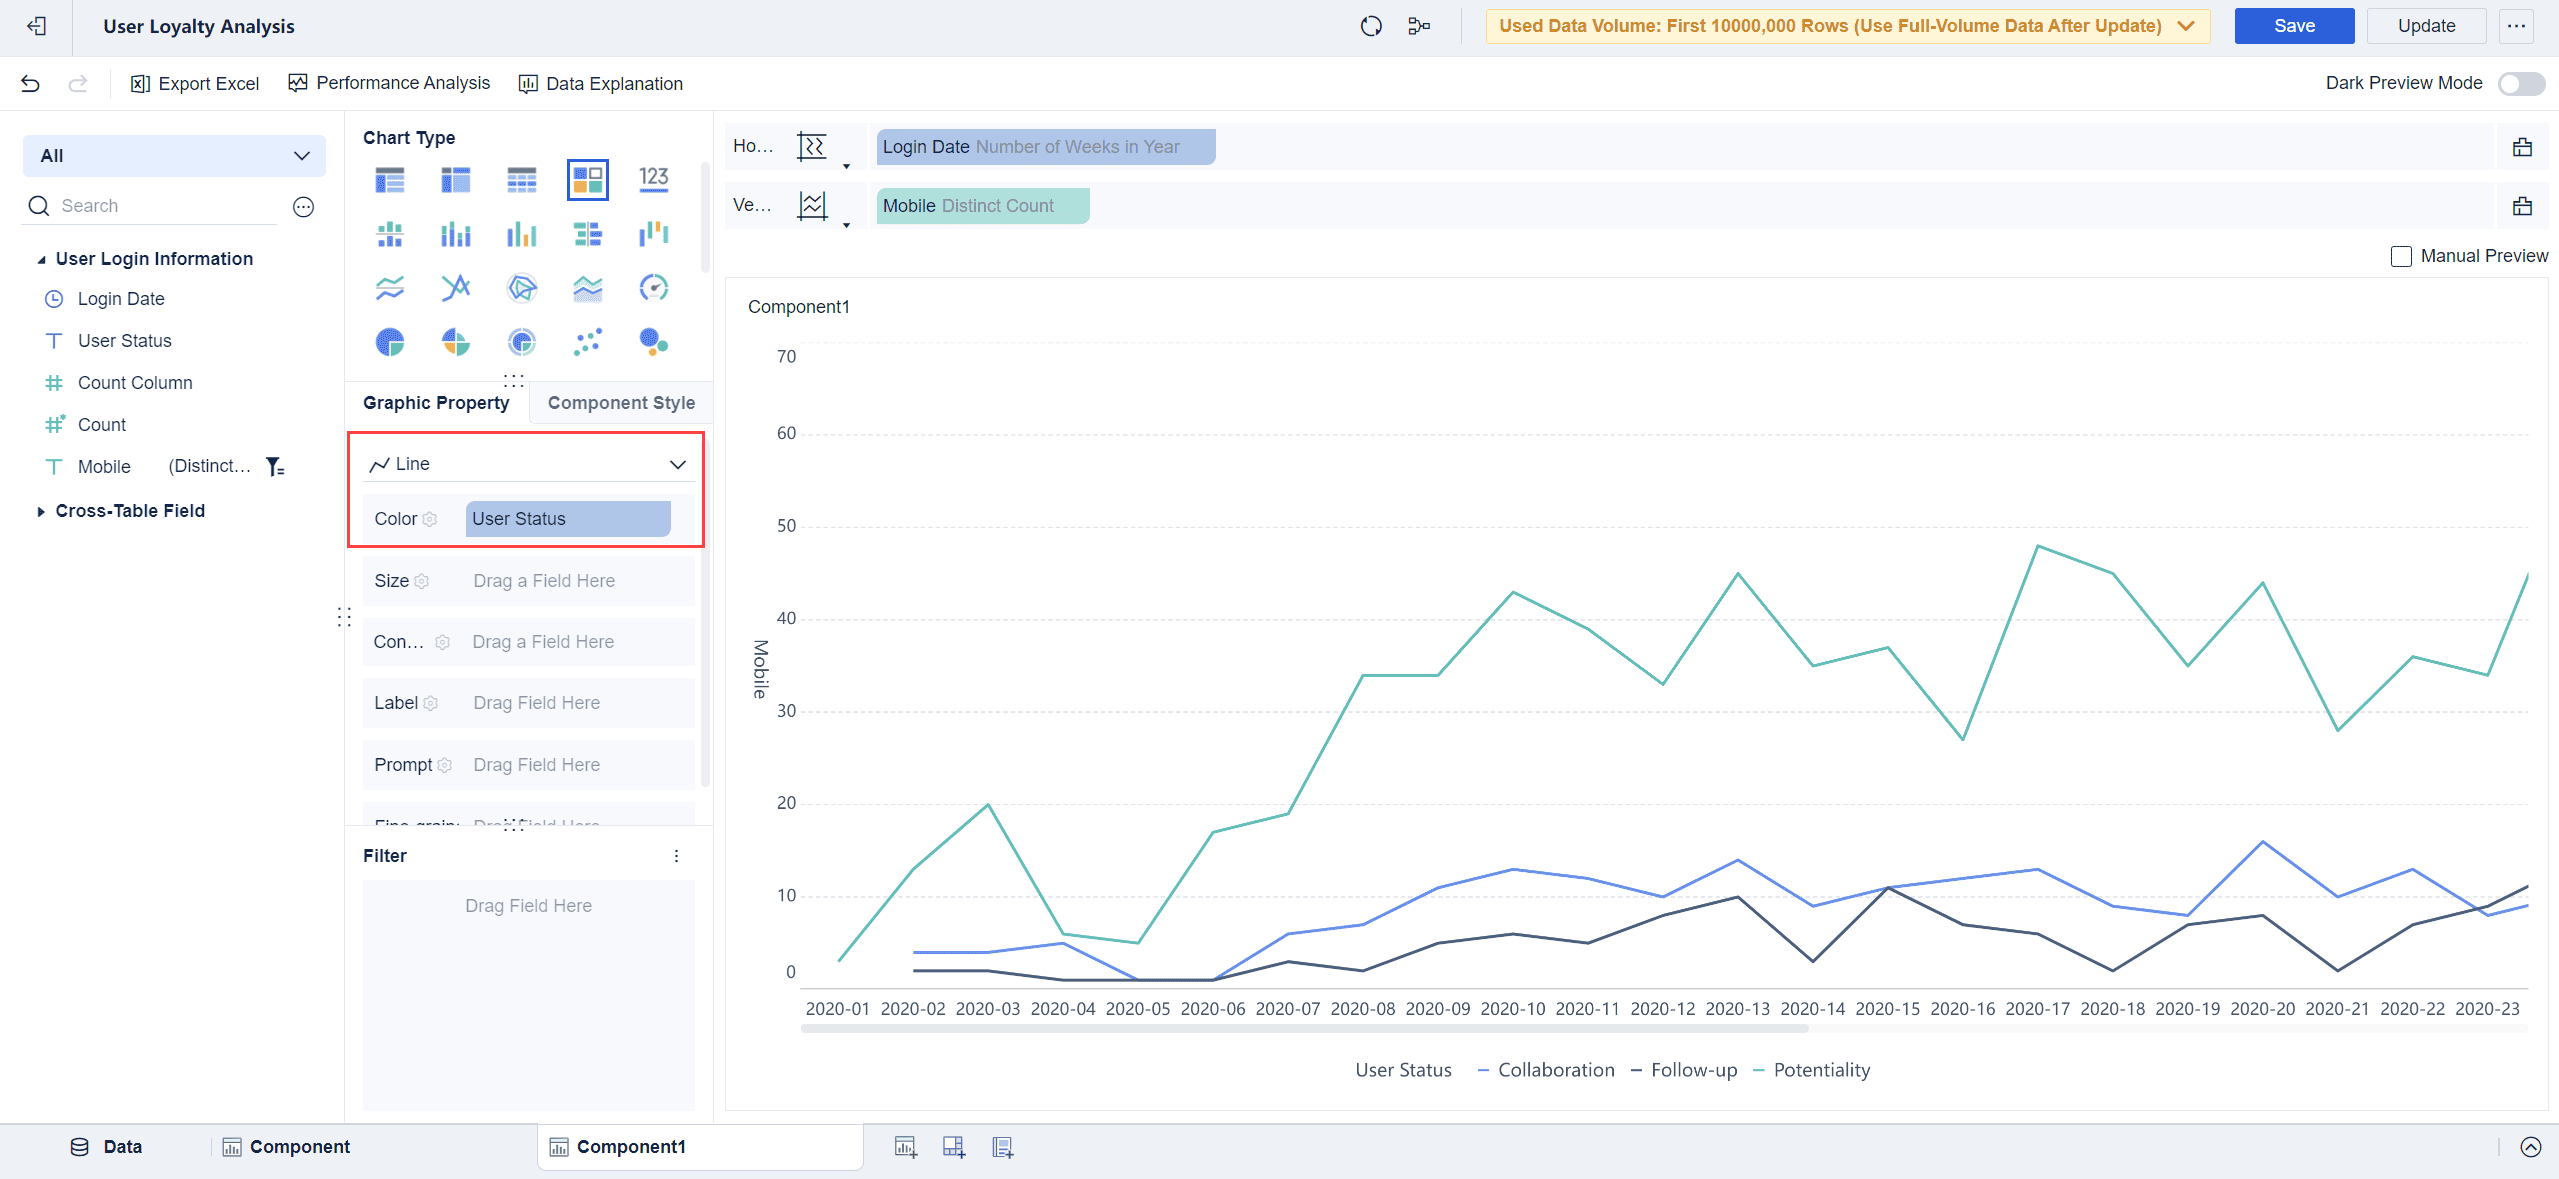
Now, you have obtained the trend of the number of users in different status who log in more than twice a week.
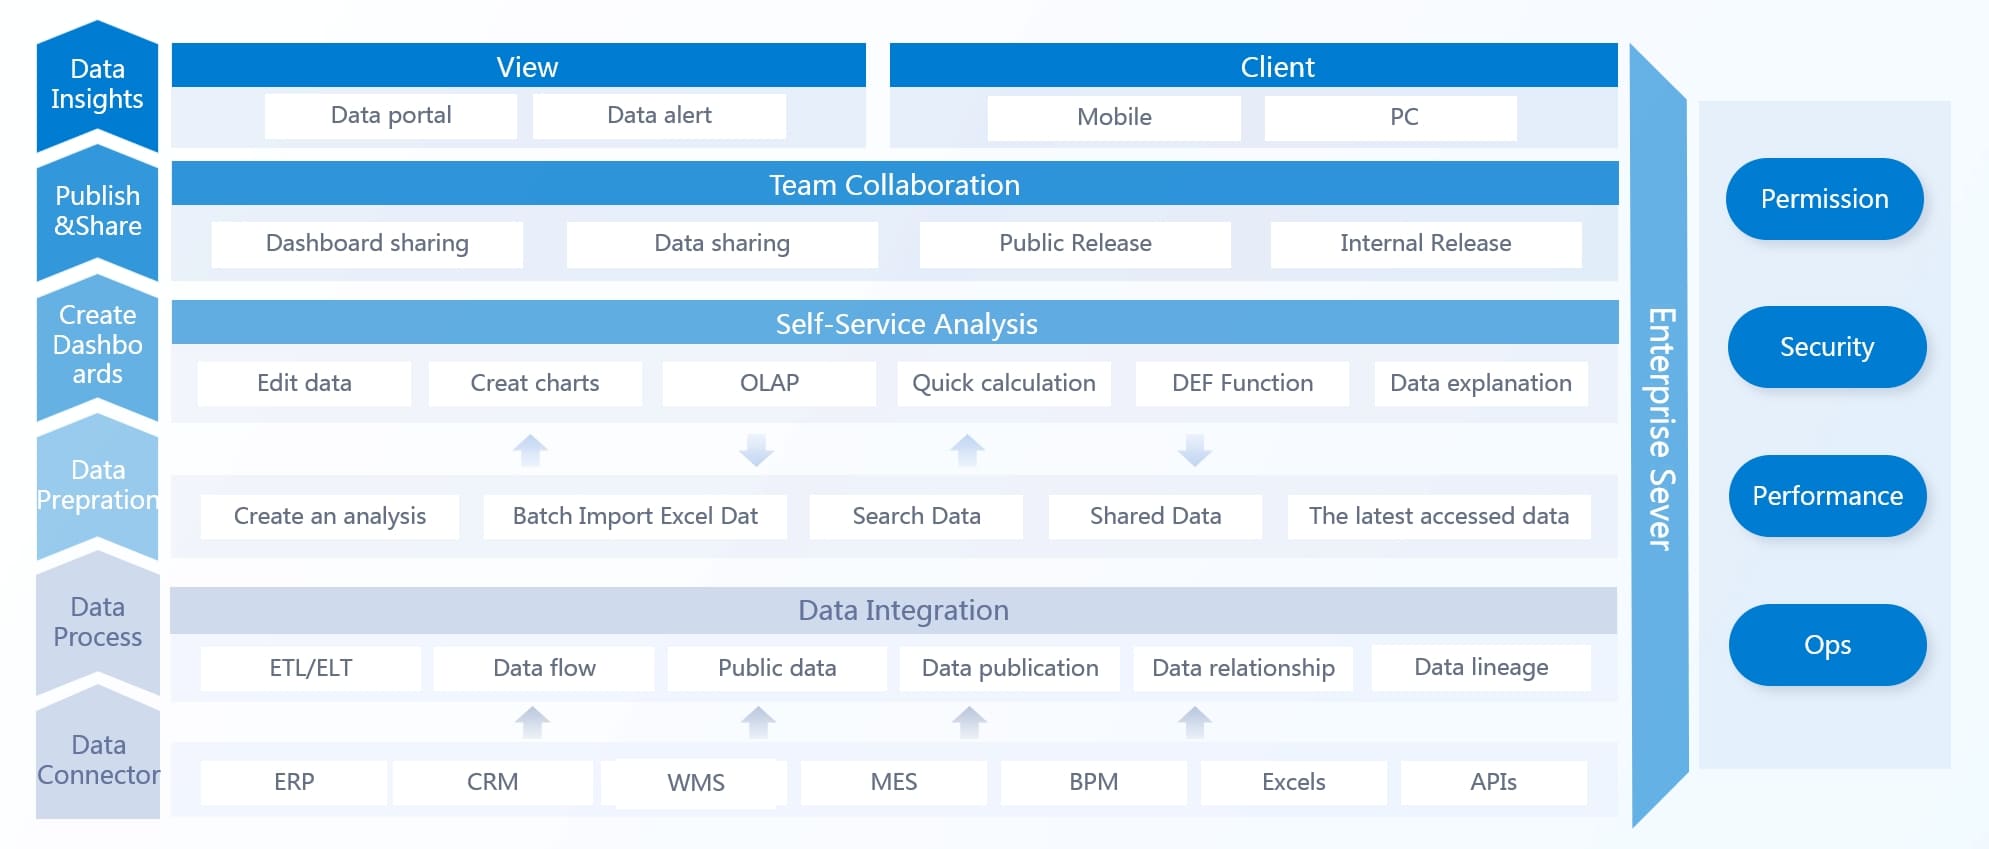
Data Integration and Analysis of Customer Loyalty Analytics with FineBI
Collecting Loyalty Data
You need accurate data to get the most from customer loyalty data analytics. FineBI connects to many sources, such as CRM systems, e-commerce platforms, and social media. You can upload files, link databases, or use APIs. FineBI brings all your customer loyalty data analytics together in one place. This makes it easy to track every customer touchpoint. Start by gathering data on purchases, website visits, feedback, and loyalty program activity. Clean your data by removing duplicates and fixing errors. FineBI’s tools help you standardize formats and prepare your data for analysis. When you centralize your customer loyalty data analytics, you set a strong foundation for deeper insights.
Segmenting Customers
Segmenting your customers is a key step in customer loyalty data analytics. FineBI lets you group customers by behavior, demographics, or purchase history. You can use methods like RFM analysis (Recency, Frequency, Monetary value), clustering, or lifecycle stages. Here are some effective ways to segment customers for customer loyalty analytics:
- Use zero-party data, such as information customers share directly, to enrich your segments.
- Choose variables that match your goals, like purchase frequency or product preferences.
- Apply clustering techniques, such as K-Means, to form meaningful groups.
- Build detailed personas for each segment, including motivations and buying patterns.
- Evaluate each segment’s profitability by looking at revenue and lifetime value.
FineBI’s dashboards let you visualize these segments and monitor how each group responds to your loyalty programs. You can create unique offers for each segment and adjust your strategy as you see changes in customer loyalty data analytics.
Identifying Trends
You want to identify trends and patterns in your customer loyalty data analytics. FineBI gives you real-time dashboards and visual tools to spot changes quickly. Track metrics like purchase frequency, retention rate, and active user rate. Use trend analysis to see how customer behavior shifts over time. FineBI supports advanced analytics, including AI and machine learning, to process large datasets and identify trends and patterns that might not be obvious. You can combine quantitative data, such as repeat purchase rates, with qualitative feedback from reviews or surveys. FineBI’s visualizations make it easy to communicate findings and take action. When you monitor your dashboards regularly, you can respond fast to changes and improve your customer loyalty analytics strategy.
Tip: Use FineBI’s real-time analytics to keep your finger on the pulse of customer loyalty data analytics. This helps you identify trends and patterns early and make smarter decisions.

Ways to Build Customer Loyalty Analytics
Building customer loyalty requires more than just offering rewards. You need to use analytics to understand your customers, personalize their experiences, and improve your loyalty programs. Here are three powerful ways to build customer loyalty with analytics.
Personalizing Experiences
Personalization stands at the heart of modern customer loyalty. When you tailor experiences to each customer, you make them feel valued and understood. Analytics helps you segment your audience, track their preferences, and deliver offers that match their needs.
- Companies like KFC UK & Ireland launched a gamified loyalty app. This app used data to personalize engagement, leading to a 40% reward redemption rate and a 25% increase in frequent visits.
- Benefit Cosmetics created a mobile-first loyalty program for young customers. Over 20,000 members joined in nine months, boosting emotional loyalty and engagement.
Personalized loyalty programs use data to create unique journeys for each customer. You can analyze purchase history, website activity, and feedback and insights to recommend products or send targeted offers. This approach increases repeat business and brand loyalty.
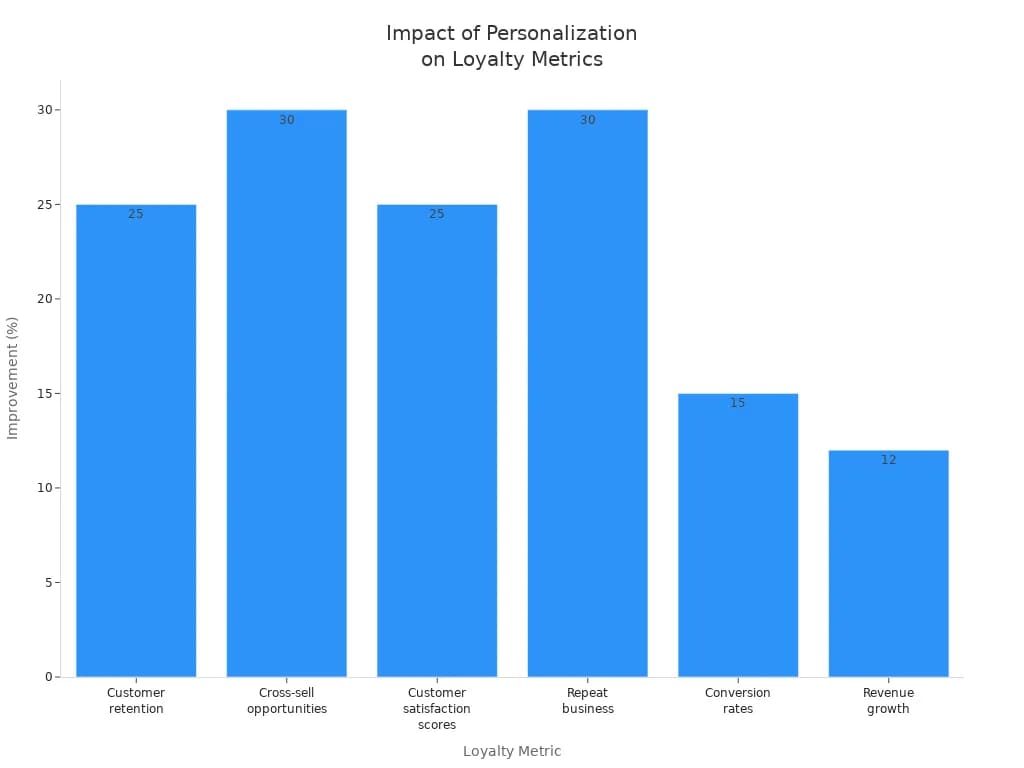
| Metric | Improvement Achieved |
|---|---|
| Customer retention | 25% increase |
| Cross-sell opportunities | 30% increase |
| Customer satisfaction scores | 25% increase |
| Repeat business | 30% increase |
| Conversion rates | 15% increase |
| Revenue growth | 12% increase |
A financial services firm used AI-powered personalization and customer journey analytics to achieve these results. You can see that personalizing the customer experience leads to higher customer satisfaction scores, more repeat business, and stronger brand loyalty.
Tip: Use FineBI to segment your customers and track how personalized offers impact engagement and loyalty metrics over time.
Optimizing Loyalty Programs
Analytics gives you the tools to design and refine loyalty programs that truly work. You can use your data to understand what motivates your customers and which rewards drive the most engagement. Here are some effective strategies:
- Analyze customer behavior to spot trends and triggers for repeat purchases.
- Personalize offers and rewards based on customer preferences and purchase history.
- Continuously monitor engagement and adjust your loyalty program to keep it relevant.
- Design rewards that are easy to earn and redeem, making the program more attractive.
- Foster emotional loyalty by creating experiences that connect with your customers’ values.
- Use technology like FineBI to manage your program efficiently and maximize your return on investment.
Many loyalty programs fail because they do not use data effectively. You need to integrate data from all your systems to get a complete view of your customers. For example, Walmart+ combines mobile and in-store experiences, using analytics to personalize rewards and increase customer retention.
FanRuan’s retail membership management solution shows how you can use analytics to optimize loyalty programs. By segmenting customers with RFM modeling and tracking their engagement, you can deliver targeted offers and measure the impact on customer loyalty. FineBI dashboards let you monitor key metrics like customer retention, repeat purchase rate, and customer lifetime value, helping you refine your program for better results.
Note: Regularly review your loyalty program’s performance using FineBI dashboards. This helps you spot trends, identify areas for improvement, and keep your program aligned with customer needs.
Using Insights for Action
Analytics does not just help you collect data—it empowers you to take action. You can use feedback and insights from multiple sources to improve your customer loyalty strategy.
- Track customer journeys through loyalty programs by monitoring app activity, QR code scans, and online purchases.
- Gather feedback and insights with surveys and satisfaction polls after purchases.
- Monitor social media to understand customer sentiment and preferences in real time.
- Analyze transaction histories to find patterns among your most loyal customers.
- Store data securely with CRM and data management platforms for accurate analysis.
- Use data mining and machine learning to predict customer behavior and personalize rewards.
- Apply insights to create targeted marketing campaigns and win-back offers for at-risk customers.
For example, Vodafone improved first contact resolution by 30% by analyzing customer service data. Starbucks uses analytics to personalize promotions, increasing customer engagement and brand loyalty. You can also use analytics to identify friction points in the customer journey and improve the overall customer experience.
FanRuan’s solutions in manufacturing and retail show how you can leverage your data to drive continuous improvement. FineBI dashboards help you track loyalty trends, allocate resources, and build predictable revenue streams. By acting on feedback and insights, you can increase customer satisfaction, reduce churn, and grow brand loyalty.
Tip: Make analytics a regular part of your loyalty strategy. Use FineBI to measure, analyze, and act on feedback and insights, ensuring your loyalty programs stay effective and your customers stay loyal.
You can drive business growth by leveraging customer loyalty analytics. Tracking key metrics like customer lifetime value, repeat purchase rate, and revenue churn rate helps you understand what keeps customers coming back.The key to success is making customer loyalty analytics a regular habit, not a one-time project. Use FineBI to measure your results, understand what the numbers mean, and take action based on what you discover. This ongoing process keeps your loyalty programs fresh and ensures your customers stay engaged with your business.
| Benefit | Impact |
|---|---|
| Real-time dashboards | Faster decisions, improved agility |
| Predictive analytics | Identify trends, reduce churn |
| Unified data integration | Clearer view of customer loyalty metrics |
With FineBI's interactive features, you can explore your data by clicking through charts and graphs to find deeper insights. When you notice that certain customers buy more frequently, or you spot warning signs that others might leave, you can respond quickly.Click the banner below to try FineBI for free and empower your enterprise to transform data into productivity!
Continue Reading About Customer Loyalty Analytics
How to Conduct a Demand Analysis for Your Business
How to Do Retention Analysis for Your Business
What is Market Basket Analysis and Why it Matters?
Unlocking Startup Success with the AARRR Metrics Framework
Unlocking User Retention with Effective Life Cycle Analysis


FAQ

The Author
Lewis
Senior Data Analyst at FanRuan
Related Articles
What is Ecommerce Analytics and Why Does It Matter
Ecommerce analytics helps online stores track data, optimize sales, and enhance customer experience for better growth and profitability.
Lewis
Jan 04, 2026
What is Ad-Hoc Analysis and Why is it Important
Ad-hoc analysis lets you answer unique business questions instantly, offering flexible, real-time insights that drive smarter, faster decisions.
Lewis
Sep 16, 2025

What Is a Data Model and Why Does It Matter
A data model defines how data is structured and connected, making information easier to manage, analyze, and use for smarter business decisions.
Lewis
Aug 04, 2025