You can make an observability dashboard by using a simple guide. An observability dashboard lets you see your systems in real time. Many companies notice big changes after they use one.
The right guide helps you make dashboards that fix real issues. Each step in the guide gets you closer to a dashboard that helps your team.
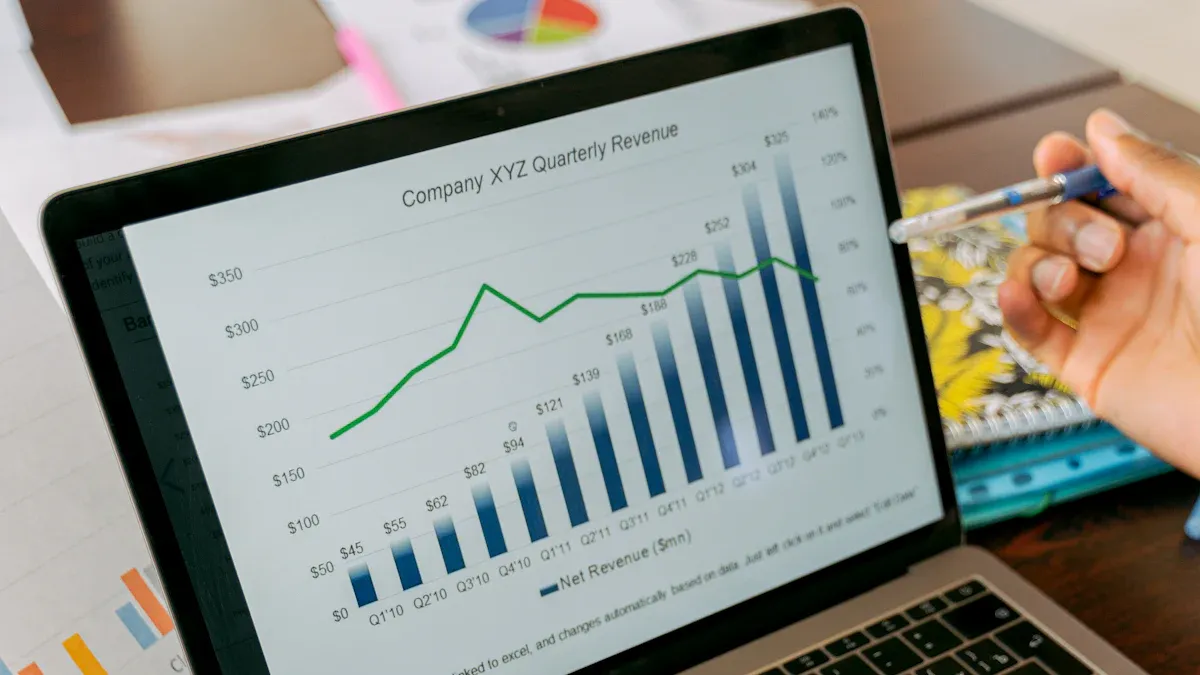
You need a real-time dashboard to see what happens in your business right now. In industries like semiconductor manufacturing, a real-time dashboard gives you the power to watch every part of your system. You can spot problems before they grow. You can also see how your machines and people work together. A real-time dashboard helps you make better choices every day.
Here is how a real-time dashboard can change your business:
| Aspect | Impact on Business Performance |
|---|---|
| Real-time insights | Enhances system health monitoring and application behavior understanding. |
| Proactive issue detection | Allows for faster troubleshooting and improved production stability. |
| Visibility into system activity | Helps detect abnormal behavior early and address bottlenecks before they affect production. |
| Understanding user behavior | Optimizes performance and user experience by identifying UI bottlenecks and slow screens. |
| Monitoring database performance | Ensures critical MES processes remain reliable by detecting degradation early. |
| Distributed traces | Reduces time to root cause during incidents by revealing latency issues and service dependencies. |
| IoT component behavior | Detects issues at the edge before they lead to production disruptions. |
You may face problems when you build a real-time dashboard. Many people find it hard to work together. Some teams use too many tools. This makes it hard to share data. You may find it hard to grow your real-time dashboard as your business grows. You may have trouble connecting all your data.
Here are some common problems:
You can fix these problems by using one real-time dashboard for your team. You can use real-time analytics to keep your data in one place. You can make sure everyone uses the same real-time dashboard. You can train your team to use real-time analytics. You can check your real-time dashboard often. You can ask your team what works and what does not. You can use real-time analytics to make your real-time dashboard better.
You can also measure how well your real-time dashboard works. You can look at your costs. You can see if you save money. You can check if your data is better. You can use real-time analytics to see if your team works faster. You can use a real-time dashboard to see if your business grows.
A real-time dashboard is a tool you need. You can use real-time analytics to make your business strong. You can use a real-time dashboard to see everything in real time.
To build an observability dashboard, you need clear goals. You should know what you want to see. You also need to know who will use the dashboard. If you follow the right steps, your dashboard helps your team. It solves real problems and helps you make better choices.
Set clear objectives before you start your dashboard. Think about what questions you want to answer. Decide if you want to check system health, track user activity, or find performance issues. When you know your goals, you can pick the right data.
You also need to know who will use the dashboard. Some people want to see big trends. Others want details about errors or slowdowns. Talk to your team and other groups. Make sure everyone agrees on the goals and their roles.
Here are some tips for this step:
After you set your goals, pick the right metrics. Metrics show how your system works. KPIs help you measure success. Choose metrics that answer your main questions.
Industry experts suggest these steps:
You can use a table to organize your metrics:
| Metric Name | Why It Matters | Who Needs It |
|---|---|---|
| CPU Usage | Shows system health | IT Team |
| Average Query Time | Finds slow database queries | Database Admins |
| Error Rate | Spots problems early | Developers |
| Inventory Turnover | Tracks business performance | Operations Managers |
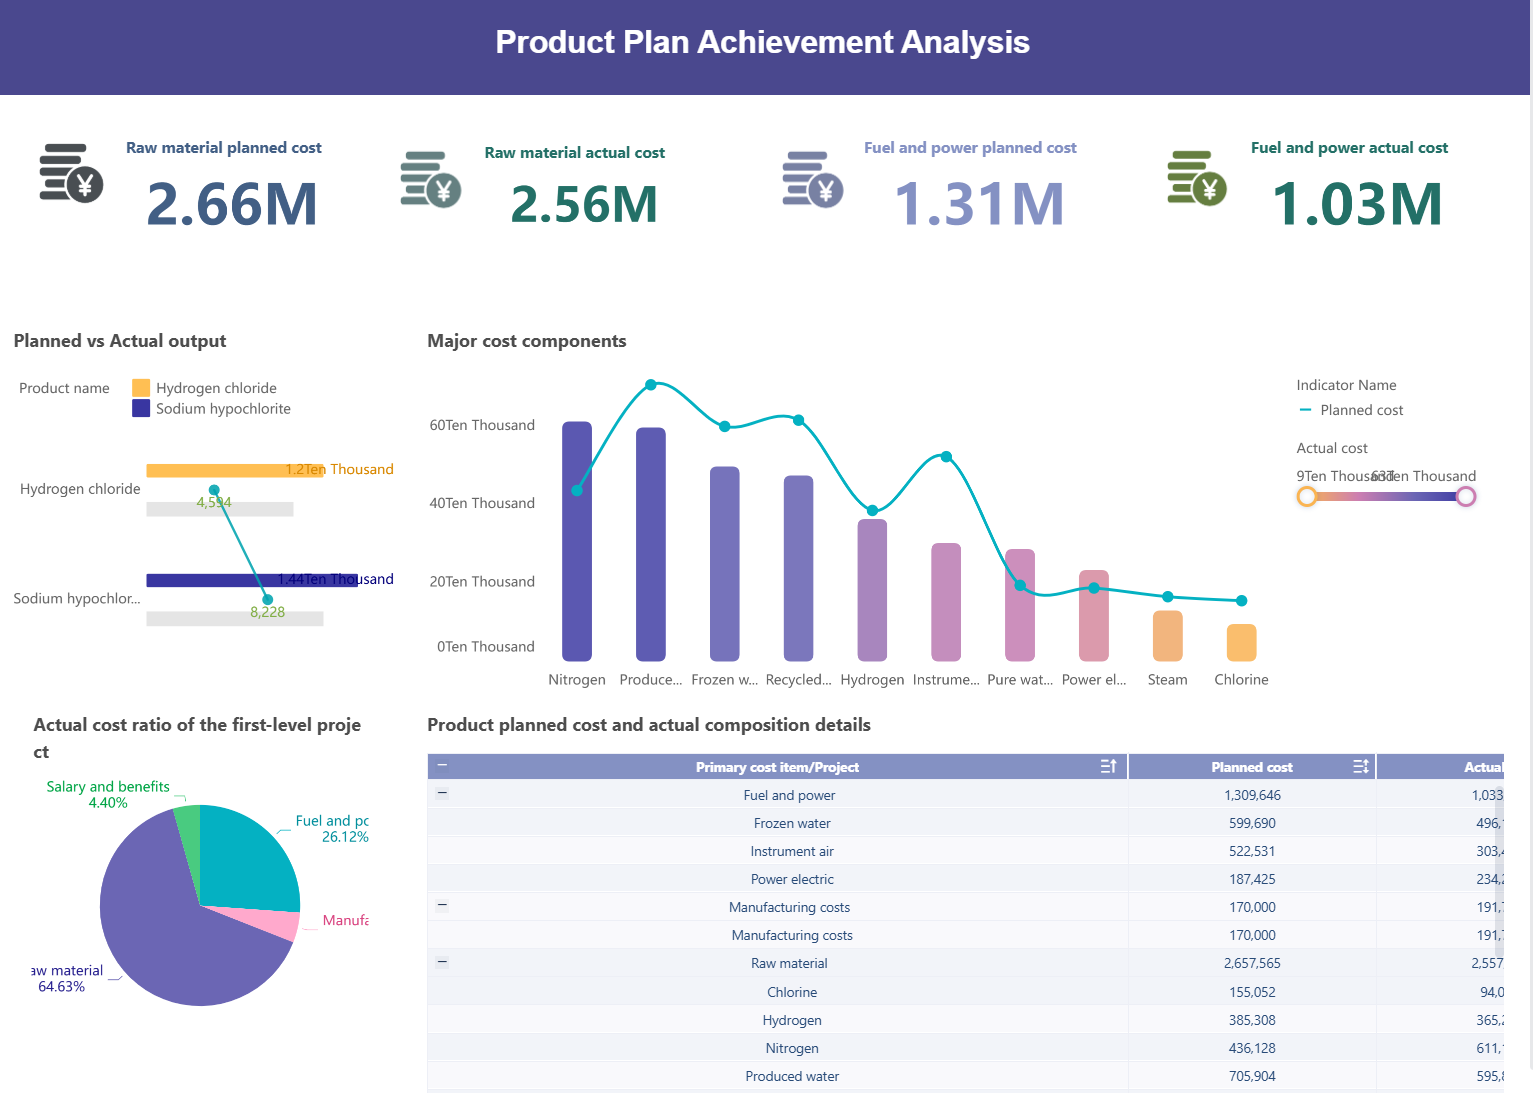
BOE Technology Group had trouble with messy data and different metrics. They fixed this by using FineBI to make metric definitions the same. BOE made 257 metrics clear across departments. This helped everyone use the same data and make better choices. You can do what BOE did by making your metrics clear and consistent.
Focus on metrics that help you take action. Actionable metrics show where to fix problems or improve things. Do not add too many metrics. Too much data can make your dashboard hard to use.
Here are ways to pick actionable metrics:
You can use a checklist for this step:
If you follow these steps, you build a dashboard that helps your team act fast. You see what matters most. You avoid clutter. You make your dashboard easy to use.
You need to connect lots of data sources to build a strong real-time dashboard. FineBI and FineDataLink make this easy for you. FineDataLink lets you connect to databases, cloud platforms, and files. You can break down data silos and bring all your information together. This makes real-time data processing simple and fast.
FineDataLink lets you sync data in real time. You can sync whole databases or just a few tables. You can also set tasks to run when you want. FineBI gives you two ways to get your data. You can use Direct Connection to run calculations in your database. You can also use Extraction to save data in FineBI’s engine for real-time data processing. This flexibility helps you handle dashboard parts from many sources.
Here is a quick look at what these tools offer:
| Feature | Description |
|---|---|
| Data Integration from Multiple Sources | Connects to many sources for complete real-time data processing. |
| Data Consistency | Keeps your data reliable and reduces errors. |
| Automated Data Synchronization | Updates your dashboard with the latest information automatically. |
| Seamless Data Transformation | Changes data into the right format for real-time data visualization and analysis. |
You want your dashboard to show accurate and useful information. Good data quality and consistency are very important. FineDataLink processes data all the way, making sure your real-time data stays reliable. FineBI supports ETL and ELT workflows, so you can clean, change, and organize your data before it gets to your dashboard.
Follow these best practices to keep your dashboard strong:
| Best Practice | Description |
|---|---|
| Dashboard Consistency | Use shared templates and variables for uniform dashboards. |
| Provide Context | Show metrics with trends and clear thresholds for better understanding. |
| Regularly Prune and Refine | Remove unused widgets to keep your dashboard focused. |
| Optimize for Performance | Reduce extra queries and set good refresh times for real-time data processing. |
| Use Consistent Layouts | Organize panels and use similar visuals for related data. |
You can use variables for dynamic filtering and add notes for important events. This helps you link changes in your real-time data to real-world actions. When you follow these steps, your dashboard will give you clear, up-to-date insights. You will see the benefits of real-time data visualization in every part of your business.
You want your observability dashboard to help you act quickly. Real-time alerts make this happen. You need to set clear rules and limits for your alerts. Start by picking the best alerting method for your needs. You can use static alerting, dynamic alerting, customized alerts, or SLO integration. Each method works for different real-time situations.
| Alerting Technique | Description | Key Considerations |
|---|---|---|
| Static Alerting | Uses fixed limits for metrics. | Needs careful setup for each real-time environment. |
| Dynamic Alerting | Changes limits using past real-time data. | Helps stop too many alerts by learning normal patterns. |
| Customized Alerts | Made for your platform and real-time setup. | Can use machine learning for better accuracy. |
| SLO Integration | Checks performance against real-time goals. | Matches real-time alerts with business goals and user needs. |
You should send alerts based on how important they are. This makes sure the right team gets the alert. Group similar alerts so you do not get too many messages. Set rules so only real-time issues that last trigger alerts. This stops alerts from short glitches.
FineBI’s data alert module lets you set real-time limits for any metric. You can choose to get notified by email or message when a value goes past a limit. You can also set up alerts for trends, not just single points. This helps you find problems before they get worse.
You can save time and make fewer mistakes by automating notifications and actions. Automation helps you respond to incidents faster. It also means you do not need to watch everything yourself. You can spot problems quickly.
Here are ways to automate real-time alerts:
FineBI lets you connect alerts to email, chat, or incident tools. This means your team gets updates wherever they are. You can also link alerts to CI/CD pipelines, incident response systems, and business reports. This keeps your data moving across your company.
| Integration Opportunity | Description |
|---|---|
| CI/CD pipelines | Check observability during deployments. |
| Incident response | Send real-time data into your workflows. |
| Development tools | Show insights in your coding environment. |
| Business reporting | Add metrics to your business reports. |
FineBI’s alerting and automation features help you stay ahead. You can act on real-time data, not just look at it. This makes your dashboard a tool for action, not just watching.
You should test your real-time dashboard with real users. Their feedback shows what works and what does not. Start by asking users for their thoughts after they use the dashboard. You can use surveys, interviews, or quick polls to get answers. Real-time feedback helps you find problems right away. You can set up a feedback loop to collect comments and see how people use the dashboard. This loop lets you make the dashboard better with each update and custom change.
Many groups use feedback loops to improve their dashboards. These loops help everyone see what is happening and make changes. You can watch what users do in real time and see how updates change the dashboard. When you use feedback loops, you build trust and give users more power. For example, FanRuan’s customers finished 30% more tasks and followed rules 25% better after adding real-time feedback.
You need to keep your real-time dashboard fresh and helpful. Making small changes all the time keeps your dashboard working well. Use these best practices to help you:
| Best Practice | Description |
|---|---|
| Continuous Monitoring and Feedback | Get real-time user input and check how the dashboard works often. |
| Training and Documentation | Teach users and keep easy guides for using the dashboard. |
| Cross-Department Collaboration | Share real-time ideas and match goals with other teams. |
| Implementing Automation | Use real-time tools to watch and improve dashboard performance. |
FanRuan’s customer stories show that real-time feedback and updates make dashboards better. You can use these steps to make your dashboard strong and ready for anything.


The Author
Lewis
Senior Data Analyst at FanRuan
Related Articles

10 Customer Intelligence Dashboard Tools Compared: Features, Pros, Cons & Best-Fit Teams
Compare 10 customer intelligence dashboard tools. See features, pros, cons, and which teams each tool is best for, from B2B to enterprise analytics.
Saber Chen
Apr 28, 2026

9 Open Source Metrics Dashboard Tools Compared for 2026: Which One Fits Your Team Best?
Compare Grafana, Metabase, Apache Superset, Redash, and Prometheus for metrics dashboards. Find the best open source tool for your team.
Lewis Chou
Apr 28, 2026

Chowbus Dashboard Guide: 7 Ways to Monitor Delivery Operations in Real Time
Learn 7 ways to use the Chowbus dashboard for real-time delivery monitoring. Track orders, drivers, and KPIs to improve on-time performance and operations.
Lewis Chou
Apr 28, 2026


