Data observability tools help you monitor, analyze, and improve the quality of your data across all systems. These platforms give you real-time monitoring so you can spot issues quickly and keep your business running smoothly. When you choose the best data observability software, you look for features like root cause analysis, recommendations, and automatic lineage. FineDataLink, SYNQ, Anomalo, Bigeye, Collibra, Validio, and Acceldata lead the market because they combine AI-powered observability and unified platforms. In 2025, 37% of data teams will use SaaS observability tools, showing a 42% increase year over year.
| Feature | Description |
|---|---|
| Root Cause Analysis | Identifies the underlying issues causing data problems, allowing for quicker resolution. |
| Recommendations | Provides actionable solutions to fix identified data issues, enhancing user confidence. |
| Automatic Lineage | Shows upstream and downstream data flow, helping to pinpoint the origin of data issues. |
| Ticketing Integrations | Streamlines issue management by integrating with existing ticketing systems. |
| Samples and Visualizations | Offers visual insights into data problems, aiding in understanding and resolving issues faster. |

Data observability tools play a crucial role in maintaining high standards of data quality. You rely on these platforms to enhance data integrity and correctness throughout your data pipeline. With real-time monitoring, you can spot issues as they arise and address them before they impact business operations. These tools provide insights into data quality problems, helping you understand the context and root causes. You benefit from proactive identification of errors and inconsistencies, which strengthens your overall data quality.
You measure improvements in data quality using several key metrics:
| Metric | Description |
|---|---|
| Data Time-to-Value | Measures how quickly you gain actionable insights, reflecting the efficiency of your data quality. |
| Data Processing Volume | Assesses how well your systems handle large volumes, showing the effectiveness of your workflows. |
| Storage Costs | Compares storage expenses to the percentage of actively used data, highlighting inefficiencies. |
With automated data incident detection, you can continuously track quality indicators, detect anomalies, and monitor data lineage in real time.
When you use the best data observability software, your data team gains significant business advantages. Real-time monitoring reduces troubleshooting time from days to minutes, improving operational efficiency. You make decisions based on data insights rather than intuition, which leads to better outcomes. These tools help align data quality with your business goals, ensuring that your data management supports strategic objectives.
Early alerts about discrepancies prevent last-minute issues, increasing your credibility with stakeholders.
| Business Outcome | Description |
|---|---|
| Improved efficiency in troubleshooting | You resolve issues faster, saving valuable time and resources. |
| Enhanced decision-making | You base decisions on reliable data, not guesswork. |
| Better alignment with business goals | Real-time visibility helps you meet organizational objectives. |
| Cost savings | Many organizations report saving time and money after adopting these tools. |
| Improved forecasting and profitability | Swift corrections maintain accurate stock levels and boost profitability. |
| Increased credibility | Early detection of problems builds trust with stakeholders. |
You also face challenges such as data quality issues, human error, and system failures. Real-time monitoring and incident response help you manage these risks effectively. Involving users outside the data team is essential, as their feedback can provide valuable insights for improving data quality.
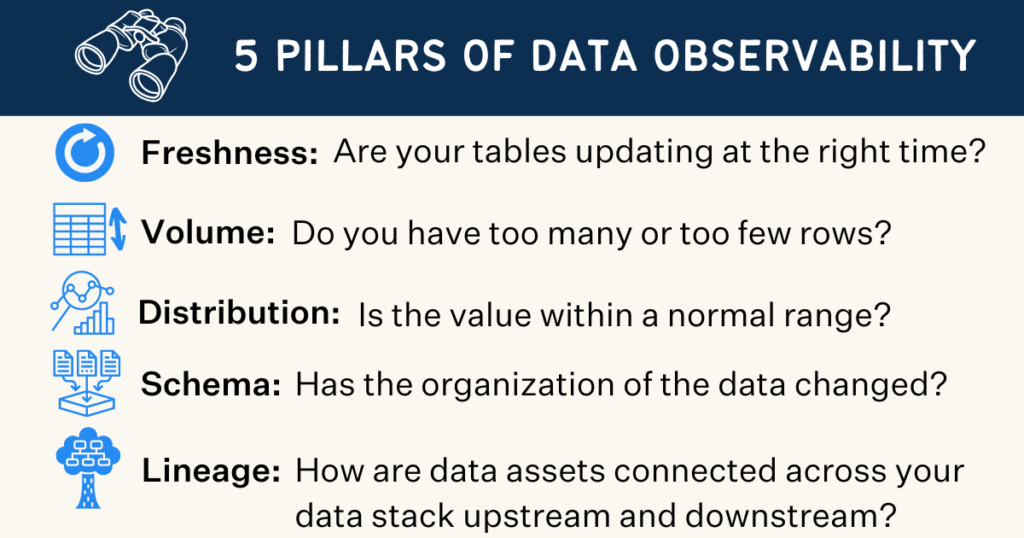
When you evaluate the best data observability software, you need to focus on features that help you maintain control over your data. You want tools that offer real-time monitoring and automated data incident detection. These features let you spot problems quickly and respond before they affect your business. The following table highlights essential features that industry experts recommend:
| Feature | Description |
|---|---|
| Freshness | Checks how recent your data is and identifies missing or outdated sources. |
| Distribution | Verifies that data falls within expected ranges and formats. |
| Volume | Confirms that all expected data arrives as planned. |
| Schema | Tracks changes in data structure and explains why they happen. |
| Lineage | Shows where data comes from and where it goes, including who handles it. |
| End-to-end visibility | Monitors for downtime and tracks anomalies across your data pipeline. |
| Rapid detection and resolution | Speeds up fixing data issues with automated alerts and lineage tracking. |
| Unified platform | Lets everyone work together to solve data problems in one place. |
| Automated discovery | Helps you find and manage metadata easily. |
You should consider ai-powered observability tools when you want deeper insights and faster incident response. These tools use artificial intelligence to analyze signals and find the root cause of data issues. Unlike traditional monitoring, which only alerts you when something breaks, ai-powered observability tools explain why problems happen and how they affect your business. The table below compares these approaches:
| Feature/Capability | AI-Powered Observability | Traditional Monitoring |
|---|---|---|
| Focus | Finds root causes using many signals | Alerts on set thresholds |
| Proactivity | Manages complex challenges early | Reacts to known failures |
| Handling of Non-Deterministic Outputs | Deals with unpredictable results | Limited in complex situations |
| Visibility | Shows full data flow and impact | Only shows isolated metrics |
| Insight Generation | Explains why issues occur | Tells you what is broken |
| Contextual Awareness | Connects alerts to business impact | Alerts only on threshold breaches |
You need the best data observability software to integrate with your existing systems and scale as your data grows. Many leading data observability tools offer native connectors for platforms like Snowflake, dbt, and Airflow. You can use APIs to connect custom pipelines and reveal metadata in your analytics tools. Integrated dashboards give you a unified view of performance metrics. Custom alerts help you respond quickly when service levels drop. These capabilities ensure your data platform can handle larger workloads over time.
Maintaining lineage at scale means you can trace anomalies or schema changes back to their origins quickly, even as your data environment expands.
Automated data incident detection and real-time monitoring work together to keep your data reliable as your business grows.

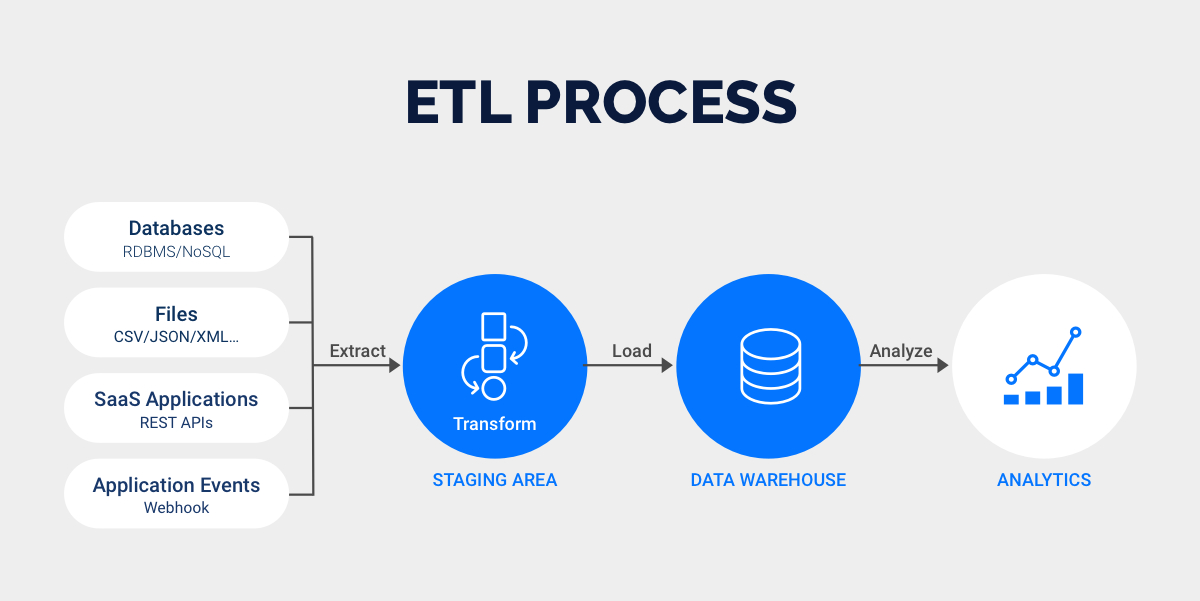
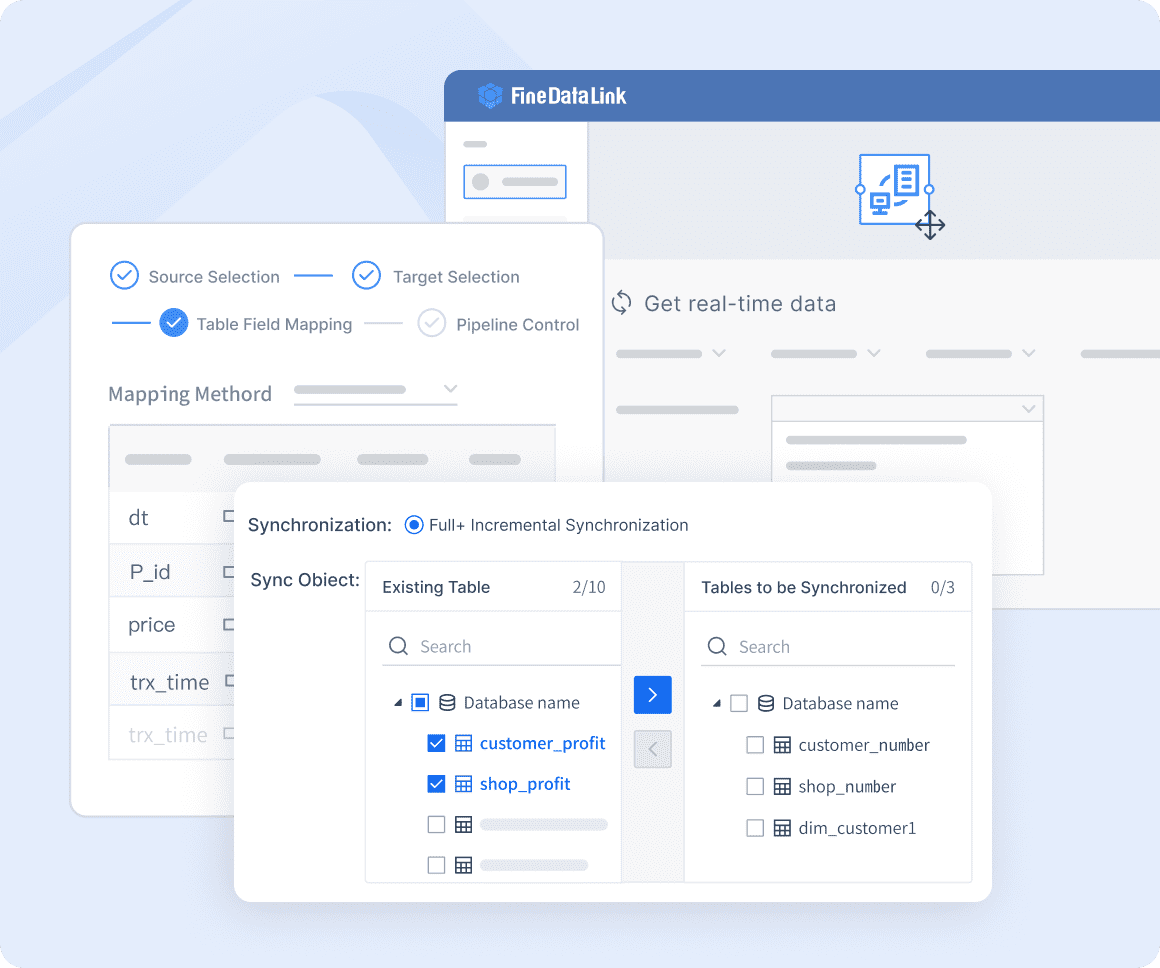
FineDataLink stands out as one of the best data observability software solutions for enterprise-level data integration. You use FineDataLink to synchronize data across multiple tables in real time, with latency measured in milliseconds. The platform supports ETL/ELT processes and enables API development without coding, which streamlines data sharing between systems.
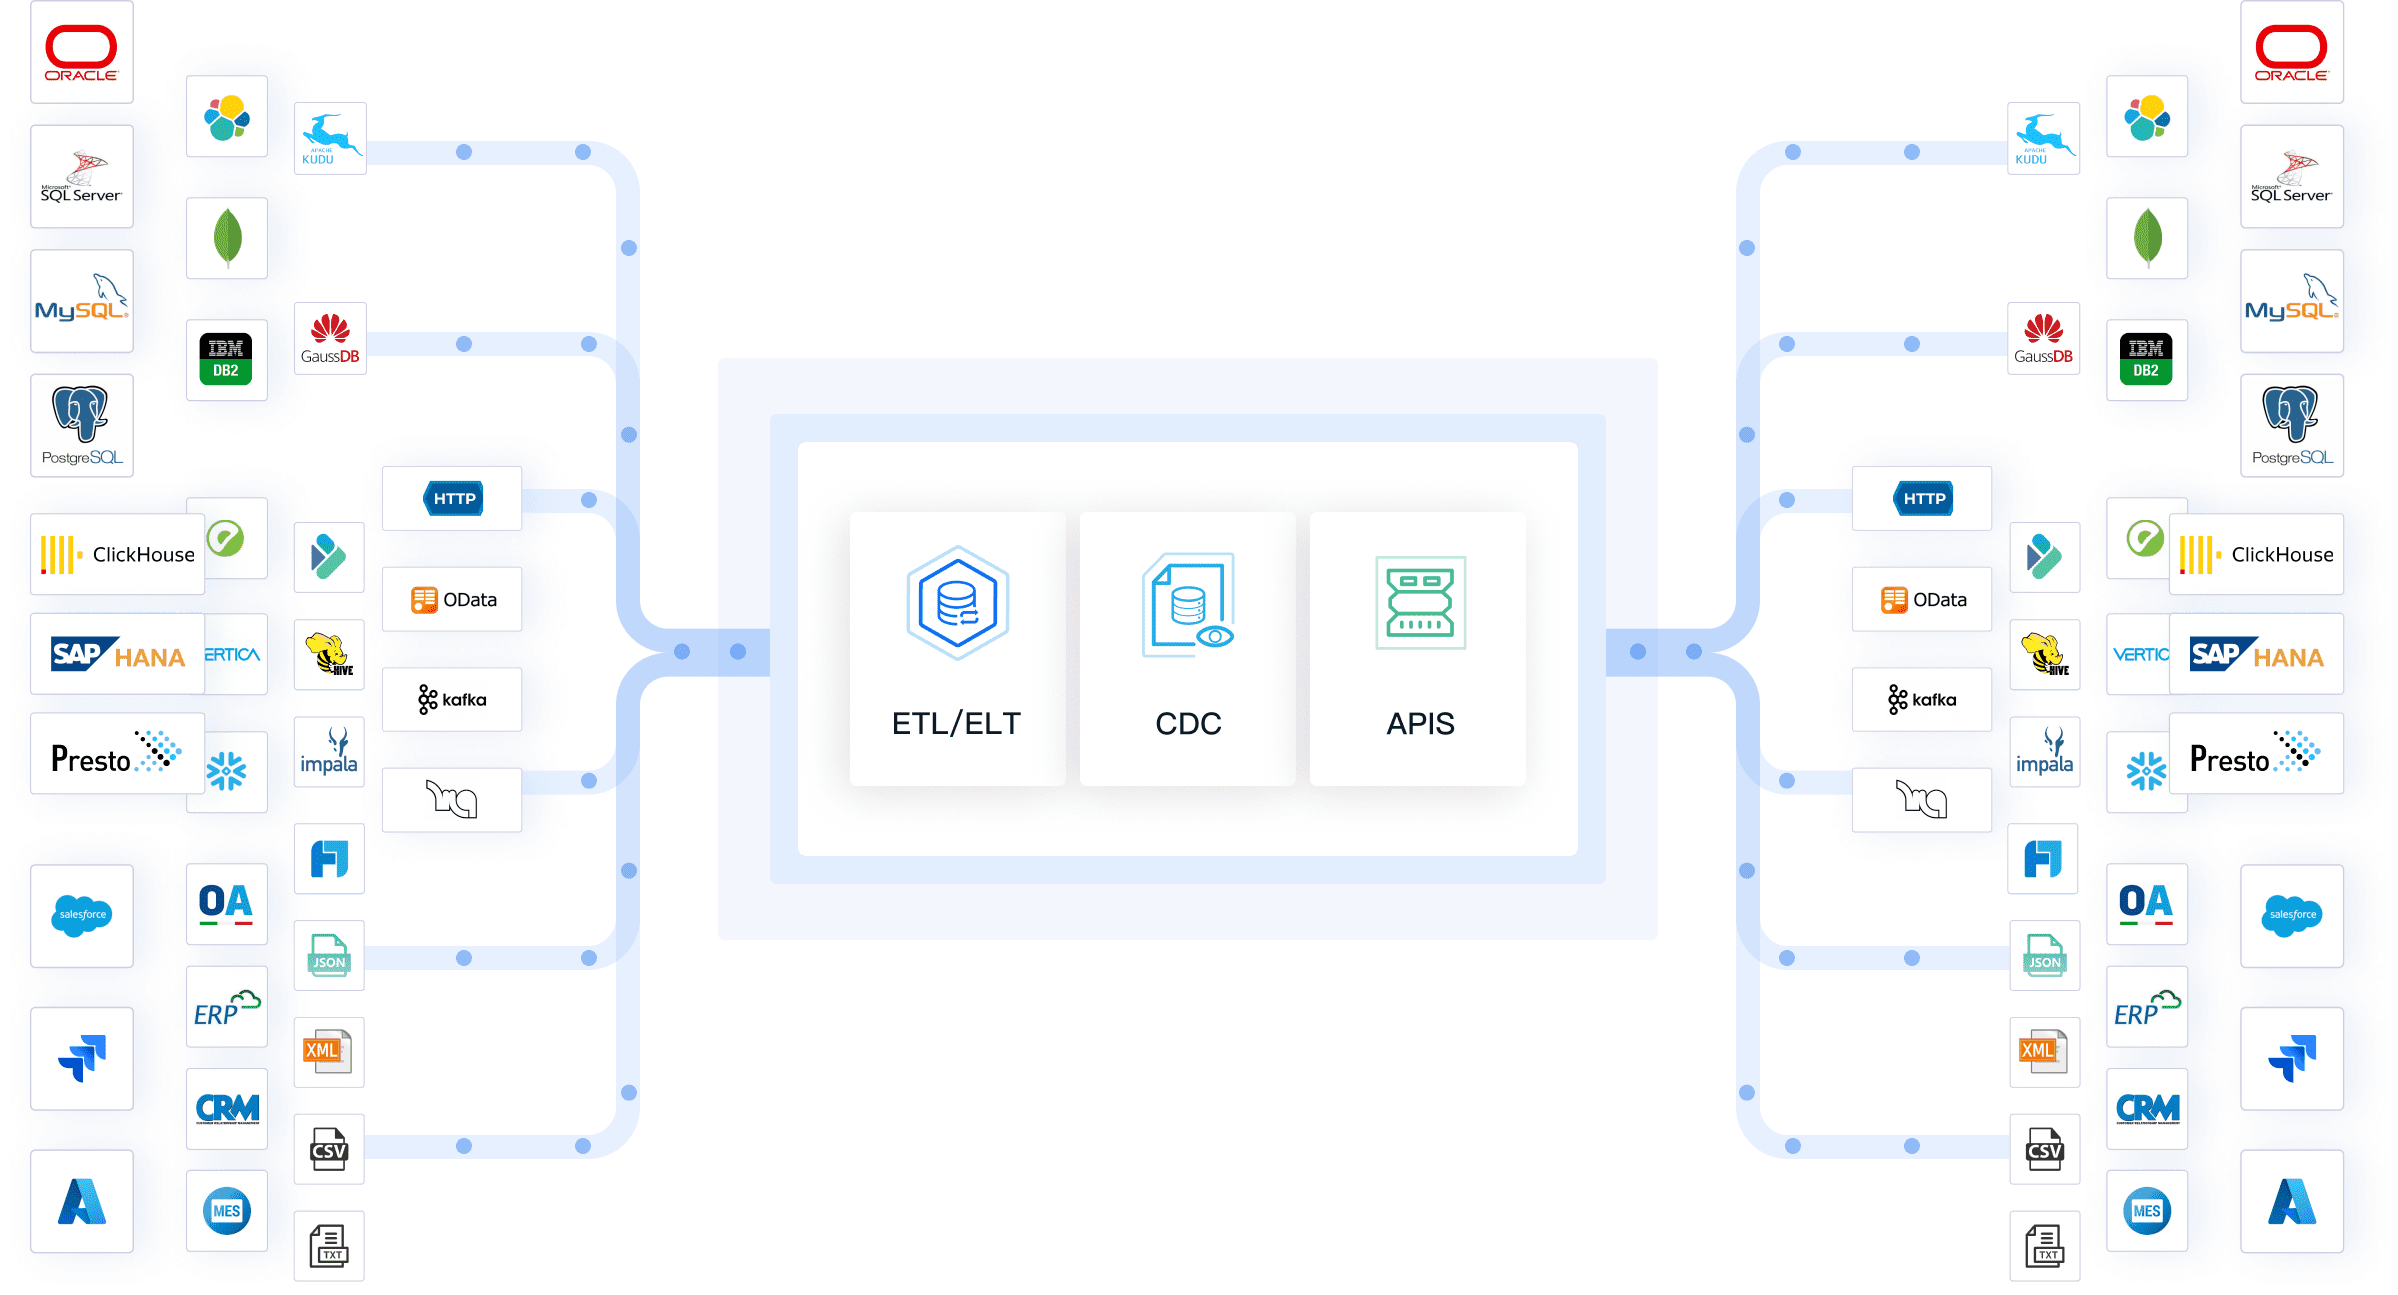
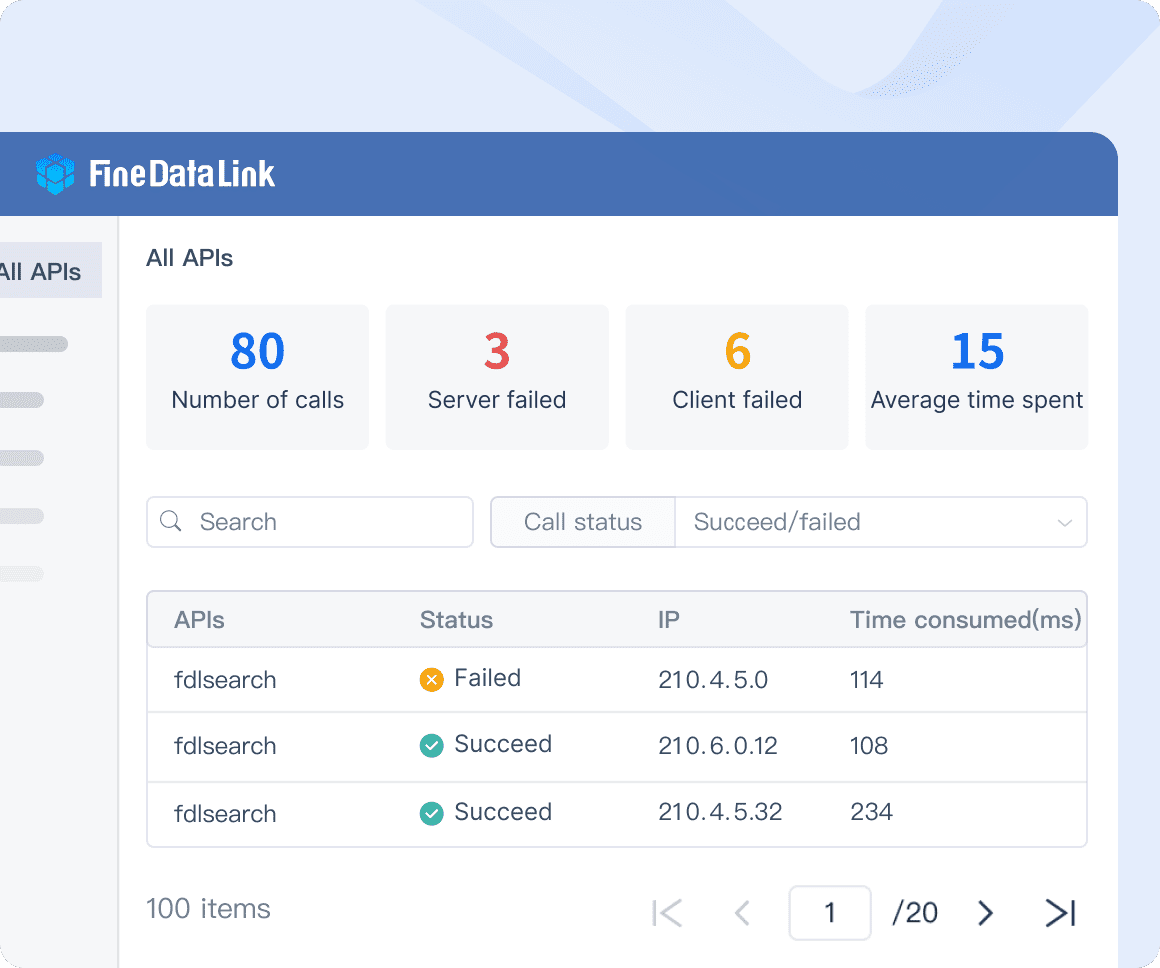
You benefit from a visual and modern operation interface, making deployment and management user-friendly. FineDataLink integrates with over 100 common data sources, allowing you to synchronize data from diverse environments. The platform’s data pipeline reduces pressure on business databases and supports real-time monitoring for incident response.
FineDataLink’s low-code approach simplifies complex data integration tasks. You build efficient and high-quality data layers for business intelligence, data management, and governance. The platform offers drag-and-drop operation, detailed documentation, and affordable pricing.
You can see the impact of FineDataLink through real-world customer success stories:
FineDataLink’s comprehensive feature set and proven results make it a top choice for organizations seeking robust data observability tools. You address challenges like data silos, complex formats, and manual processes while ensuring scalability and performance. The platform’s real-time monitoring and automated data incident detection help you maintain reliable data operations as your business grows.
You can use SYNQ to monitor your data ecosystem with a focus on clarity and automation. The platform tracks data freshness, distribution, volume, schema, and lineage. SYNQ uses AI to detect issues, analyze root causes, and triage alerts automatically. You define data products based on use cases, which helps clarify ownership and guide monitoring efforts.
| Feature | Description |
|---|---|
| Data Monitoring | Tracks freshness, distribution, volume, schema, and lineage to ensure data health. |
| AI Integration | Uses AI for improved issue detection, root cause analysis, and auto triage of alerts. |
| Data Product Definition | Structures data assets based on use cases, clarifying ownership and guiding monitoring. |
Users value SYNQ for its proactive issue detection and streamlined workflows. You benefit from auto triage, which reduces manual effort. The clarity in data product definitions improves your overall data management.
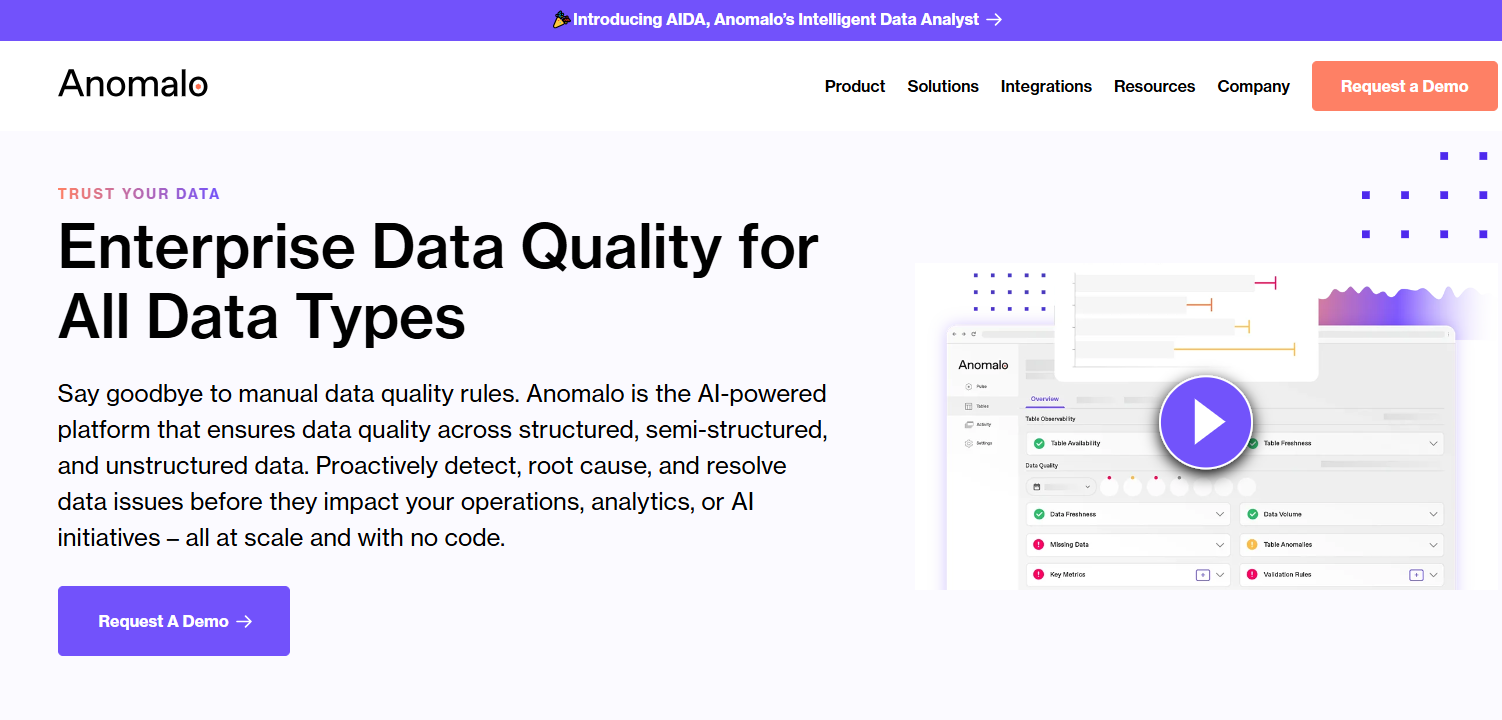
Anomalo stands out among data observability tools for its advanced AI-driven anomaly detection. You leverage unsupervised machine learning algorithms that learn normal data patterns and identify deviations. The platform automatically reduces false positives by distinguishing expected fluctuations from true anomalies. You can customize alert sensitivity to manage false positives effectively.
| Feature | Description |
|---|---|
| AI Technology | Learns normal data patterns using unsupervised machine learning. |
| Anomaly Detection | Identifies deviations from learned patterns to detect anomalies. |
| False Positive Management | Reduces false positives by distinguishing expected fluctuations from true anomalies. |
| User Customization | Allows you to tune alert sensitivity for effective management. |
Users appreciate Anomalo for its fast setup and intelligent anomaly detection. Enterprise users praise its scalability and API access. Some users report challenges with tuning sensitivity in high-volume environments. Ratings show strong user satisfaction, with scores of 4.4/5 on G2 and 4.8/5 on Gartner.
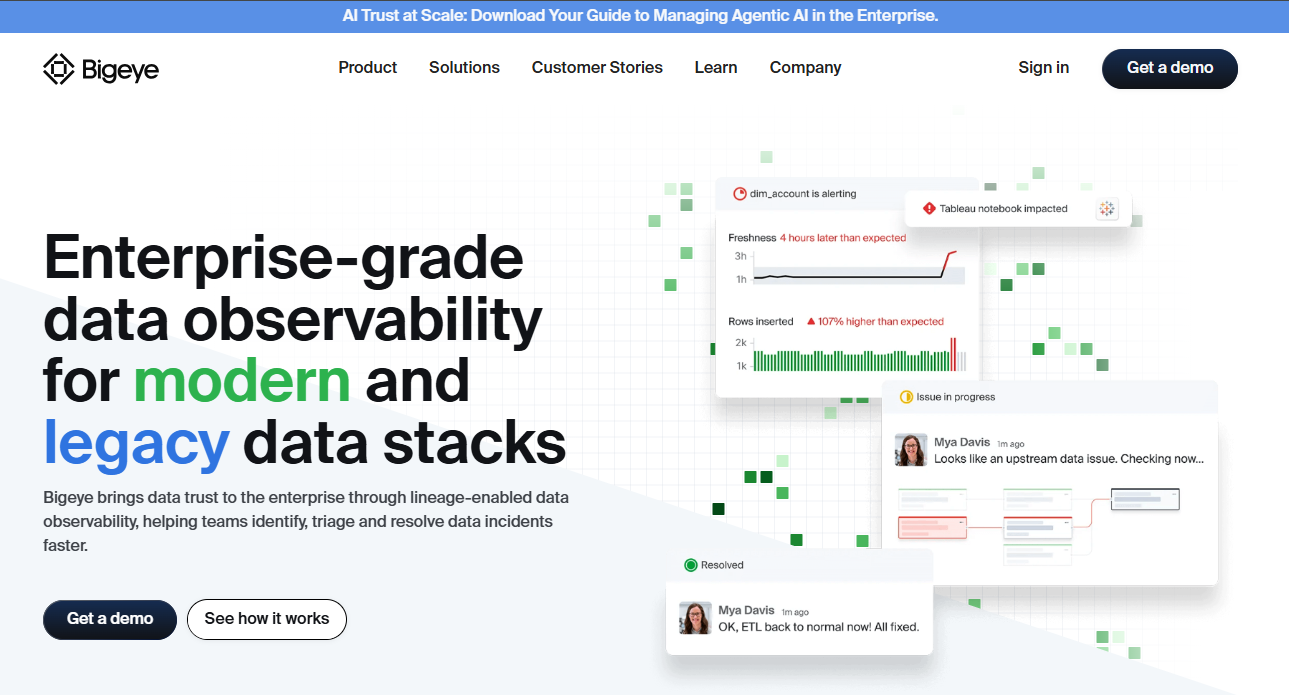
Bigeye offers a user-friendly interface and automated monitoring capabilities. You monitor data pipelines and receive alerts about anomalies. The platform integrates well with popular data platforms, though compatibility with niche systems may require careful consideration. Bigeye assumes a mature setup and deep engagement from your engineering team.
| Strengths | Limitations |
|---|---|
| User-friendly interface | Steep learning curve for SQL novices |
| Automated monitoring capabilities | Potential workspace clutter |
| Excellent customer support | High pricing for smaller teams |
Users praise Bigeye’s support team for responsiveness and helpfulness. You may need to spend time tuning alerts to make them useful. Once set up, the platform proves powerful for automated data incident detection and monitoring.
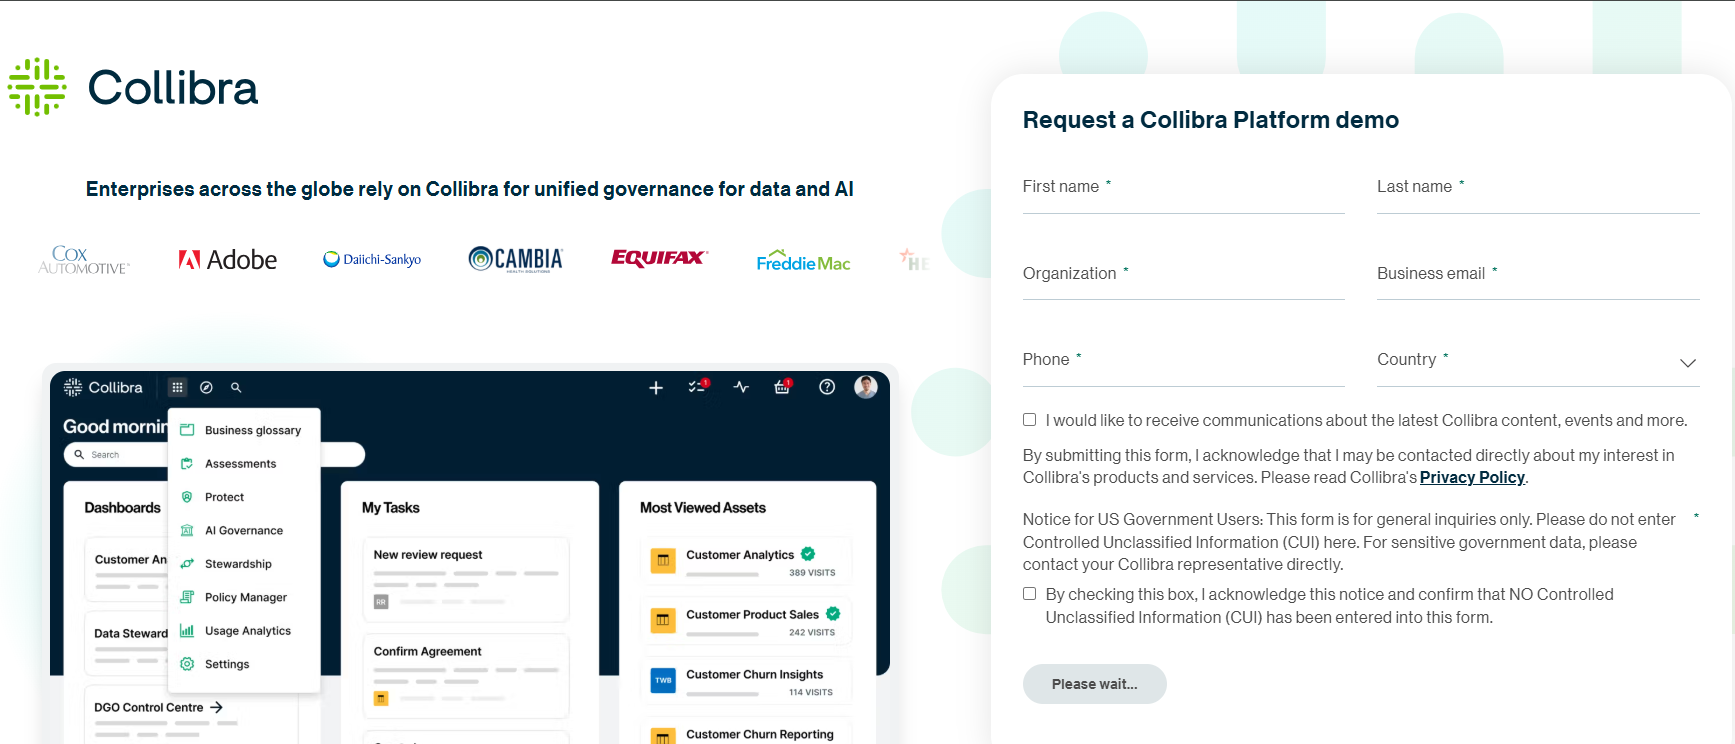
Collibra integrates data quality management within a governance framework. You benefit from automated rules, integrated issue management, and impact analysis. The platform allows custom rule development and SQL integration, which helps you connect with various tools. Recent API connections between observability and catalog features enhance flexibility.
Collibra’s approach to data observability tools supports enterprise-scale data governance and quality management.
Validio differentiates itself by supporting real-time monitoring of both data in motion and data at rest. You validate data from sources like Kafka, Pubsub, and Kinesis before ingestion into data tables. This capability enables end-to-end real-time data quality monitoring in your data pipelines.
Validio’s focus on real-time monitoring makes it a strong choice for organizations with dynamic data environments.
Acceldata enhances data observability in large-scale environments. You continuously monitor data pipelines to detect anomalies and optimize performance. The platform supports operational efficiency at scale, helping you maximize data investments and improve cost efficiency in data warehousing strategies.
Acceldata provides comprehensive monitoring and analytics for data pipelines. You derive actionable insights that enhance your data warehousing strategies. The platform ensures your data remains reliable and efficiently utilized, which is vital for incident response and business decision-making.
New Relic supports data observability tools with real-time data capture and cross-platform monitoring. You track user interactions across web and mobile applications. The platform offers customizable dashboards, allowing you to visualize critical data effectively. You can quickly identify and resolve issues through detailed monitoring and alerting features.
| Feature/Benefit | Description |
|---|---|
| Real-time Data Capture | Captures real-time data and tracks user interactions across applications. |
| Improved User Satisfaction | Enhances user satisfaction due to fewer outages and faster load times. |
| Faster Troubleshooting | Enables quick identification and resolution of issues. |
| Customizable Dashboards | Allows creation of dashboards tailored to business needs. |
| Cross-Platform Monitoring | Supports monitoring for both web and mobile applications. |
| Change Tracking | Tracks changes in the environment and assesses impact on metrics. |
Enterprise users report improved user satisfaction and faster troubleshooting with New Relic. You benefit from comprehensive insights and customizable dashboards.
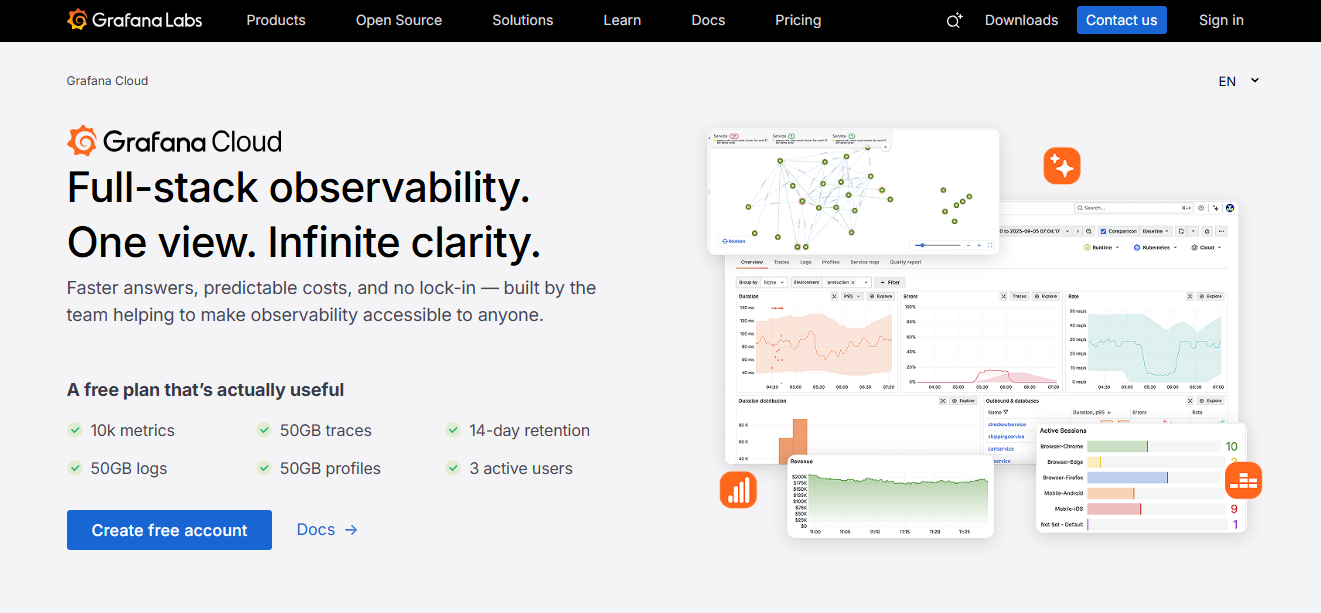
Grafana Cloud integrates open source technologies into a managed observability platform. You seamlessly switch between metrics, logs, and traces for better data correlation. The platform offers pre-built integrations for quick monitoring of infrastructure components like MySQL and Postgres. Preconfigured dashboards and alerts streamline your monitoring process.
Grafana Cloud’s flexibility and integration options make it a popular choice for organizations seeking unified observability.
Sentry addresses data observability challenges for engineering teams by providing robust error tracking and performance monitoring. You quickly identify and resolve errors in data pipelines. The platform delivers deep context for debugging data quality issues and reduces alert noise by grouping common errors.
Sentry’s focus on error tracking and performance monitoring supports engineering teams in maintaining reliable data pipelines.
Observe delivers a unified platform for data observability tools, focusing on scalability and integration. You monitor data pipelines, track anomalies, and visualize data lineage. The platform supports automated data incident detection, which helps you respond quickly to issues. You benefit from integrated dashboards and custom alerts that provide a comprehensive view of your data environment.
Observe’s scalable architecture and integration capabilities make it suitable for organizations with complex data ecosystems. You maintain visibility and control as your data grows, ensuring reliable operations.

You need to compare data observability tools to find the best fit for your team. The table below highlights key features of leading platforms, including FineDataLink, Bigeye, SYNQ, Anomalo, Collibra, Validio, and Acceldata. You can see which tools offer real-time monitoring, low-code interfaces, and advanced integration options for production systems.
| Tool | Real-Time Monitoring | Low-Code/No-Code | Data Source Integration | AI-Powered Observability | API Support | Scalability |
|---|---|---|---|---|---|---|
| FineDataLink | Yes | Yes | 100+ sources | Yes | Yes | High |
| Bigeye | Yes | No | Major platforms | Yes | Yes | Medium |
| SYNQ | Yes | No | Cloud, DBs | Yes | Yes | High |
| Anomalo | Yes | No | Cloud, DBs | Yes | Yes | High |
| Collibra | Yes | No | Enterprise DBs | Yes | Yes | High |
| Validio | Yes | No | Streaming, DBs | Yes | Yes | High |
| Acceldata | Yes | No | Big data platforms | Yes | Yes | High |
You want to understand how pricing models affect the value you get from the best data observability software. Some platforms use per-host or per-GB pricing, which can lead to unpredictable costs. Others offer simplified plans based on data volume or user seats. The table below summarizes pricing models and value for different team sizes.
| Tool | Pricing Model Description | Value Proposition for Team Size |
|---|---|---|
| Datadog | Per-host fees and per-GB ingestion costs, unpredictable bills | Best for large enterprises with significant budgets |
| Honeycomb | High-cardinality event data, strong OpenTelemetry support | Ideal for teams needing advanced debugging |
| New Relic | Data ingested and per-user seats | Suitable for teams wanting strong APM capabilities |
| Splunk | Enterprise-level pricing, no-sample tracing | Best for organizations needing comprehensive tools |
| Elastic | Self-hosted options for regulated industries | Good for teams needing control over data storage |
| Bigeye | Starts at $1,000/month | Flexible for teams with clear data quality ideas |
| Soda | Starts around $500/month | Developer-centric, technical implementation needed |
| Great Expectations | Free core, cloud starts at $500/month | Excellent for Python teams, focuses on testing |
| Datafold | Team plans start at $600/month | Proactive, great for dbt users |
| Acceldata | Enterprise pricing, tens of thousands annually | Strong for big data environments |
Smaller teams often prefer unified platforms to reduce tool sprawl. Larger organizations may integrate specialized tools for different functions across multiple teams.
You should match data observability tools to your team’s size and technical needs. FineDataLink works well for enterprises that need efficient integration across many production systems. Bigeye offers flexibility for teams with clear data quality goals. Soda suits developer-centric teams that want open-source foundations. Great Expectations is excellent for teams with Python skills who focus on testing. Datafold supports teams using dbt for proactive monitoring. Acceldata is strong for big data environments that require robust infrastructure monitoring.
You can choose unified platforms for small teams to simplify workflows. Large organizations often benefit from integrating specialized tools for advanced use cases.
You need to consider your team’s expertise, budget, and the complexity of your data environment when selecting the best data observability software.
You should start by matching data observability tools to your team’s unique requirements. Consider the types of data sources you use, the scale of your production systems, and your team’s technical skills. The table below outlines important criteria to help you evaluate options:
| Criteria | Description |
|---|---|
| Data Sources | Support for various data sources ensures comprehensive observability. |
| Scalability | The tool must handle growing data volume and complexity without slowing down. |
| Compliance | Adherence to regulations helps you avoid legal risks. |
| Multicloud Options | Integration with multiple cloud providers gives you a unified view. |
| Learning Curve | Easy-to-learn tools reduce training time and speed up adoption. |
| User Familiarity | Tools using common query languages let your team work efficiently. |
| Management Overhead | Low setup and maintenance needs free your team for strategic work. |
You should also look for features like cross-system data lineage, query change detection, and troubleshooting AI agents. These capabilities help you track data flow, spot changes, and resolve issues quickly.
Different scenarios call for different data observability tools. For example, you may need to tune performance, optimize resources, or resolve data quality issues. The table below shows where certain tools excel:
| Scenario | Description |
|---|---|
| Operate | Performance tuning, data quality, and data drift. |
| Adjust | Resource optimization and migrations. |
| Fund | Financial operations and cost control. |
| Design | Infrastructure and pipeline planning. |
| Simulate | Predicting resource needs. |
| Identify | Detecting cold data for storage savings. |
| Discover | Creating inventories of assets. |
| Resolve | Proactive resolution of data quality issues. |
| Alert | Quick identification of business indicator changes. |
You should select data monitoring solutions that fit your most frequent use cases. An ai-native approach can help you move from reactive to proactive data quality management.
When you implement data observability tools, you should follow best practices for success:
By following these steps, you can maximize the value of your data observability tools and support reliable data operations.

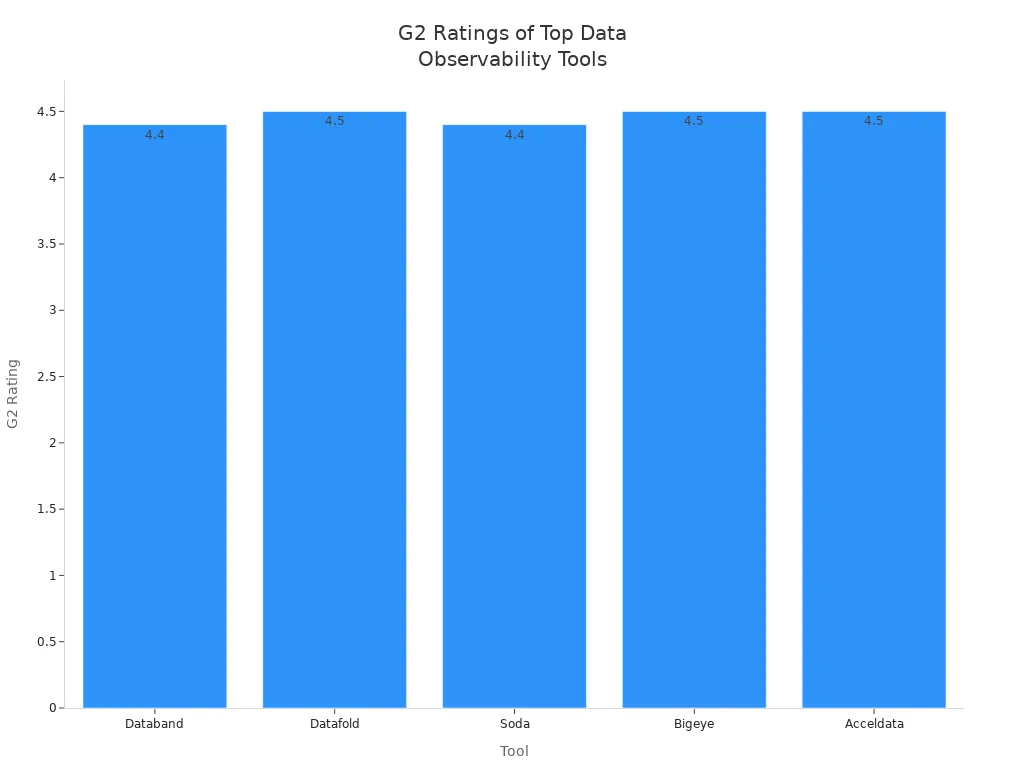
You have explored the leading data observability tools and their unique strengths. FineDataLink stands out for enterprise data integration with a low-code interface and support for over 100 data sources. The table below highlights how top tools compare:
| Tool | Strengths | G2 Rating |
|---|---|---|
| Bigeye | AI-powered monitoring, automated lineage | 4.5 |
| Acceldata | AI-driven, strong anomaly detection | 4.5 |
| FineDataLink | Real-time sync, low-code, 100+ integrations | — |
You should assess your team’s needs, data complexity, and integration requirements before choosing a tool. AI-powered observability and real-time integration help you future-proof data operations by predicting and resolving issues quickly. When you evaluate demos or free trials, involve your team, test alerting, and check if the tool supports test-driven development.
Enterprise Data Integration: A Comprehensive Guide
What is enterprise data and why does it matter for organizations
Understanding Enterprise Data Centers in 2025
Enterprise Data Analytics Explained for Modern Businesses

The Author
Howard
Data Management Engineer & Data Research Expert at FanRuan
Related Articles

11 Best Data Management Tool Options Compared in 2026: Features, Pros, Cons & Use Cases
Compare the best data management tools for 2026. Review features, pros, cons, and ideal use cases for platforms like FineBI, Microsoft Purview, and Talend.
Lewis Chou
Apr 26, 2026

7 Best Data Governance Platforms Compared: Pros, Cons, and Which Teams They Fit Best
A data governance platform is software that helps organizations define, manage, monitor, and enforce how data is cataloged, accessed, trusted, and used across the business. 7 best data governance platforms compared at a
Howard Chu
Apr 20, 2026
What is a data management platform in 2025
A data management platform in 2025 centralizes, organizes, and activates business data, enabling smarter decisions and real-time insights across industries.
Howard
Dec 22, 2025


