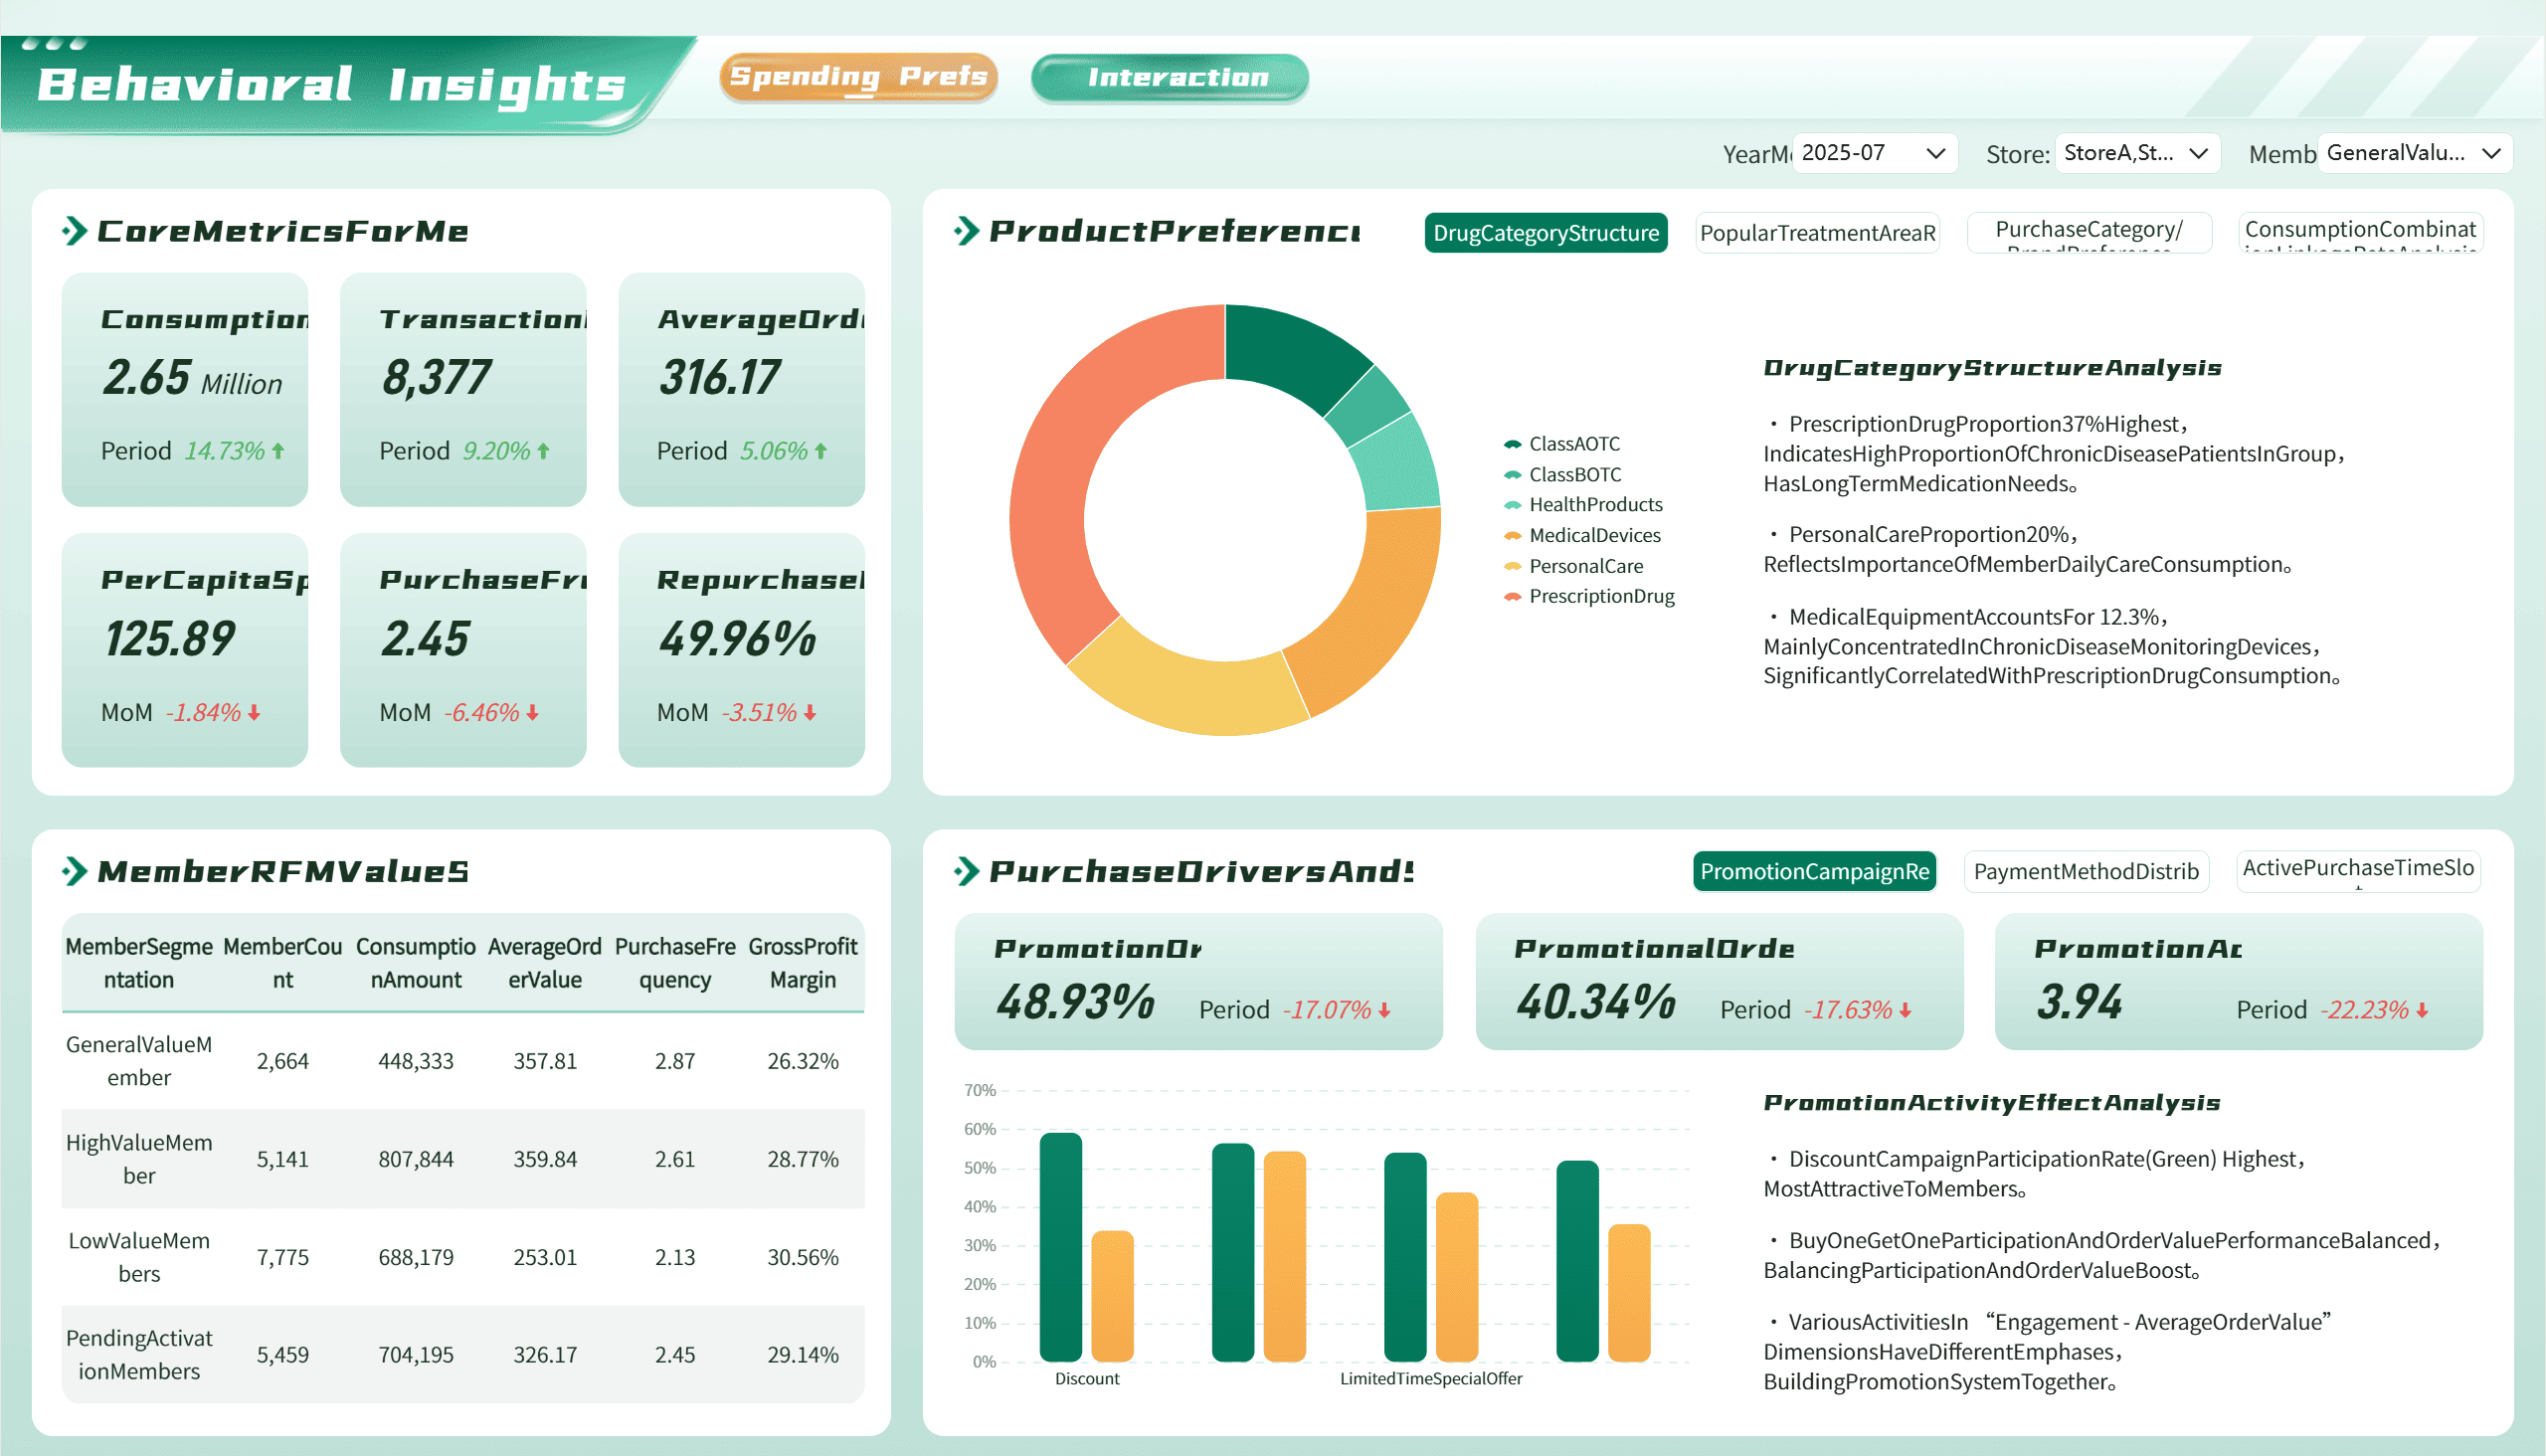
An insights dashboard shows your business data in a simple way. It changes hard information into pictures you can understand. You can see important numbers and watch your progress. You can also find problems all in one spot. Tools like FineBI let you use dashboards for real-time insights. These tools help you make smarter choices.

Dashboards give you more than just numbers. They show patterns, trends, and outliers with charts and graphs. This makes it easier to see what works and what needs help. You can use filters and drill down into details. This helps you find the cause of problems and spot hidden insights.
Here is how dashboards are different from old reporting tools:
| Feature | Insights Dashboards | Traditional Reporting Tools |
|---|---|---|
| Data Presentation | Real-time, interactive visualizations | Static, periodic reports |
| User Interaction | Dynamic exploration of data | Limited interaction |
| Decision-Making Support | Immediate access to KPIs and trends | Focus on historical data |
| Customization | High level of customization with visuals | Fixed metrics and formats |
| Purpose | Agile and informed business analytics | In-depth analysis and auditing |
You can use dashboards to download data and check memberships. You can monitor active memberships in real time. This helps you make quick choices and reach your goals.
FanRuan and FineBI give you strong tools to build and use dashboards. You can connect to many data sources like databases, files, and APIs. FineBI lets you drag and drop to make charts and dashboards without writing code. You can download data, change your view, and share insights with your team.
FanRuan and FineBI have these special features:
| Feature | Description |
|---|---|
| AI-Powered Self-Service Analytics | Lets you get insights fast without needing IT help. |
| Data Governance | Keeps your data safe and consistent across teams. |
| Natural Language Processing | Lets you ask questions in plain language and get answers quickly. |
| Flexible Dashboards | Helps you build and change dashboards easily for better decisions. |
| Advanced Data Management | Organizes your data by business subject for easy access. |
| User-Friendly Data Visualization | Lets you create visuals by dragging and dropping, making it simple for everyone. |
| Robust Collaboration Features | Makes it easy to share and work on dashboards with others. |
You can use these dashboards to download data and track KPIs. You can see data insights in real time. This helps you turn raw data into useful insights. You can spot trends, watch memberships, and improve your business with every insight.
FanRuan and FineBI help you go from just looking at numbers to making smart choices. You get a clear view of your data. This lets you act fast and reach your goals.
You can start with a simple dashboard in FineBI. The platform gives you tools to move around and change what you see. You can drag and drop charts, tables, and maps. You can add filters to focus on the data that matters most to you. You can also use adaptive layouts to arrange your dashboard the way you like.
FineBI lets you change the look and feel of your dashboard. You can pick colors and themes that match your style. You can add web components to show extra information or links. You can connect different charts so they work together. If you want to see more, you can use the jump function to move between dashboards for a bigger view.
| Feature | Benefit |
|---|---|
| Adaptive layouts | You can set up the dashboard to fit your needs. |
| Theme style customization | You can change how your dashboard looks. |
| Web components | You can show more information and make things clear. |
| Filters | You can focus on the data you want to see. |
| Component linkage | You can connect charts for deeper insights. |
| Jump function | You can see many dashboards together for a full picture. |
You can download data from any chart or table. This helps you study the numbers or share them with your team. You can also track KPIs and memberships in real time. FineBI makes it easy to see active memberships and download data for more study.
You can use analytics from your dashboard to make better decisions. Start by knowing what type of dashboard you have. Some dashboards show big-picture goals. Others help you look at details or track daily work. You can use new tools like machine learning to find patterns in your data.
Here are steps you can follow to get insights:
You can monitor key metrics in real time. This helps you spot problems or chances to improve. You can also analyze the data to learn why things happen. When you share your dashboard, your team can see the same numbers. This keeps everyone working toward the same goals.
Many companies use insights dashboards to get value from their data. For example, BOE used FineBI to bring all their data together. They built a data warehouse and made dashboards to track KPIs. This helped them cut inventory costs by 5% and boost efficiency by 50%. They could see active memberships and download data for deeper study.
| Benefit Type | Description |
|---|---|
| Open Enrollment Insights | You can see enrollment activity and make better decisions. |
| Self-Service Reporting | You can reduce mistakes and trust your data more. |
| Customer Satisfaction | You can make users happier by giving them tools to see their own data. |
| Revenue Increase | You can grow your business by making smarter choices. |
You can see these benefits in many industries. In manufacturing, dashboards show how each part of the process is working. In healthcare, dashboards help you study patient data and improve care. In banking, you can use analytics to understand what customers need. In retail, you can track store performance and inventory. In government, dashboards help you see how programs are working and use funds wisely.
| Industry Sector | Solution Description |
|---|---|
| Manufacturing | You can watch and improve every step of production. |
| Insurance | You can bring data together and use predictions to manage risk. |
| Healthcare | You can study large amounts of data to make better choices for patients. |
| Automotive | You can plan and track changes for more innovation. |
| Banking | You can use big data to offer better services and manage risk. |
| Government | You can see how money is used and make programs better. |
| Retail | You can track sales and inventory across many stores. |
| Telecom | You can monitor data and keep networks safe and efficient. |
Dashboards help you measure ROI by showing how your actions change results. You can use them to check performance, manage key activities, and reach your goals. When you automate data collection, you spend less time gathering numbers and more time finding insights.
When you start using an insights dashboard, you may face problems. Some people do not want to learn new tools. They may not use them every day. Sometimes, dashboards are made without knowing what is really needed. You might think the app is too hard or the technology is strange.
Here are some issues you might see:
You can fix these problems with smart ideas:
| Strategy | Description |
|---|---|
| Data Governance | Experts handle data governance so you can focus on insights. |
| User Engagement | Share updates and training so everyone understands the dashboard. |
| Steering Committee | Make a group with business users, analysts, and engineers to help everyone agree. |
You should talk to leaders and analysts often. This keeps the dashboard helpful and matches your goals. Always show only the most important information. Add details to your data pictures so you can make better choices.
To get the most from FanRuan analytics, you need a clear plan. Start with strong support from your leaders. When leaders use data insights, your team will follow. Build a skilled data team to manage and study data insights. Use tools like FineBI to turn hard data into easy insights.
Follow these steps for success:
You can use AI-native tools to add business context and make sure your results match your standards. Plan regular reviews to keep your insights dashboard up to date. When you download data, you can share insights with your team and make better choices faster.
Insights dashboards let you quickly see important numbers and trends. This helps you make better choices and grow your business. FanRuan and FineBI have simple tools for real-time data analysis. You can watch your progress, share what you find, and help your team stay on track. Use dashboards to work better and keep getting better results.


The Author
Lewis
Senior Data Analyst at FanRuan
Related Articles
How to Build a Churn Dashboard for Enterprise Retention Teams: KPIs, Layout, and Data Model
A churn dashboard is not just a reporting screen. For enterprise retention teams, it is the operating system for protecting renewals, prioritizing at risk accounts, and turning scattered customer signals into action.
Lewis Chou
May 03, 2026
6 Steps to Build a Customer Health Dashboard for Enterprise Customer Success
Learn the 6 steps to build a customer health dashboard for enterprise customer success teams. Define goals, choose signals, and drive retention and growth.
Lewis Chou
May 03, 2026

How to Build an Elementary Dashboard: 7 Must-Have Metrics for Attendance, Literacy, and Intervention Response
Learn the 7 essential metrics for building an elementary school dashboard to track attendance, literacy, and intervention response for timely student support.
Lewis Chou
May 03, 2026


