A monthly sales report does more than display numbers—it guides your team toward real business results in Malaysia. When you track key metrics like sales qualified leads, win rates, and sales cycle length, you spot patterns and respond quickly to challenges.
- These reports highlight top performers, reveal pipeline bottlenecks, and show which products drive growth.
- Clear commentary and actionable recommendations transform raw data into insight.
FineReport from FanRuan helps you create sales reports that are clear, relevant, and practical for business growth in Malaysia.

Key Takeaways
- Monthly sales reports do more than show numbers; they guide your team to improve sales and grow your business in Malaysia.
- Tracking key sales metrics like qualified leads, conversion rates, and sales cycle length helps spot problems early and find growth opportunities.
- Set clear goals for your sales report and choose the right KPIs to focus on what matters most for your business success in Malaysia.
- Know your audience in Malaysia and customize your sales reports to deliver the right insights to sales teams, managers, and executives.
- Collect accurate and relevant sales data by using automation and validation tools to ensure trustworthy reports.
- Use charts, graphs, and dashboards to turn complex data into easy-to-understand visuals that help your team act quickly.
- End your sales report with clear, prioritized recommendations that link insights to specific actions for better results.
- Regularly review and update your sales reports to keep them aligned with changing business needs in Malaysia and support continuous improvement.
Purpose of a Monthly Sales Report in Malaysia
Why Sales Reporting Matters
You need more than just numbers to steer your business in Malaysia in the right direction. A monthly sales report gives you a clear view of your sales health and helps you make informed decisions. When you use sales reporting, you track progress against your goals and spot issues before they become bigger problems. This process supports your team in staying focused and adjusting strategies quickly.

Fact-based decision-making removes guesswork. Analytics turn your data into insights, helping you act with confidence. Most companies now rely on data-driven reports to stay competitive and support growth.
Sales reporting matters because it:
- Captures key performance indicators (KPIs) and data sets for a complete view of your sales.
- Tracks and measures progress, so you know what drives performance.
- Identifies and solves problems early, such as low sales or high churn.
- Optimizes your sales process by evaluating each stage of the funnel.
- Boosts productivity by providing actionable insights for your team.
- Predicts future revenue by analyzing trends and customer behavior.
- Supports all stakeholders, from sales teams to executives, in making better decisions.
- Delivers timely and relevant data, allowing you to adjust strategies for sustained growth.
Statistics show that over 40% of sales representatives monitor KPIs weekly, and most companies review their sales pipelines at least monthly. More than half use interactive dashboards to track team performance. These habits prove that regular sales reporting is essential for monitoring and improving business performance in Malaysia.
Results to Drive
An effective sales report does more than summarize activity. It drives real results by focusing on the metrics that matter most to your business in Malaysia. You should track KPIs that align with your goals and help your team improve.
Some proven result metrics include:
- Number of contracts signed per quarter
- Dollar value of new contracts
- Qualified leads per month
- Engaged leads in the sales funnel
- Average time for conversion
- Lead conversion rate
- Number of closed contracts
Tracking these metrics helps you set targets, measure progress, and identify opportunities for growth. For example, monitoring your lead conversion rate shows how well your team turns prospects into customers. Watching the average time for conversion helps you find ways to shorten the sales cycle.
Tip: Use tools like FineReport from FanRuan to automate your sales reporting. FineReport connects to multiple data sources, creates interactive dashboards, and delivers reports on schedule. This efficiency lets you focus on analysis and action, not manual data gathering.

When you align your sales reports with business objectives in Malaysia, you empower your team to act on insights and drive continuous improvement. Effective sales reporting transforms data into a roadmap for growth.
Setting Objectives for Effective Monthly Sales Report in Malaysia
Define Report Goals
You set the direction for your sales reporting by defining clear goals. Think of your monthly sales report as a navigation tool for your team. When you know where you want to go, you can choose the right path and measure your progress along the way. Without clear goals, even the hardest work may not lead to real results.
- Clear objectives help you select the right KPIs and focus on what matters most.
- You ensure that your sales report collects the right data and communicates insights that drive action.
- You can track progress, adjust strategies, and make timely decisions if you see that you are not meeting your targets.
For example, tracking sales performance is like monitoring your fitness journey. You need to know your starting point, set a target, and check your progress regularly. This approach keeps your team motivated and focused on predictable revenue growth. When you define the purpose and key information for your sales report, you make it actionable and relevant.
A well-structured sales report starts with an executive summary and a clear introduction. Explain the purpose of the report and why each KPI matters. This structure helps stakeholders quickly understand the insights and take action. FineReport from FanRuan supports this process by allowing you to customize reports for different business needs in Malaysia. You can organize your data, highlight important metrics, and present information in a way that matches your goals.

Tip: Align your metrics with your report goals to keep your sales reporting focused and free from clutter. This makes your report more effective and easier to use.
Know Your Audience in Malaysia
You create a more effective sales report when you know who will read it. Different stakeholders need different information. Sales managers may want to see team performance, while executives focus on revenue trends and forecasts. By defining your audience in Malaysia, you ensure your sales reporting delivers the right insights to the right people.
Research shows that understanding your audience in Malaysia leads to better engagement and higher sales. When you segment your audience in Malaysia and tailor your message, you connect more deeply with their needs. For example, customer success stories that match your audience’s challenges can help move leads through the sales funnel and close deals. Developing detailed buyer personas based on real data helps you choose the right metrics and presentation style for your sales reports.
FineReport makes it easy to tailor your sales reporting for different stakeholders. You can create dashboards for executives, detailed reports for sales teams, and summary views for other departments. This flexibility ensures everyone gets the information they need to make informed decisions.
Note: Regularly review your audience’s needs in Malaysia and update your sales reporting to keep it relevant and effective.
Data Collection and Quality of Monthly Sales Report
Gather Relevant Sales Data
You need to collect the right sales data to build a report that drives results. Start by identifying the sources that matter most to your business in Malaysia. These may include CRM systems, web forms, phone calls, and even direct feedback from prospects. When you gather data, focus on information that aligns with your business goals in Malaysia. Avoid collecting unnecessary details that can clutter your report.
Follow these best practices to ensure comprehensive and reliable data collection:
- Ask prospects for information directly through calls or web forms to capture qualified leads.
- Practice ethical data collection. Be transparent with customers, let them choose what to share, and maintain clear privacy policies.
- Collect only the data you need. This keeps your report focused and actionable.
- Automate data collection using online forms and data scanners. Automation reduces human error and speeds up the process.
- Use sales intelligence tools to verify, enrich, and maintain the accuracy of your sales data.
Tip: Before integrating data, understand the quality and state of each source. Align your integration efforts with clear business goals in Malaysia and plan for future growth.
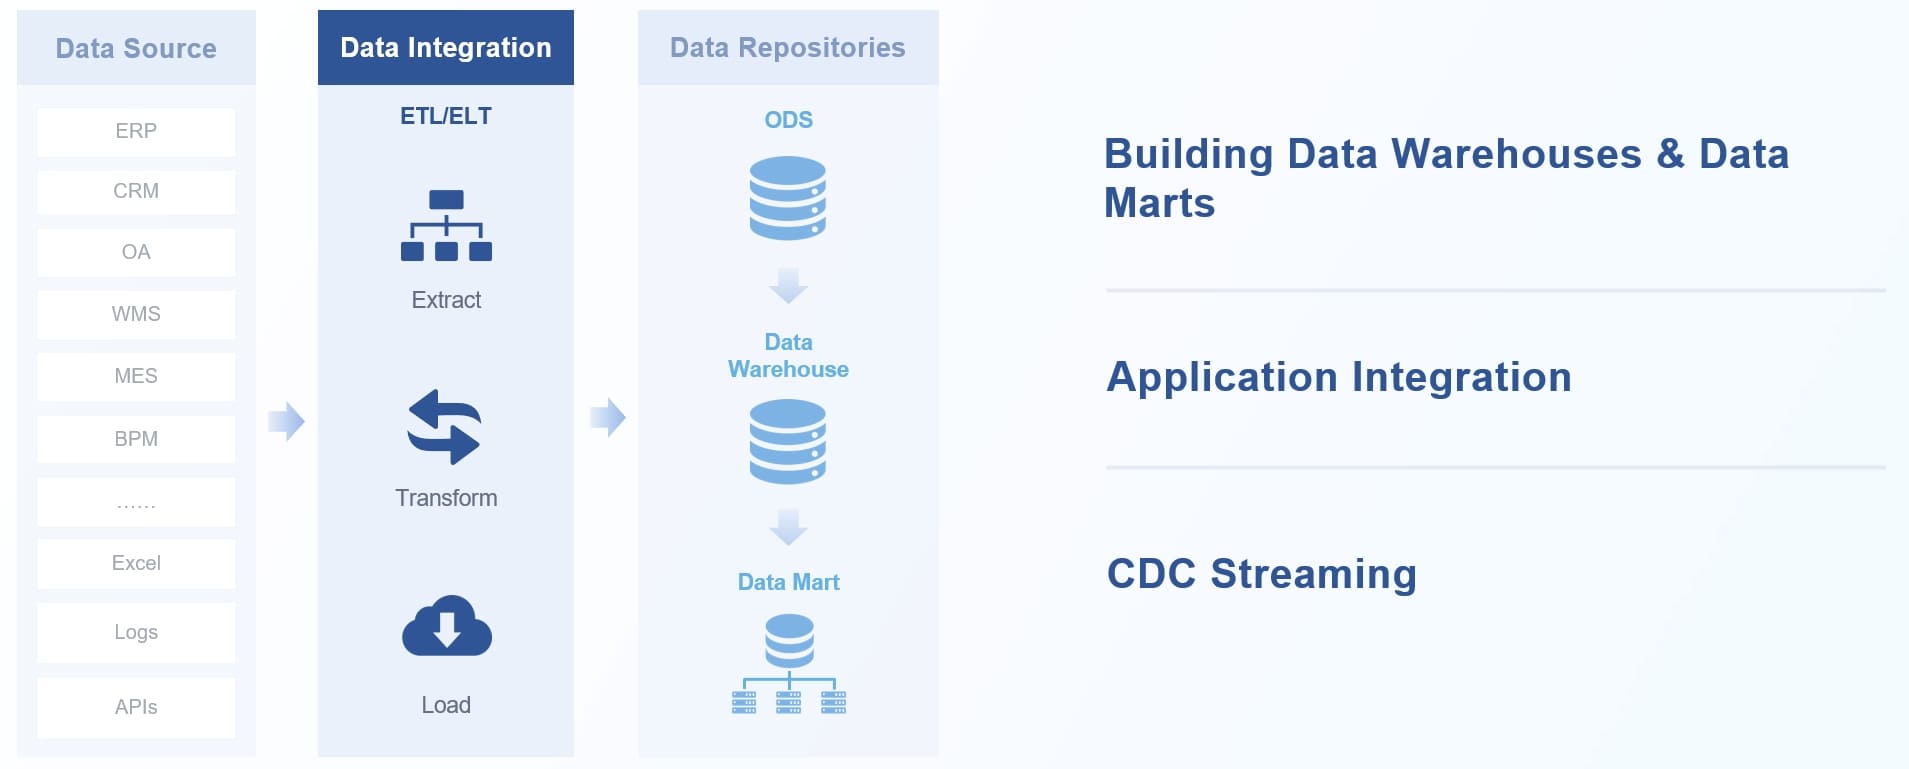
FineReport and FineDataLink from FanRuan make it easy to connect and integrate data from multiple sources. FineDataLink supports real-time synchronization and ETL/ELT processes, help
ing you build a unified and high-quality data layer for your reports. This integration gives you a complete view of your sales performance and enables better decision-making.
Ensure Data Accuracy
Accurate sales data forms the backbone of effective reporting. When your data is correct, you can trust your insights and make better business decisions in Malaysia. Studies show that improved data entry processes, employee training, and validation checks lead to higher accuracy scores. Automation and reliable software like FineReport also play a key role in reducing errors.
Data Validation Steps
You can follow these steps to validate your sales data:
- Profile your data to assess its accuracy and completeness.
- Detect and remove outliers that may skew your results.
- Cross-check data fields against each other for consistency.
- Cleanse your data by auditing and correcting errors.
- Use ETL tools like FineDataLink to validate data as it moves through your pipelines.
- Monitor data in real time to track changes and maintain governance.
Note: Accurate sales data improves forecasting, streamlines inventory management, and boosts productivity across your team.
Avoiding Common Pitfalls
Poor data quality can waste time, cause missed opportunities, and damage your reputation. To avoid these pitfalls:
- Regularly audit and clean your data.
- Update records promptly to keep information relevant.
- Train your team on best practices for data entry and management.
- Use automated tools to minimize manual errors.
- Plan for scalability so your data processes grow with your business in Malaysia.
When you prioritize data quality, you gain a competitive advantage. You make smarter decisions, improve customer service, and drive better results from your monthly sales reports.
Key Metrics in Monthly Sales Report
Select Sales KPIs
You need to choose the right key performance indicators to make your monthly sales report effective. The right KPIs help you focus on what matters most for your team and your business in Malaysia. When you track the right sales metrics, you gain a clear view of your sales performance and can quickly spot areas for improvement.
Consider these important metrics for your sales kpi reports:
- Sales cycle length: Shows how long it takes to close a deal. Shorter cycles often mean a more efficient process.
- Pipeline coverage ratio: Measures how much potential business in Malaysia you have compared to your targets.
- Sales rep ramp time: Tracks how quickly new team members reach full productivity.
- Number of calls made and emails sent: Reflects your team's engagement and outreach efforts.
- Meetings scheduled: Indicates progress in moving leads through the sales funnel.
- Conversion rates at each stage: Pinpoints where leads drop off and where you can improve.
- Bookings per representative: Helps you monitor individual performance and plan resources.
- Total sales revenue and revenue by product: Gives you a broad and detailed view of your sales health.
- Monthly recurring revenue growth: Tracks your ability to acquire and retain customers.
- Year-over-year growth: Measures your progress and supports goal setting.
Tip: Use a mix of activity-based, conversion, and productivity metrics to get a complete picture of your sales process.
Research shows that consistent measurement and evaluation of KPIs ensures their reliability and value. Studies in large organizations confirm that you should select a focused set of KPIs—usually 8 to 12—to avoid data overload. Combining quantitative and qualitative metrics, and tracking both leading and lagging indicators, gives you a balanced view of your sales performance.
FineReport’s dashboard features make it easy to track these KPIs in real time. You can create interactive dashboards that display your most important metrics, helping you monitor trends and take action quickly. Automated data collection and visualization save you time and reduce errors, so you can focus on analysis and improvement.

Align Metrics with Business Goals
You drive better results when you align your sales metrics with your company’s strategic objectives. Many organizations struggle with this alignment, but those that succeed see significant improvements in financial performance and operational efficiency.
Follow these steps to ensure your metrics support your business goals in Malaysia:
- Identify your main objectives, such as revenue growth, customer acquisition, or product expansion.
- Select KPIs that directly measure progress toward these goals.
- Limit your KPIs to the most critical ones to keep your reports clear and actionable.
- Combine financial, operational, and customer-focused metrics for a well-rounded view.
- Regularly review and update your KPIs to match changing strategies.
Studies show that companies aligning their metrics with strategy outperform competitors by up to 25%. For example, Starbucks increased revenue by 22% by focusing on customer experience and digital sales. Amazon improved profitability by 30% through strategic alignment of financial goals and business initiatives.
Note: When you use FineReport, you can customize dashboards to highlight the metrics that matter most for your business in Malaysia. This flexibility ensures your sales reports always support your current strategy.
By carefully selecting and aligning your KPIs, you turn your monthly sales report into a powerful tool for growth. You empower your team to focus on the right actions and drive continuous improvement.
Visualizing Sales Data in Monthly Sales Report
You can turn complex sales data into clear, actionable insights by using the right visualization tools. FineReport gives you the power to present your sales reports in ways that make trends, patterns, and key metrics easy to understand. When you use visuals, you help your team see the story behind the numbers and make faster, smarter decisions.
Charts and Graphs in FineReport
Charts and graphs transform raw data into visuals that highlight what matters most. You can use different chart types to match the message you want to share. For example, line charts show trends over time, while bar charts compare sales across products or regions. Pie charts break down sales by category, making it easy to see which products drive the most revenue. Scatter plots and heatmaps reveal patterns and relationships that might stay hidden in tables.
- Visualizations provide clarity by making complex data easy to understand.
- Charts and graphs tell a story more effectively than long text or tables.
- Visuals help you spot trends, spikes, or dips in your sales metrics, so you can adjust your strategy quickly.
- You can validate your assumptions by comparing forecasts with actual results.
- Visual aids like bar charts and infographics highlight growth patterns and help you identify new opportunities.
FineReport supports over 70 chart styles, including line, bar, pie, scatter, and polar charts. You can use contrasting colors to highlight important data points and make your sales reports more engaging. Interactive charts let you drill down into details, so you can explore metrics at every level.

Tip: Use visuals to simplify your sales analytics. When you present data visually, your team can grasp key metrics faster and act on insights with confidence.
Dashboard Layouts in FineReport
Dashboards bring all your key metrics together in one place. With FineReport, you can design dashboards that give you an instant overview of your sales performance. You can track revenue, conversion rates, sales cycle length, and other important metrics on a single screen. This setup helps you monitor progress and respond to changes in real time.
- Dashboards organize data into digestible segments, making it easier for everyone to understand.
- You can use multi-report layouts to display several tables or charts side by side. This approach lets you compare different metrics, such as sales by region and sales by product, without switching between reports.
- Dashboards support collaboration by giving your team a unified view of goals and results.
- Real-time data visualization means you always have the latest information at your fingertips.
FineReport’s dashboard layouts are fully customizable. You can choose from tiled, vertical, horizontal, or full-screen views to match your workflow. Drag-and-drop features make it easy to add or rearrange charts and tables. You can even create mobile dashboards, so you and your team can track sales metrics on the go.

Note: When you use dashboards and multi-report layouts, you turn your sales reports into powerful decision-making tools. You help your team focus on the metrics that matter and drive better results.
Actionable Recommendations of Monthly Sales Report
Link Actions to Insights
You should always end your monthly sales report with clear, practical recommendations. Data alone does not drive change—actions do. When you connect your insights to specific business actions in Malaysia, you help your team move from analysis to improvement.
Start by reviewing the trends and gaps you identified in your report. For example, if your conversion rate dropped last month, recommend targeted training for your sales team or a review of your lead qualification process. If a product line outperformed others, suggest reallocating resources to maximize its growth.
Actionable recommendations transform your sales report from a summary into a roadmap for success. Companies that follow this approach see measurable improvements in sales performance and team alignment.
Consider these steps to link actions to insights:
- Define the report’s goal and timeframe to focus your analysis.
- Collect and visualize essential data points, such as calls made, leads generated, and revenue.
- Interpret trends and identify performance gaps.
- Summarize key takeaways for decision-makers.
- End with a clear action plan that addresses issues and outlines strategies for improvement.
Sales reports that highlight key metrics—like conversion rates, customer churn, and sales forecasting—help you spot strengths and weaknesses. You can then recommend actions such as adjusting sales strategies, refining customer targeting, or investing in new technology. For instance, tracking customer lifetime value (CLV) may reveal the need to focus on retention programs, while high cart abandonment rates could prompt a review of your checkout process.
A real-world example comes from Netflix. The company analyzes user data to provide personalized content recommendations. These actionable insights increase engagement and reduce churn, proving that data-driven actions lead to strategic gains.
Tip: Use FineReport’s dashboard features to visualize your findings and make your recommendations stand out. Visuals help stakeholders quickly grasp the “why” behind your suggested actions.
Prioritize Next Steps
Not all recommendations carry the same weight. You need to prioritize next steps to ensure your team focuses on actions that deliver the greatest impact. Start by evaluating each recommendation based on its potential effect and feasibility. Assign ownership and set clear success metrics for each action.
Follow this structured approach to prioritize effectively:
- Establish key performance indicators (KPIs) that align with your strategic goals.
- Monitor these KPIs regularly to turn raw data into actionable insights.
- Collect feedback from your team and customers to identify the most impactful changes.
- Rank your recommendations by their expected business impact and ease of implementation.
- Assign responsibility for each action and communicate expectations clearly.
- Track progress and measure outcomes after implementation.
Prioritizing next steps ensures your team acts on the most valuable opportunities first. This discipline fosters accountability and accelerates business results in Malaysia.
Research shows that organizations using a deal scoring framework—where next steps and buyer commitments are confirmed—see higher win rates and more accurate forecasts. By scoring deals based on completeness and buyer validation, you improve pipeline quality and forecast reliability. This approach demonstrates that prioritizing next steps leads to tangible improvements in sales performance.
You can also use impact-feasibility criteria to evaluate options, select promising solutions, and assign ownership. This method keeps your team aligned and focused on continuous improvement. For example, if your sales pipeline report reveals bottlenecks at a specific stage, prioritize actions that address those issues first. Assign a team member to lead the initiative and set clear metrics to measure success.
Note: FineReport enables you to automate follow-up tasks and track progress on your recommendations. Scheduled reporting and real-time dashboards keep everyone informed and accountable.
By ending your monthly sales report with prioritized, actionable recommendations, you turn insights into measurable business outcomes. You empower your team to act with confidence, drive continuous improvement, and achieve your strategic goals.
Continuous Improvement in Monthly Sales Report
Review and Refine
You should treat your monthly sales report as a living document. Regular review and refinement keep your reports relevant and effective. When you revisit your report format and content, you spot outdated metrics, unclear visuals, or missing insights. This process helps you maintain accuracy and drive better business results in Malaysia.
Many organizations use proven frameworks to guide continuous improvement. The table below shows some popular methods and their impact:
| Framework | Focus and Purpose | Common Tools / Methods | Example and Results |
|---|---|---|---|
| Lean Management | Reduce waste, streamline workflow, visualize key processes | Value stream mapping, 5S, Kanban, Kaizen events | A furniture maker saved 30 minutes daily by organizing tools, boosting morale and output. |
| Six Sigma | Reduce variation and defects, improve satisfaction | DMAIC, root cause analysis, statistical control | Electronics line cut defects from 4% to 2% by fixing calibration errors in three months. |
| Total Quality Management (TQM) | Quality focus at every level, customer satisfaction | Employee training, feedback loops | Hotel chain improved service using employee feedback, rolling out improvements chain-wide. |
| PDCA (Plan-Do-Check-Act) | Iterative cycle for testing and learning | Project charters, 5 Whys, dashboards | Software team tests fixes on small groups, measures results, and decides on adoption or revision. |
Regular review helps you catch errors early, improve clarity, and ensure your sales report matches your business goals in Malaysia.
You can use dashboards and scheduled reporting to keep your team informed and engaged. Frequent evaluation of performance metrics highlights areas for improvement and supports growth. Many companies hold one-on-one meetings to review progress, break down large goals into smaller tasks, and set clear incentives. This structure motivates your team and boosts productivity.
FanRuan offers ongoing support and training resources to help you optimize your reporting process. You can access tutorials, best practices, and expert guidance to refine your reports and stay ahead of industry trends.
Adapt to Business Needs in Malaysia
Your business changes over time. Customer preferences shift, new products launch, and market conditions evolve. You need to adapt your sales reports to reflect these changes. When you update your reports, you ensure that your team always works with the most relevant information.
- Nike uses real-time customer data from its website, app, and stores to personalize marketing. This approach increased customer engagement by 45% and improved conversion rates by 35%.
- American Express monitors customer interactions with sentiment analysis. By adjusting support strategies, they raised customer satisfaction by 35% and reduced negative feedback by 20%.
These examples show the power of adapting your reports and strategies to current needs. You can integrate new data sources, update KPIs, and adjust your dashboards to match business priorities. FineReport from FanRuan makes it easy to customize your reports as your business grows in Malaysia. You can add new metrics, change layouts, and automate updates without starting from scratch.
Stay flexible and proactive. Regularly review your sales reports, seek feedback from your team, and use FanRuan’s resources to keep your reporting process sharp and aligned with your goals.
Different Types of Monthly Sales Report in FineReport
FineReport gives you the flexibility to create a variety of monthly sales reports that match your business needs in Malaysia. You can use these reports to track progress, motivate your team, and make better decisions. Let’s look at three powerful types you can build in FineReport.
Sales Leaderboard
A sales leaderboard shows you how each sales representative performs in real time. You can see who leads in quota attainment, pipeline coverage, and deal velocity. This type of report uses dashboards to display key metrics, such as:
- Quota attainment percentage
- Number of deals closed
- Pipeline health
- Commission progress
You can personalize views for each rep, helping them spot areas for improvement and focus on high-priority activities. Leaderboards also add a gamified element, encouraging healthy competition and boosting motivation. Real-time updates keep everyone informed, which leads to faster decisions and greater accountability. Many companies report an 18% increase in engagement and a 15% rise in deal closures after using live leaderboards. You can use these insights to optimize your sales performance management and recognize top performers.
Tip: Use FineReport’s real-time dashboards to consolidate data from your CRM and compensation systems. This approach reduces manual errors and improves forecasting accuracy.
Overall Sales Performance

An overall sales performance report gives you a complete view of your team’s results. You can track total revenue, conversion rates, and customer retention report data. These reports help you spot strengths, weaknesses, and trends at every level—individual, team, and organization.
Here’s a sample table of key metrics you might include:
| Metric | Description |
|---|---|
| Total Revenue | Sales generated in the month |
| Quota Attainment | % of target achieved |
| Conversion Rate | Leads turned into customers |
| Pipeline Efficiency | Deals moving through each stage |
| Customer Retention | Repeat customers and churn rate |
Visualizations like line graphs and funnel charts make it easy for you to understand complex data. You can align these reports with your business objectives and adjust your strategy as priorities shift. Real-time data integration lets you respond quickly to market changes or internal challenges.
Note: FineReports customizable dashboards help you monitor these metrics and support data-driven business strategy decisions in Malaysia.
Multi-dimensional Sales Analysis
Multi-dimensional sales analysis lets you dig deeper into your sales data. You can break down results by region, product, channel, or contact method. This type of sales analysis report helps you answer questions like:
- Which products have the highest profit margin?
- What regions deliver the most revenue?
- Which outreach channels convert best?
You can track metrics such as lead conversion rate, average conversion time, and sales by contact method. Monitoring sales targets, retention, and churn rates helps you understand lost customers and revenue trends. FineReport’s analytics tools let you visualize these patterns, making it easier to act on your findings.
Treat your sales data as a story. Tailor your reports to your audience in Malaysia so everyone—from executives to sales reps—can understand and use the insights.
With FineReport, you can automate alerts, schedule regular reports, and use AI-driven recommendations to improve your sales process. These features support better decision-making, faster coaching, and stronger business growth in Malaysia.
A well-structured monthly sales report gives you the clarity and direction needed for business growth in Malaysia. Industry case studies show that actionable reports—like sales revenue, KPI, and pipeline conversion reports—help you track progress, solve problems, and drive results:
| Report Type | Description | Business Impact |
|---|---|---|
| Sales Revenue Report | Tracks total sales revenue and growth rates | Focuses on revenue growth and financial performance |
| Sales KPI Report | Monitors key performance indicators | Supports real-time decisions and strategic goals |
| Pipeline Conversion Report | Measures opportunity movement through sales stages | Identifies bottlenecks and guides process improvement |
Leverage FineReport from FanRuan to streamline your sales report process. Start implementing these tips, monitor your results, and keep refining your monthly sales report for ongoing success.
Click the banner below to try FineReport for free and empower your enterprise to transform data into productivity!

Continue Reading About Sales Report
Sales Report Sample: Templates and Guidelines
Daily Sales Report: Key Elements, Samples & How to Create
The Ultimate Guide to Creating a Sales Dashboard: Tips and Tricks


FAQ

The Author
Lewis
Senior Data Analyst at FanRuan
Related Articles

7 White Label Reporting Tool Options Compared: What Agencies and SaaS Teams Should Evaluate Before Buying
A white label $1 is software that lets you deliver dashboards, reports, or analytics experiences under your own brand instead of the vendor’s. If you are a marketing agency, consultancy, SaaS company, or product team, yo
Yida Yin
Jul 01, 2026

Automated Reporting for Clients: How to Keep KPI Definitions and Permissions Under Control
$1 for clients only works when two things stay stable as reporting volume grows: metric meaning and access control . Without those controls, teams may send reports faster, but they also scale inconsistency, confusion, an
Yida Yin
Jun 28, 2026

ESG Reporting Framework Explained: How to Choose Between GRI, ISSB, ESRS, SASB, and CDP
Choosing the right $1 framework is no longer a side task for sustainability teams. It affects regulatory readiness, investor communication, customer trust, internal decision making, and how efficiently your organization
Yida Yin
Jun 28, 2026