Daily sales reports play a pivotal role in boosting your sales performance. These reports provide actionable insights, helping you make timely decisions that optimize operations and drive revenue growth. For instance, retailers using POS data achieve 35% faster inventory turnover and 21% higher conversion rates. By analyzing daily sales data, you can uncover trends, adjust pricing strategies, and improve customer retention by 27%. Tools like FineReport streamline sales reporting, enabling you to automate report generation and focus on strategic improvements. With clear and efficient reporting, you can transform raw data into valuable insights that enhance sales success.
Creating an effective daily sales report involves focusing on key elements that provide actionable insights. These elements ensure your report is not just a collection of numbers but a tool that drives better decision-making and sales performance.
The metrics you include in your daily sales report should focus on activities that your sales team in Malaysia can control. Tracking these metrics helps you evaluate performance and identify areas for improvement. Here are some essential metrics to consider:
Focusing on process metrics rather than outcome metrics ensures you can monitor daily efforts effectively. For example, tracking the number of calls made or emails sent helps you understand the consistency of your team’s efforts.
| Metric | Description |
|---|---|
| Sales cycle length | Measures the time customers spend at each deal stage and the overall sales cycle duration. |
| Sales conversion report | Provides insights into the number of leads, opportunities, and deals at various funnel stages. |
| Daily sales reports | Summarizes daily activities, including calls made, opportunities created, and deals closed. |
Tracking these metrics can lead to significant improvements. For instance, analyzing the number of meetings scheduled helps you assess the effectiveness of your team’s outreach efforts. Quick responses to prospects also increase the likelihood of closing deals.
A clear and simple sales report ensures that everyone can understand the data without confusion. Avoid overloading your report with excessive details. Instead, focus on presenting the most relevant information in an organized manner.
Here are some tips to enhance clarity:
For example, a report that uses a pie chart to show the percentage of closed deals by region is easier to interpret than a table filled with raw numbers. Simplicity ensures that your team in Malaysia can quickly grasp the insights and take action.
Tip: A well-structured report acts as a navigation tool for your sales team in Malaysia, guiding them toward their goals.
Accuracy and consistency are critical for building trust in your sales reporting. Inaccurate data can lead to poor decisions, while inconsistent reports can confuse your team in Malaysia. Implementing quality control methods ensures your data remains reliable.
| Quality Control Method | Description | Example |
|---|---|---|
| Data Validation | Ensures initial data accuracy and consistency. | Checks incoming transaction data against historical patterns in financial reporting. |
| Transformation Accuracy | Verifies correct data transformations. | Confirms that sales data aggregated by region reflects the sum of individual transactions. |
| Data Integrity Checks | Ensures data remains intact during storage and processing. | Verifies that patient records in healthcare databases remain consistent over time. |
| Consistency Verifications | Ensures uniformity across different systems and datasets. | Confirms that employee information is consistent across HR and payroll systems. |
| Completeness Verification | Ensures all required data fields are populated. | Checks that all necessary fields in customer survey datasets are filled out. |
By implementing these methods, you can maintain the integrity of your sales data. For example, verifying that all required fields are filled ensures your report provides a complete picture of sales activities. Consistency across reports also helps your team in Malaysia track progress over time without confusion.
Your daily sales report should always align with the needs of its audience. A report designed for sales managers will differ from one meant for executives or team members in Malaysia. Understanding your audience in Malaysia ensures that the report delivers the right insights to the right people, enabling them to make informed decisions.
When you tailor your sales report to its audience, you make it more actionable and impactful. Each stakeholder has unique priorities and responsibilities. For example:
Tip: A one-size-fits-all report often leads to confusion or missed opportunities. Customizing your report ensures that every recipient gets the information they need to excel in their role.
To make your report relevant, consider these steps:
| Audience | Key Metrics to Include | Preferred Format |
|---|---|---|
| Sales Managers | Team performance, pipeline status | Detailed tables and graphs |
| Executives | Revenue trends, market performance | High-level charts and summaries |
| Sales Team Members | Individual targets, daily activities | Simple tables with clear goals |
By following these steps, you ensure that your report resonates with its audience. A well-tailored report not only saves time but also drives better decision-making across your organization.
Note: Tools like FineReport simplify this process by offering customizable templates. You can create audience-specific reports with minimal effort, ensuring that everyone gets the insights they need.
Relevance is the cornerstone of an effective daily sales report. When you focus on the audience's needs, you transform your report into a powerful tool for driving results. Always ask yourself: "Does this report provide value to its reader?" If the answer is yes, you're on the right track.
Creating a daily sales report involves a systematic approach to ensure it delivers actionable insights. By following these steps, you can design a report that enhances decision-making and improves sales performance.
Every effective sales report begins with a clear purpose. Defining the purpose helps you focus on the specific goals you want to achieve. For example, are you tracking team performance in Malaysia, monitoring revenue trends, or identifying bottlenecks in the sales process? Knowing the purpose ensures your report aligns with organizational objectives.
| Key Point | Description |
|---|---|
| Importance of Daily Sales Reports | Essential for visualizing sales goals and tracking business performance. |
| Underperformance Due to Unstructured Processes | Nearly 50% of businesses struggle because of lack of structured sales processes. |
| Data Utilization | Effective sales data helps streamline operations and improve outcomes. |
When you define the purpose, you also identify the audience in Malaysia for your report. Sales managers may need detailed metrics, while executives might prefer high-level summaries. Tailoring the report to its audience in Malaysia ensures it provides value and drives results.
Tip: Always ask yourself, "What decisions will this report help make?" This question keeps your report focused and relevant.
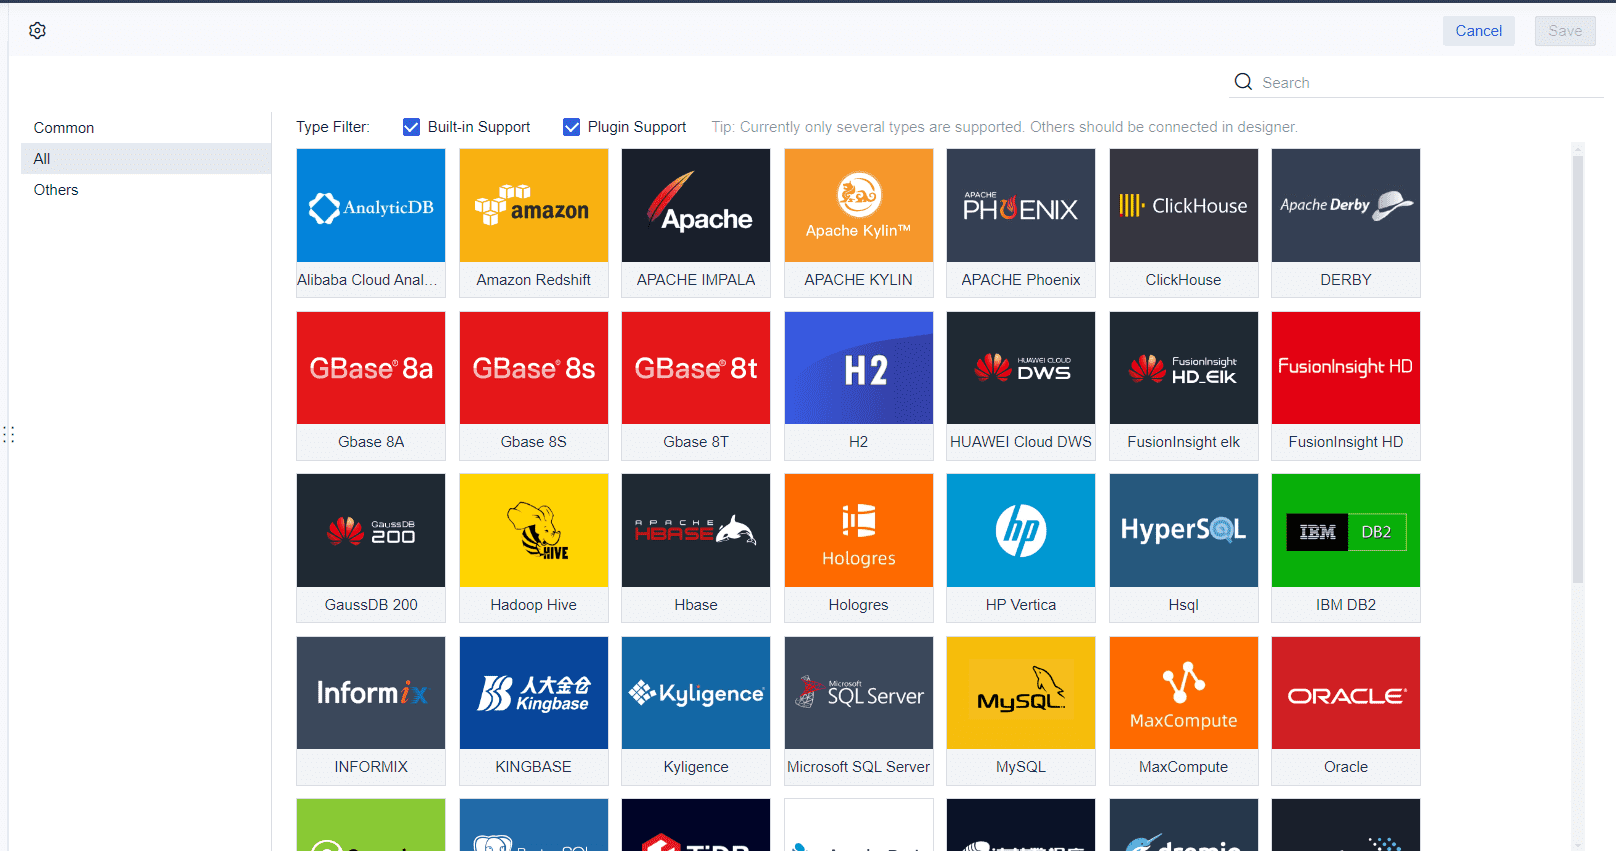
The quality of your sales report depends on the accuracy and organization of your sales data. Start by gathering data from reliable sources such as CRM systems, POS terminals, or sales tracking software. Ensure the data is up-to-date and relevant to the report's purpose.
Organized data not only simplifies analysis but also improves transparency. For instance, categorizing sales data by region or product line helps you identify trends and make informed decisions. Transparent data collection processes also build trust within your team and organization in Malaysia.
Note: Tools like FineReport can streamline data collection and integration, ensuring your sales data is accurate and well-organized.
A well-structured report enhances readability and ensures the audience in Malaysia can quickly grasp key insights. Use design principles that prioritize clarity and consistency. For example, group related metrics together and use visual aids like charts or graphs to highlight trends.
| Design Principle | Outcome |
|---|---|
| Understanding the Audience | Ensures reports are tailored to user needs, enhancing engagement and comprehension. |
| Prioritizing Performance | Key metrics are easily accessible, facilitating quick decision-making and focus on important data. |
| Maintaining Consistency | A uniform design helps users locate information quickly, reducing cognitive load. |
| Ensuring Data Accuracy | Accurate data presentation prevents misinterpretation, leading to better decision-making. |
To structure your report effectively:
For example, a report that uses a bar chart to compare monthly sales across regions is easier to interpret than one filled with raw numbers. Consistency in layout and design also helps the audience in Malaysia navigate the report effortlessly.
Tip: Keep your report concise. Focus on the most relevant sales metrics to avoid overwhelming your audience in Malaysia.
Summarizing key insights and trends in your sales report transforms raw data into actionable strategies. This step helps you identify patterns, evaluate performance, and make informed decisions that drive growth. By focusing on the most critical findings, you can ensure your team in Malaysia stays aligned with organizational goals.
When you summarize insights, you create a clear roadmap for action. For example, identifying a consistent increase in sales for a specific product line can guide your team in Malaysia to allocate more resources to that area. Similarly, spotting a decline in customer engagement might prompt you to adjust your outreach strategies. These summaries provide clarity, helping you prioritize tasks and address challenges effectively.
To summarize insights effectively, you need to rely on proven methodologies. These methods help you interpret data and uncover trends that shape your business strategies. Here’s a breakdown of some key approaches:
| Methodology | Description |
|---|---|
| Data Analysis and Interpretation | Provides crucial insights that form the foundation of evidence-based research. |
| Competitor Benchmarking | Helps understand market positioning and identify opportunities for growth. |
| Survey Insights | Captures customer sentiments and actionable feedback for strategic decisions. |
| Field Experiments | Tests hypotheses in real-world scenarios to refine and validate strategies. |
| Predictive Analytics | Forecasts future trends, enabling businesses to stay ahead of the competition. |
| Customer Segmentation | Personalizes marketing efforts for maximum impact, enhancing customer engagement and retention. |
| Forecasting Market Trends | Anticipates market shifts, allowing for proactive business planning and strategy adjustments. |
These methodologies ensure your sales report becomes a tool for strategic planning. For instance, predictive analytics can help you forecast seasonal demand, enabling you to stock inventory accordingly. Similarly, customer segmentation allows you to tailor marketing campaigns, improving engagement and retention.
Presenting trends in a clear and concise manner ensures your team in Malaysia can act on them quickly. Use visual aids like charts or graphs to highlight patterns. For example, a line graph showing monthly revenue growth can help you track progress over time. Group related trends together to provide a comprehensive view of your sales performance.
Tip: Always include a brief explanation of each trend. This context helps your team in Malaysia understand why the trend matters and how it impacts your goals.
Insights are only valuable when they lead to action. After identifying trends, outline specific steps your team in Malaysia can take. For example, if your report shows a spike in sales from a particular region, consider increasing your marketing efforts there. If you notice a drop in customer satisfaction, investigate the root cause and implement solutions to improve the experience.
By summarizing key insights and trends, you empower your team in Malaysia to make data-driven decisions. This approach not only improves efficiency but also ensures your organization stays competitive in a dynamic market.
Automation is a game-changer in sales reporting. FineReport simplifies this process by enabling you to schedule and generate daily reports automatically. This ensures timely access to critical sales data without manual intervention. For example, you can configure FineReport to generate daily summaries in formats like PDF or Excel, saving time and reducing errors.
Automation also improves efficiency. Companies like Habitium and Vaultra have seen remarkable results by automating their reporting processes. Habitium reduced manual workloads by 80% and increased sales by 11%. Vaultra improved email engagement rates by 84% and closed deals faster.
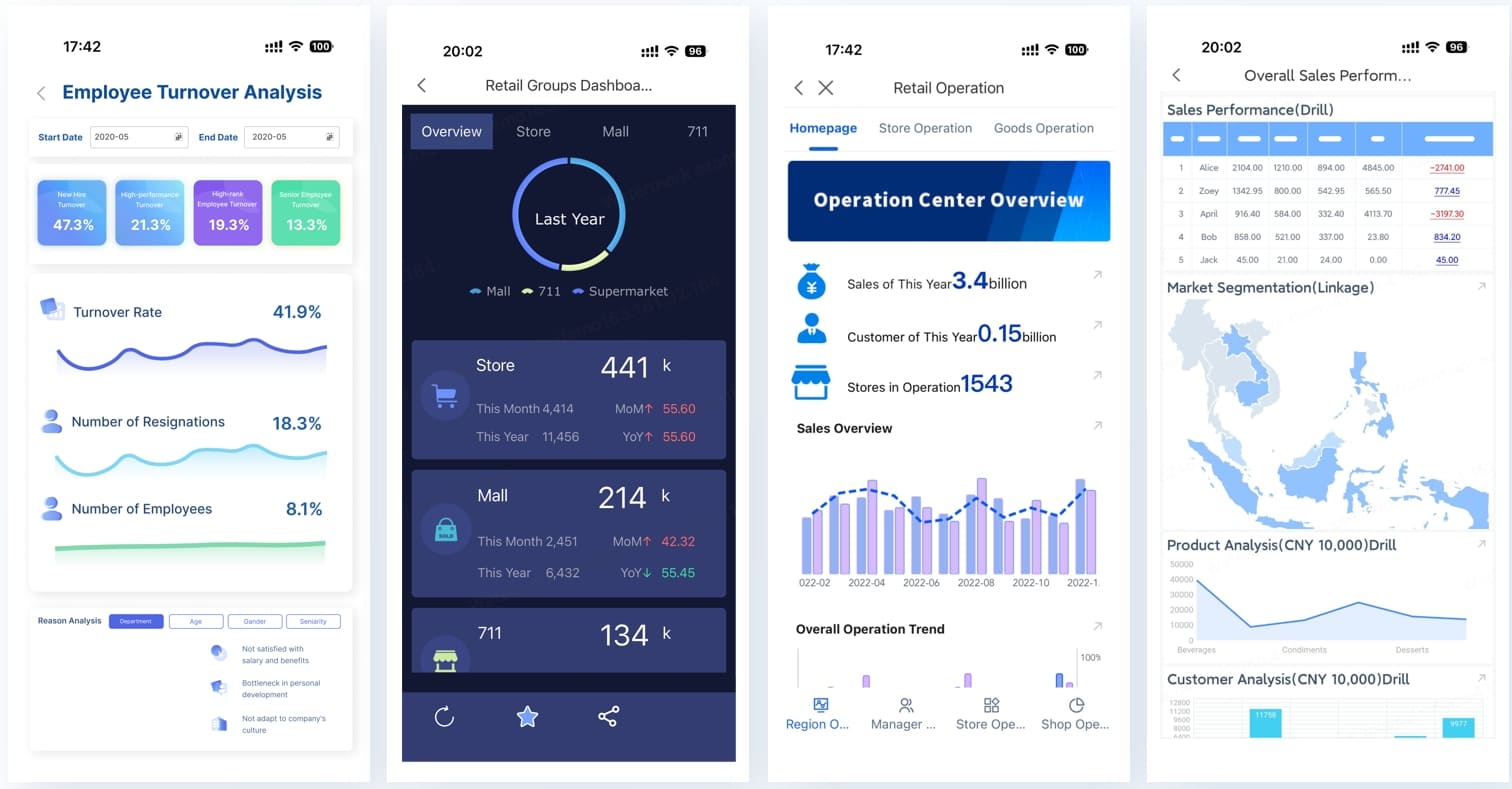
FineReport’s advanced features, such as real-time data integration and mobile compatibility, further enhance automation. These capabilities ensure your reports remain accurate, relevant, and accessible anytime, anywhere.
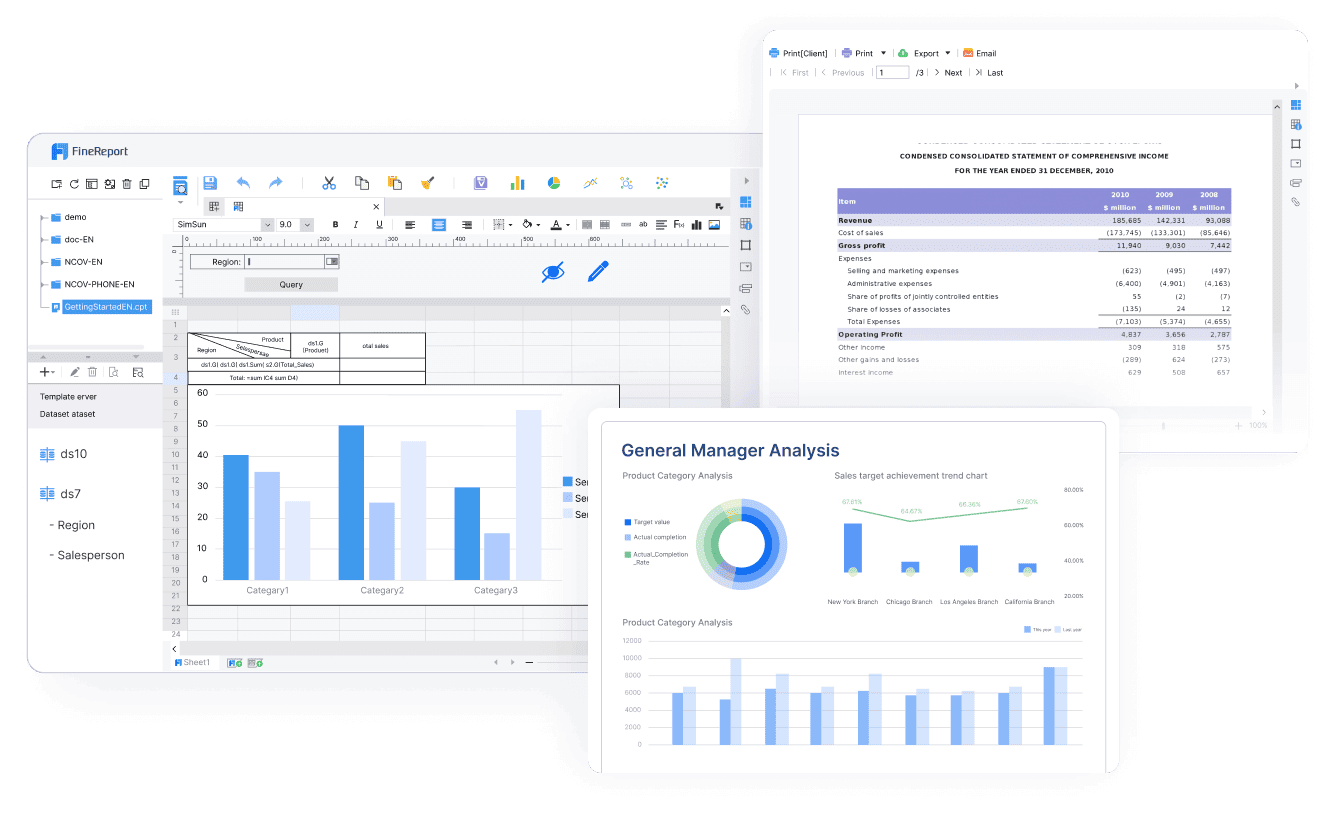
Customizable templates in FineReport allow you to create reports tailored to your business needs. The drag-and-drop interface makes it easy to design templates, even for users with limited technical expertise. You can include key metrics, charts, and tables to present sales data effectively.
| Feature | Description |
|---|---|
| Advanced Reporting | FineReport offers advanced reporting capabilities that streamline the report generation process. |
| Drag-and-Drop Interface | Simplifies the creation of reports, making it user-friendly and efficient. |
| Data Validation Features | Ensures accuracy in reports by validating data inputs. |
| Real-Time Data Integration | Allows for immediate updates and integration of data, enhancing the relevance of reports. |
| Mobile Compatibility | Enables access to reports on mobile devices, increasing flexibility and accessibility. |
Customizable templates save time and ensure consistency across all your reports. They also help you maintain a professional appearance, which is crucial for presenting data to stakeholders.
Different stakeholders require different insights. FineReport makes it easy to tailor reports to meet the needs of various audiences in Malaysia. For instance, sales managers may need detailed metrics like team performance, while executives prefer high-level summaries.
To tailor your reports effectively:
FineReport’s customizable templates and data visualization tools simplify this process. By tailoring your reports, you ensure that every stakeholder receives actionable insights, improving decision-making across your organization.
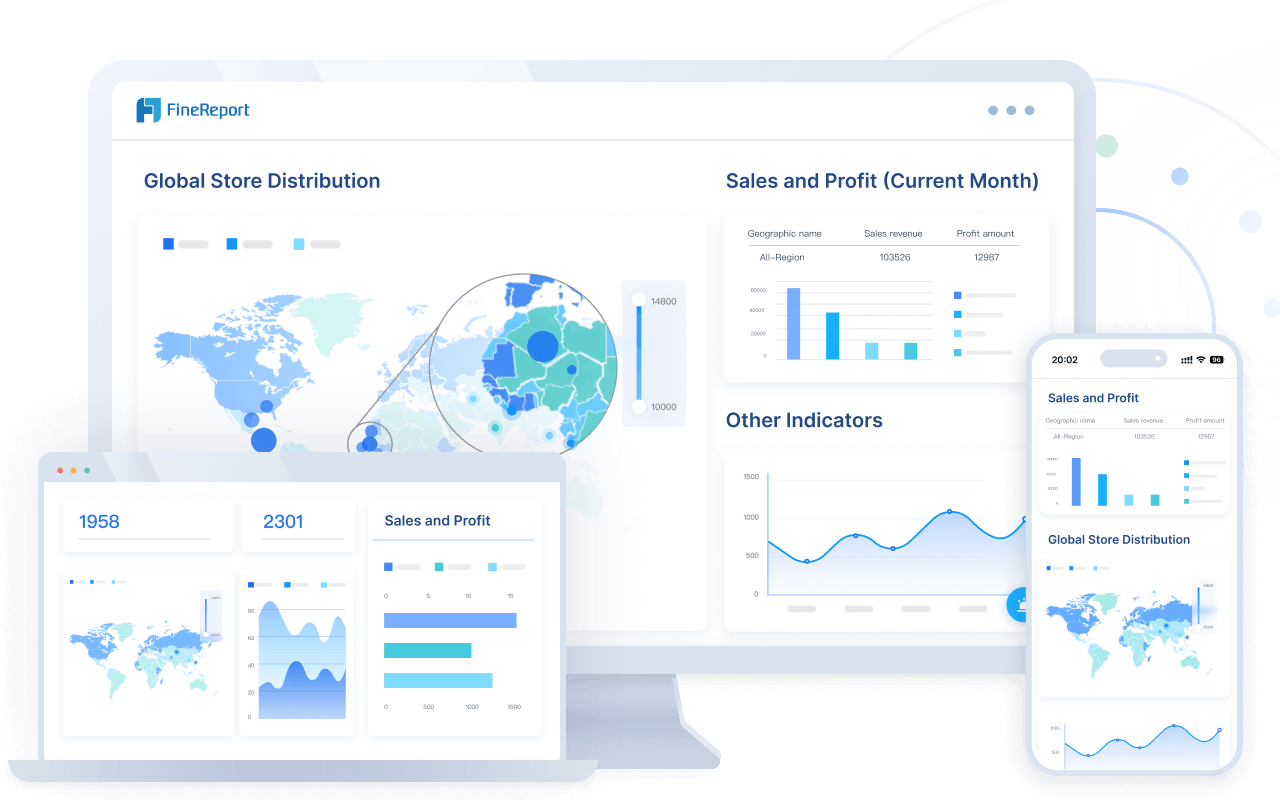
Data visualization transforms raw numbers into meaningful insights. It helps you identify patterns, trends, and opportunities in your sales data. By presenting information visually, you make it easier for your team to understand and act on the findings.
Visualizing sales data improves clarity and speeds up decision-making. Charts, graphs, and maps highlight trends that might be missed in spreadsheets. For example, a heatmap can show which regions generate the most revenue, helping you focus your efforts on high-performing areas.
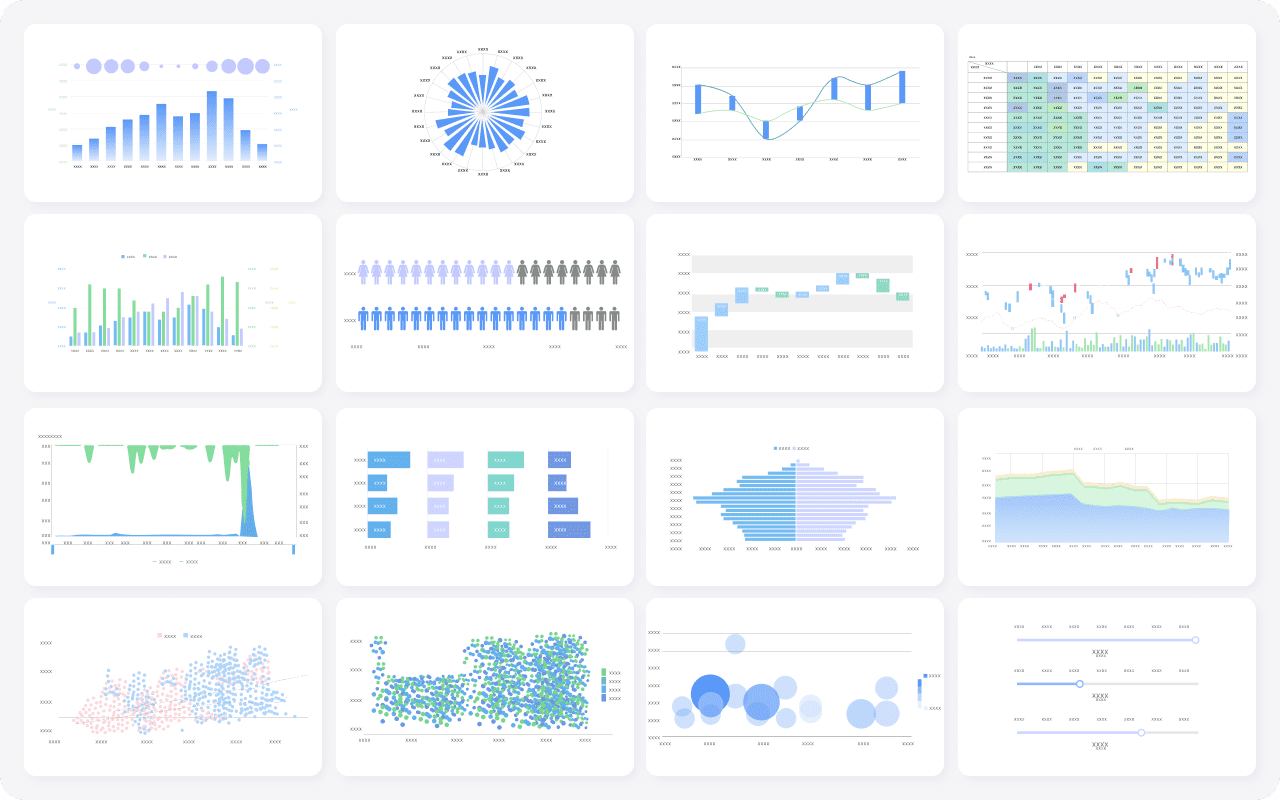
Tip: Use visuals to simplify complex data. A well-designed chart can communicate insights faster than a page of text.
Choosing the right visualization technique depends on the type of data you want to analyze. Here are some methods that enhance sales reporting:
To maximize the impact of your visuals, follow these steps:
| Visualization Technique | Description | Benefits for Sales Data Interpretation |
|---|---|---|
| Interactive Dashboards | Enable direct engagement with data through filtering and zooming. | Simplifies complex data, allowing stakeholders to explore relevant segments. |
| Storytelling with Data | Combines visuals with narrative to present data in a relatable way. | Breaks down complex findings into actionable insights. |
| Sankey Diagrams | Visualizes flows between categories using arrows of varying width. | Simplifies understanding of processes like customer journeys. |
| Small Multiples | Arranges similar charts for easy comparison. | Facilitates quick visual comparisons across categories or time periods. |
| Heatmaps with Hierarchical Clustering | Depicts intensities using color gradients and groups similar items. | Highlights patterns and structures in sales data intuitively. |
| Choropleth Maps | Shades regions based on variable values to show geographic patterns. | Helps identify disparities and hotspots in sales data across locations. |
Note: FineReport offers advanced visualization tools that make it easy to implement these techniques. You can create interactive dashboards, heatmaps, and more to uncover deeper insights.
By leveraging data visualization, you turn your sales report into a powerful decision-making tool. Visuals not only enhance understanding but also inspire action, helping your team achieve better results.
Including too much data in your sales report can overwhelm your audience in Malaysia and obscure critical insights. When you focus on too many metrics, the report loses its clarity and purpose. For example, tracking every minor detail, such as the number of emails sent or calls made, may distract from more meaningful metrics like conversion rates or revenue trends.
To avoid this mistake, prioritize the most relevant data. Highlight metrics that align with your business goals and provide actionable insights. For instance, instead of listing every sales activity, focus on key performance indicators (KPIs) like sales cycle length or daily revenue. This approach ensures your report remains concise and impactful.
Tip: Use visual aids like charts or graphs to summarize data. This makes it easier for your audience in Malaysia to identify trends and take action.
A sales report that fails to address its audience's needs often becomes ineffective. Different stakeholders require different types of information. For example, sales managers may need detailed metrics to monitor team performance in Malaysia, while executives prefer high-level summaries to assess overall progress.
Tailoring your report to its audience ensures it delivers value. Start by identifying who will read the report and what decisions they need to make. Then, select metrics that align with their priorities. For instance, include pipeline status for managers and revenue trends for executives. Adjust the format to suit their preferences, using tables for detailed data and charts for summaries.
Note: A one-size-fits-all approach rarely works. Customizing your report improves its relevance and effectiveness.
Inconsistent sales reporting can lead to confusion and mistrust. Variability in data sources, naming conventions, or calculations makes it difficult to compare reports over time. For example, if one report uses "region" while another uses "territory," your team in Malaysia may struggle to interpret the data accurately.
To maintain consistency, use a single source of truth for your data. Store and manage all information in a central database. Cross-check datasets to ensure alignment and regularly update your data to avoid outdated or conflicting information. Studies show that rigorous validation processes can reduce data errors by over 60%, improving the reliability of your reports.
Tip: Establish clear naming conventions and ensure relationships between datasets remain valid. This helps maintain data integrity and enhances trust in your reports.
Failing to highlight key takeaways in your daily sales report can reduce its effectiveness. Without clear insights, your team may struggle to understand the data or take meaningful action. A report filled with raw numbers and dense information often overwhelms readers, making it harder to identify what truly matters.
Key takeaways act as a bridge between data and action. They summarize the most critical insights, helping your team focus on areas that need attention. For example, if your report shows a 15% drop in sales for a specific product, the takeaway could suggest investigating the cause or adjusting your marketing strategy. By emphasizing these points, you transform your report from a static document into a dynamic tool for decision-making.
Tip: Always ask yourself, "What do I want my audience to do after reading this report?" Use this question to guide your takeaways.
To ensure your takeaways stand out, consider these strategies:
By emphasizing key takeaways, you convert complex data into straightforward insights. This approach makes it easier for your team to make informed decisions and take immediate action. A well-crafted takeaway not only saves time but also ensures your report drives results.
Note: Tools like FineReport simplify this process by allowing you to highlight trends and insights visually, ensuring your audience in Malaysia grasps the most important information quickly.
Ignoring key takeaways risks leaving your team directionless. Always prioritize clarity and relevance to maximize the actionable value of your sales reports.
Organizing your sales data into relevant categories simplifies analysis and improves decision-making. Categories help you group data logically, making it easier to identify patterns and trends. For example, you can classify data by product type, region, or customer demographics. This approach enhances inventory management and provides insights into customer behavior.
To categorize your data effectively, consider the following methods:
| Category | Description |
|---|---|
| Public Data | Accessible to the public; lowest level of classification. |
| Private Data | Requires greater security; not available for public access. |
| Internal Data | Limited to employees; has specific security requirements. |
| Confidential Data | Access restricted to authorized individuals; sensitive information. |
| Restricted Data | Most sensitive information; strictly controlled access and requires encryption. |
Organized categories also improve search functionality on e-commerce platforms. They reduce search time for customers and create a seamless shopping experience. Monitoring these categories helps you understand customer preferences and refine your strategies.
FineReport simplifies category-based analysis by offering advanced tools for data visualization and integration. Its drag-and-drop interface allows you to create customized reports that focus on specific categories. For instance, you can analyze sales performance by region or product line with just a few clicks.
FineReport’s features make it ideal for category-based analysis:
| Key Feature | Description |
|---|---|
| Real-Time Data Visualization | Enables monitoring of sales metrics and performance indicators dynamically. |
| Comprehensive Analysis | Allows in-depth exploration of sales data to identify trends and opportunities. |
| Seamless Integration | Facilitates easy integration with existing systems for improved workflow. |
| Predictive Insights | Utilizes advanced analytics to forecast sales and pinpoint growth areas. |
These capabilities help you uncover actionable insights. For example, real-time visualization highlights underperforming categories, enabling you to take corrective action immediately. Predictive insights guide resource allocation, ensuring you focus on high-growth areas.
Identifying trends across categories transforms your sales report into a strategic tool. Techniques like cluster analysis and time series analysis reveal hidden patterns in your sales data. These methods help you understand customer behavior, forecast demand, and optimize marketing efforts.
| Technique | Description |
|---|---|
| Cluster Analysis | Groups customers with similar behaviors and preferences, aiding in targeted marketing strategies. |
| Regression Analysis | Helps understand the influence of various factors on sales, useful for predicting future sales. |
| Time Series Analysis | Analyzes data over time to identify trends and improve forecasting accuracy. |
| Cohort Analysis | Studies specific groups' behaviors over time to evaluate performance within a larger population. |
For example, time series analysis can identify seasonal trends, helping you prepare for peak sales periods. Cluster analysis segments customers, allowing you to tailor promotions to specific groups. These techniques ensure your sales report by categories and variants delivers actionable insights.
Tip: Use FineReport’s advanced analytics to implement these techniques seamlessly. Its intuitive design makes it easy to explore trends and drive better decisions.
Category-specific data holds immense potential for driving smarter decisions. By analyzing this data, you can uncover trends, identify opportunities, and address challenges within specific segments of your business. Here’s how you can turn category-specific data into actionable insights:
Start by identifying which categories contribute the most to your sales. Use metrics like revenue, profit margins, or customer engagement to pinpoint these areas. For example, if a particular product line consistently generates higher sales, consider allocating more resources to promote it further.
Tip: Use tools like FineReport to create visual dashboards that highlight top-performing categories. This makes it easier to spot trends at a glance.
Low-performing categories often signal opportunities for improvement. Analyze the data to understand why these areas lag behind. Is it due to low demand, poor marketing, or pricing issues? Once you identify the root cause, take corrective actions such as revising your pricing strategy or launching targeted promotions.
Category-specific data helps you understand customer preferences. For instance, you might notice that younger customers prefer certain products, while older customers gravitate toward others. Use this insight to tailor your marketing campaigns and product offerings to meet the needs of each segment.
| Category | Key Insight Example | Actionable Step |
|---|---|---|
| Product Type | High sales in eco-friendly products | Expand eco-friendly product range |
| Region | Low sales in rural areas | Increase marketing efforts in rural areas |
| Customer Demographics | Younger audience prefers digital tools | Focus digital ads on younger customers |
Historical data within categories can reveal patterns that help you forecast future trends. For example, if sales of a seasonal product spike every winter, you can prepare by stocking up in advance. Predictive insights ensure you stay ahead of market demands.
Note: FineReport’s predictive analytics features simplify trend forecasting, helping you make proactive decisions.
By leveraging category-specific data, you can refine your strategies and achieve better results. Always ask yourself, “What does this data tell me, and how can I act on it?” This mindset ensures your decisions are data-driven and impactful.
Creating an effective daily sales report is essential for improving sales performance. It allows you to track progress consistently, identify trends, and make strategic adjustments. Insights from the report enable targeted coaching and help your team adapt their strategies. Tools like FineReport simplify this process with automation and customization, saving time and ensuring accuracy. By implementing these tips and avoiding common mistakes, you can transform your sales report into a powerful tool for better forecasting, planning, and decision-making.
Click the banner below to try FineReport for free and empower your enterprise to transform data into productivity!
Sales Report Sample: Templates and Guidelines
Daily Sales Report: Key Elements, Samples & How to Create
The Ultimate Guide to Creating a Sales Dashboard: Tips and Tricks

The Author
Lewis
Senior Data Analyst at FanRuan
Related Articles

Top 10 Best Automation Reporting Tool Picks for Businesses
Compare the top 10 best automation reporting tool options to streamline business data, automate reports, and boost decision-making efficiency.
Lewis
Jan 03, 2026
Top 10 Reporting Systems and Tools for Businesses
See the top 10 reporting systems that help businesses automate data, build dashboards, and improve decision-making with real-time analytics.
Lewis
Jan 03, 2026

What is integrated reporting and why is it important
Integrated reporting combines financial and non-financial data, offering a full view of value creation, transparency, and stakeholder trust.
Lewis
Dec 12, 2025