A retail dashboard white labeling solution is used to display retail data featuring your company’s logo. This dashboard allows you to modify reports, establish automatic updates, and connect various data sources. White labeling a retail dashboard enhances your business operations and increases client satisfaction. Agency leaders report that branded reports assist them in retaining clients and expanding their business. Clients frequently engage with their dashboards, indicating their interest. Automated reports save agencies countless hours each year. FineBI give you strong choices to make dashboards that fit what you want. Think about how these tools can help your retail work be faster and better.
What Is Retail Dashboard White Labeling?
White Label Dashboard Definition
White label analytics means adding custom reports and analytics to products. These features often have interactive charts and live dashboards. When you use a white label retail dashboard, you see real-time insights that match your brand. You can put your logo, colors, and even your own domain name on it. This lets you show data in a way that looks like it is from your company, not someone else.
Why It Matters for Retailers
Retail dashboard white labeling helps you fix many business problems. You can launch new dashboards fast without building them yourself. You save money because you do not need to hire engineers or worry about rules. You get solutions that work right away.
| Reason for Choosing White Label Dashboards | Explanation |
|---|---|
| Cost Efficiency | You spend less because the provider handles updates and rules. |
| Faster Time to Market | You launch dashboards fast with ready-made choices. |
| Access to Proven Solutions | You use products that are tested and reliable from the start. |
| Scalability Without Growing Pains | You grow easily as your customer base gets bigger. |
White label analytics also helps you follow rules like GDPR and CCPA. You can offer special features without needing lots of vendors. Investors like when you move fast and use white label dashboard solutions to enter the market quickly.
Key Benefits of Retail Dashboard White Labeling
Operational Efficiency
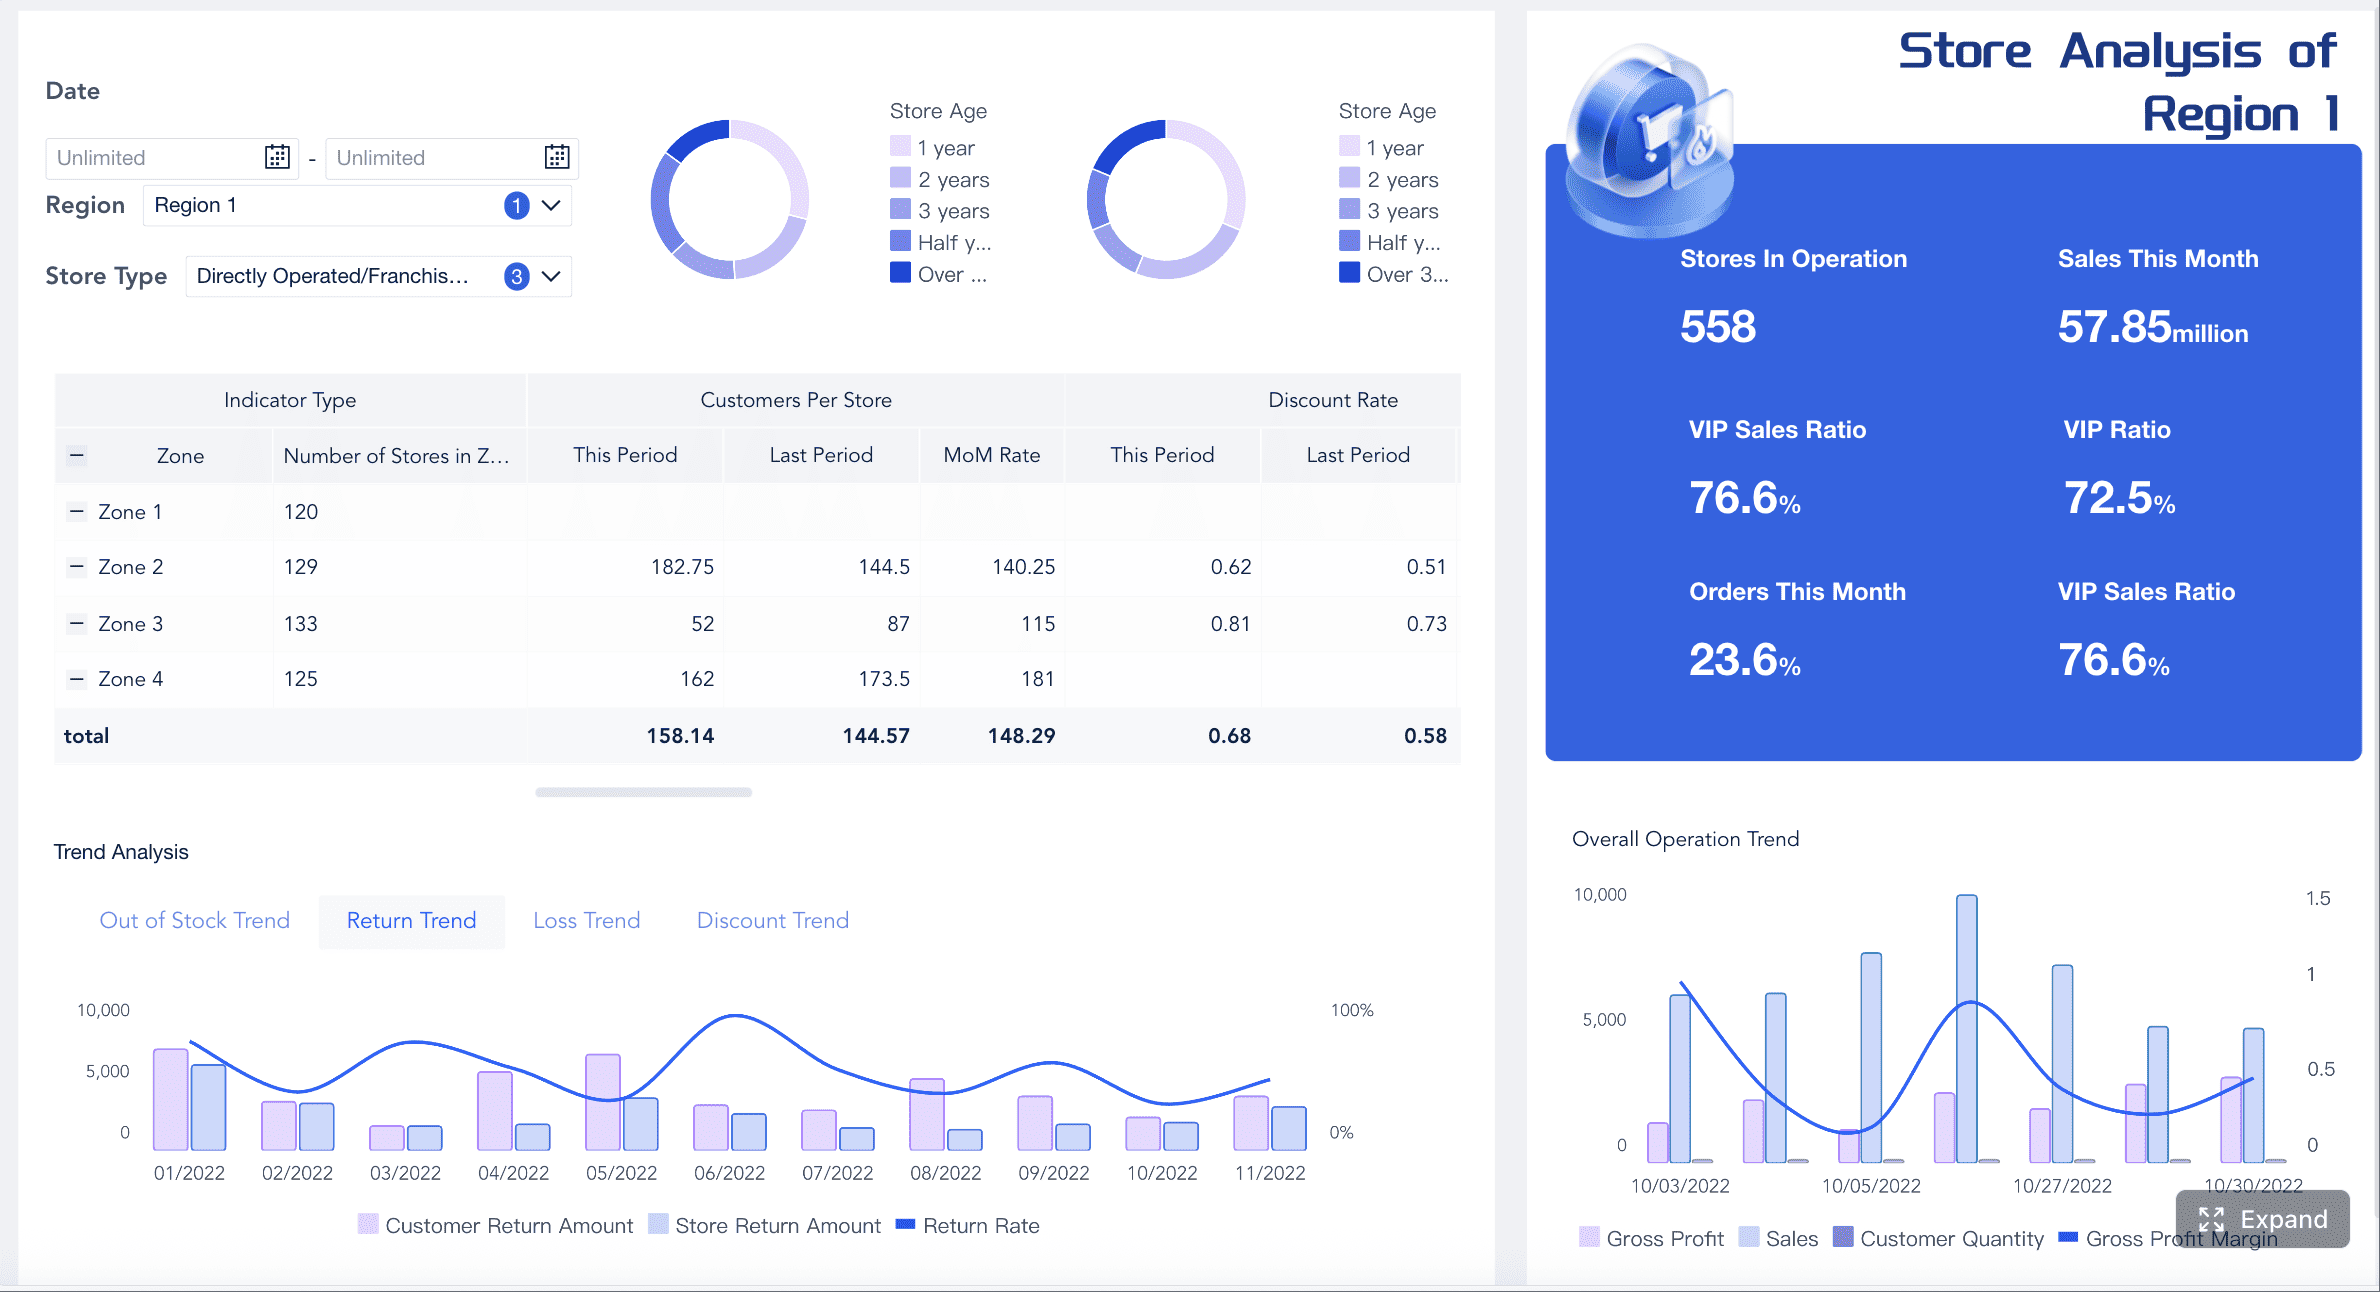
Retail dashboard white labeling helps make your work easier each day. With white label analytics, you get dashboards that show sales, inventory, and what customers do right now. You do not have to build these dashboards yourself. FineBI helps you connect all your data and see what is happening in your stores. You can find problems and fix them fast. You can also check how well workers do and compare stores. The table below shows how white label analytics helps you work better:
| Benefit | How It Helps Retailers |
|---|---|
| Comprehensive reporting | Shows sales trends and inventory performance |
| Timely and accurate data | Helps you plan and find bottlenecks |
| Shared performance dashboards | Tracks labor efficiency across different locations |
Enhanced Customer Experience
Retail dashboard white labeling lets you make dashboards that match your brand and help customers feel special. You can use white label analytics to build a personalisation hub. This hub makes every campaign fit the customer and focus on their experience. Customers find products they like, and you make more money. The table below shows how white label analytics makes customers happier:
| Description | Impact on Customer Experience |
|---|---|
| Personalisation hub for retail media | Makes experiences better and brings in money |
| Context-aware, experience-led campaigns | Helps customers find things they want |
Competitive Advantage with FanRuan
You get a big advantage when you use retail dashboard white labeling with FineBI. You can make dashboards look and feel like your brand. You can use white label analytics to stand out from other stores. FanRuan gives you tools to connect data from many places and build dashboards that fit your needs. FineBI lets you make dashboards with drag-and-drop tools and real-time updates. You can give your team analytics tools to help them make smart choices. You can grow your business and keep your brand strong.
How Retail Dashboard White Labeling Works
Integration and Customization with FineBI
You can use white label analytics by linking your data to FineBI. FineBI helps you connect sales, inventory, and customer data. You use built-in tools to bring all your information together. You do not need to write any code. You can drag and drop charts, tables, and filters on your dashboard. You pick the numbers that matter most for your business.
FineBI gives you ways to change how your dashboards look. You can add your logo and pick your brand colors. You can set up your own domain name. You make dashboards that match your company style. You choose how people see and use the data. You can make dashboards for store managers or marketing teams. You control who can see each dashboard.
Technical Requirements
You need a few things to use white label analytics with FineBI. You must have access to your data sources. These can be databases, files, or APIs. FineBI supports more than sixty connectors, so you can link almost any system. You need a computer or server to run FineBI. You can use cloud or on-premises setups.
You need a good internet connection for real-time updates. You set up user accounts and permissions to keep your data safe. You can use role-based access to control who can see or change dashboards. You do not need to know how to code. FineBI uses a visual interface, so you can build and change dashboards with easy steps.
Typical Features
White label analytics gives you many features to help your retail business. You can focus on the numbers that matter most. You get real-time data, so you always see the latest numbers. You use interactive charts and graphs to understand your data. You can combine data from different places for one clear view.
| Feature | Description |
|---|---|
| Customizable Metrics | You can focus on specific KPIs that matter to you. |
| Real-Time Data Access | You see current market conditions and make quick decisions. |
| Interactive Visualizations | You use charts and graphs to understand your data easily. |
| Cross-Platform Integration | You combine data from sales, inventory, and other systems in one dashboard. |
FineBI lets you set up alerts for important changes. You can share dashboards with your team and check how stores are doing. You can make dashboards special for each user or department. You can use advanced analytics to find trends and guess what will happen next. You keep your brand strong by making every dashboard look like your own product.
Retail Dashboard White Labeling: Customization Options in FineBI
Branding and Visual Design
You can make dashboards look like your brand. FineBI lets you change how dashboards appear. You can add your logo and pick colors that match your style. You can choose fonts that fit your brand. Dashboards work on phones, tablets, and computers. You can change the theme to match your company. You can also change how charts look to make data easier to read. The table below shows ways to change dashboards:
| Customization Option | Description |
|---|---|
| Adaptive Layouts | Dashboards fit different screens and directions. |
| Theme Style Customization | Users can change the theme to match their brand. |
| Merging Analytic Data | Combine data from many places into one report. |
| Chart Appearance Customization | Change how charts look to show data better. |
Functional Customization
You can build dashboards that fit your business needs. FineBI lets you add charts, tables, and filters. You can arrange these parts to make dashboards simple to use. You can share dashboards with your team. You can let others edit dashboards too. This helps everyone work together without changing the main dashboard. You can make dashboards look nice by arranging parts. Follow these steps to start:
- Log in to FineBI with your BI design account.
- Go to 'Dashboard > New Dashboard' to make a new dashboard.
- Enter the editing page and add parts using the tools.
User Access and Permissions
You control who can see and use dashboards. FineBI gives you strong options for user access and permissions. You can set rules by department, position, role, or user. User permissions are more important than other settings. The final permission combines all rules from department, position, and role. You can set domain rules to keep dashboards safe.
Retail Dashboard White Labeling: Steps, Challenges, and Best Practices
Step-by-Step Guide
You can set up a white label analytics dashboard by following these steps:
- Log in to your analytics platform. Open the dashboard settings.
- Upload your company logo. Pick colors that match your brand.
- Connect your data sources like sales, inventory, and customer systems.
- Change dashboard templates to fit your business and audience.
- Set up user roles and permissions to keep your data safe.
- Check all branding parts to make sure they look the same.
- Launch your dashboard. Share it with your team or clients.
Common Challenges and Solutions
You might have some problems when you use white label analytics. The table below shows common issues and how FineBI help fix them:
| Challenge | Explanation |
|---|---|
| Tools Not Designed for Embedding | Some tools do not work well inside other apps. FineBI makes embedding easy for smooth use. |
| iFrames | Old tools use iFrames, which limit changes. FineBI gives more flexible ways to customize. |
| Lack of Customization Options | Some platforms do not let you change enough. FineBI lets you control how dashboards look. |
| Security Challenges | Keeping data safe is hard without good controls. FineBI uses strong security for each user. |
Best Practices for Success
You can follow these best practices to get the most from white label analytics:
| Best Practice | Description |
|---|---|
| Full Branding Control | Make dashboards show your logo, colors, and layouts for a strong brand look. |
| Multi-Tenancy for Client Delivery | Serve many clients and keep their data separate and safe. |
| Real-Time Performance | Use dashboards that update quickly to keep users interested. |
| Self-Service Dashboards | Let users create and manage their own dashboards for better results. |
| Advanced Features | Add AI insights and predictive tools to improve your analytics. |
- Put important information at the top so people find it fast.
- Start with a summary and let users click for more details.
- Set up alerts to watch key numbers and act quickly.
- Choose a platform that saves money and grows with your business.
You get lots of good things when you use white label dashboards in retail. More people use your dashboards. Your brand looks the same everywhere. Customers feel happier with your business. Multi-channel retailers see 50% more people using data after switching to embedded analytics. You can change reports to fit your needs. You can connect to many platforms. You can check analytics on your phone.
Here are your next steps for using analytics:
- Check if your model gives correct predictions.
- Gather data that fits your business.
- Find useful ideas to help your plans.
- Teach models to guess what will happen next.
- Use these ideas in your daily work.
Look at FineBI to get these benefits. You can ask for a demo or talk to experts to find the best choice for your retail business.


FAQ

The Author
Lewis
Senior Data Analyst at FanRuan
Related Articles

How to Build an Investment Portfolio Reporting Dashboard for Executives: KPIs, Benchmarks, and Drill-Down Views
Investment portfolio reporting for executives is not about showing every holding, transaction, and chart your investment team can produce. It is about giving CEOs, CFOs, CIOs, boards, and investment committees a fast, re
Yida YIn
Jun 25, 2026

12 KPI Reporting Examples for Executive Dashboards: What to Show in Weekly, Monthly, and Quarterly Reviews
Executive leaders do not need more data. They need decision ready $1 examples that match how often they review the business and what actions they are expected to take. A weekly $1 should surface fast moving risks and per
Yida YIn
Jun 25, 2026

How to Build a Digital Marketing Reports Dashboard: Executive Examples, KPIs, and Templates
A $1 is the control layer that helps executives and marketing leaders turn scattered channel data into fast, confident decisions. If you are a CEO, CMO, operations director, or marketing analytics lead, the real problem
Yida Yin
May 07, 2026