In 2026, businesses increasingly rely on open-source BI tools to make smarter decisions. These tools offer cost-effective alternatives to traditional systems by eliminating the need for expensive hardware and licensing fees. They also provide advanced features found in premium software, making them accessible to businesses of all sizes. You can customize dashboards and reports to suit your unique needs, ensuring flexibility in data analysis. The growing demand for scalable and affordable solutions has made open source BI tools a vital part of modern business intelligence strategies. The following is the list of Top Open Source BI Tools in 2026:
FineBI
Apache Superset
Metabase
BIRT
Redash
KNIME
Pentaho
Jaspersoft Community Edition
Benefits of Open Source BI Tools
Cost-Effectiveness
Open source BI tools provide a cost-effective way to harness the power of data. Many of these tools eliminate licensing costs, allowing you to access powerful analytics without breaking the bank. Some offer free versions, while others have affordable paid plans that scale with your needs. You can also avoid vendor lock-in by deploying these tools on your own servers or in the cloud. This flexibility ensures you only pay for what you use.
Additionally, open source BI tools help you scale efficiently. Start small and expand as your business grows, without worrying about pricing roadblocks. By reducing upfront costs and offering scalable solutions, these tools make advanced business intelligence accessible to organizations of all sizes.
Customizability and Flexibility
One of the standout features of open source BI tools is their ability to adapt to your unique business needs. These tools allow you to create tailor-made solutions, ensuring that your business intelligence platform aligns perfectly with your goals. For example, Apache Superset supports customization through a plug-in architecture, enabling you to integrate it seamlessly with various SQL-based databases.
Feature
Description
Tailor-Made Solutions
Organizations can customize solutions to meet unique business requirements.
Adaptability
BI tools can adjust to changes in business processes, data sources, and analytical needs over time.
This adaptability ensures that your tools evolve alongside your business, providing powerful analytics that remain relevant as your data and processes change.
Community Support and Innovation
Open-source BI tools thrive on community-driven innovation. A global network of developers and users contributes to ongoing improvements, ensuring these tools stay at the cutting edge of technology. You benefit from regular updates, new plugins, and features designed to enhance functionality.
Strong community support also means you have access to extensive documentation, forums, and tutorials. If you encounter challenges, you can rely on the collective expertise of the community to find solutions. This collaborative environment fosters rapid innovation, making open-source BI tools a reliable choice for businesses seeking powerful analytics and robust support.
Top Open Source BI Tools for 2026
1.FineBI
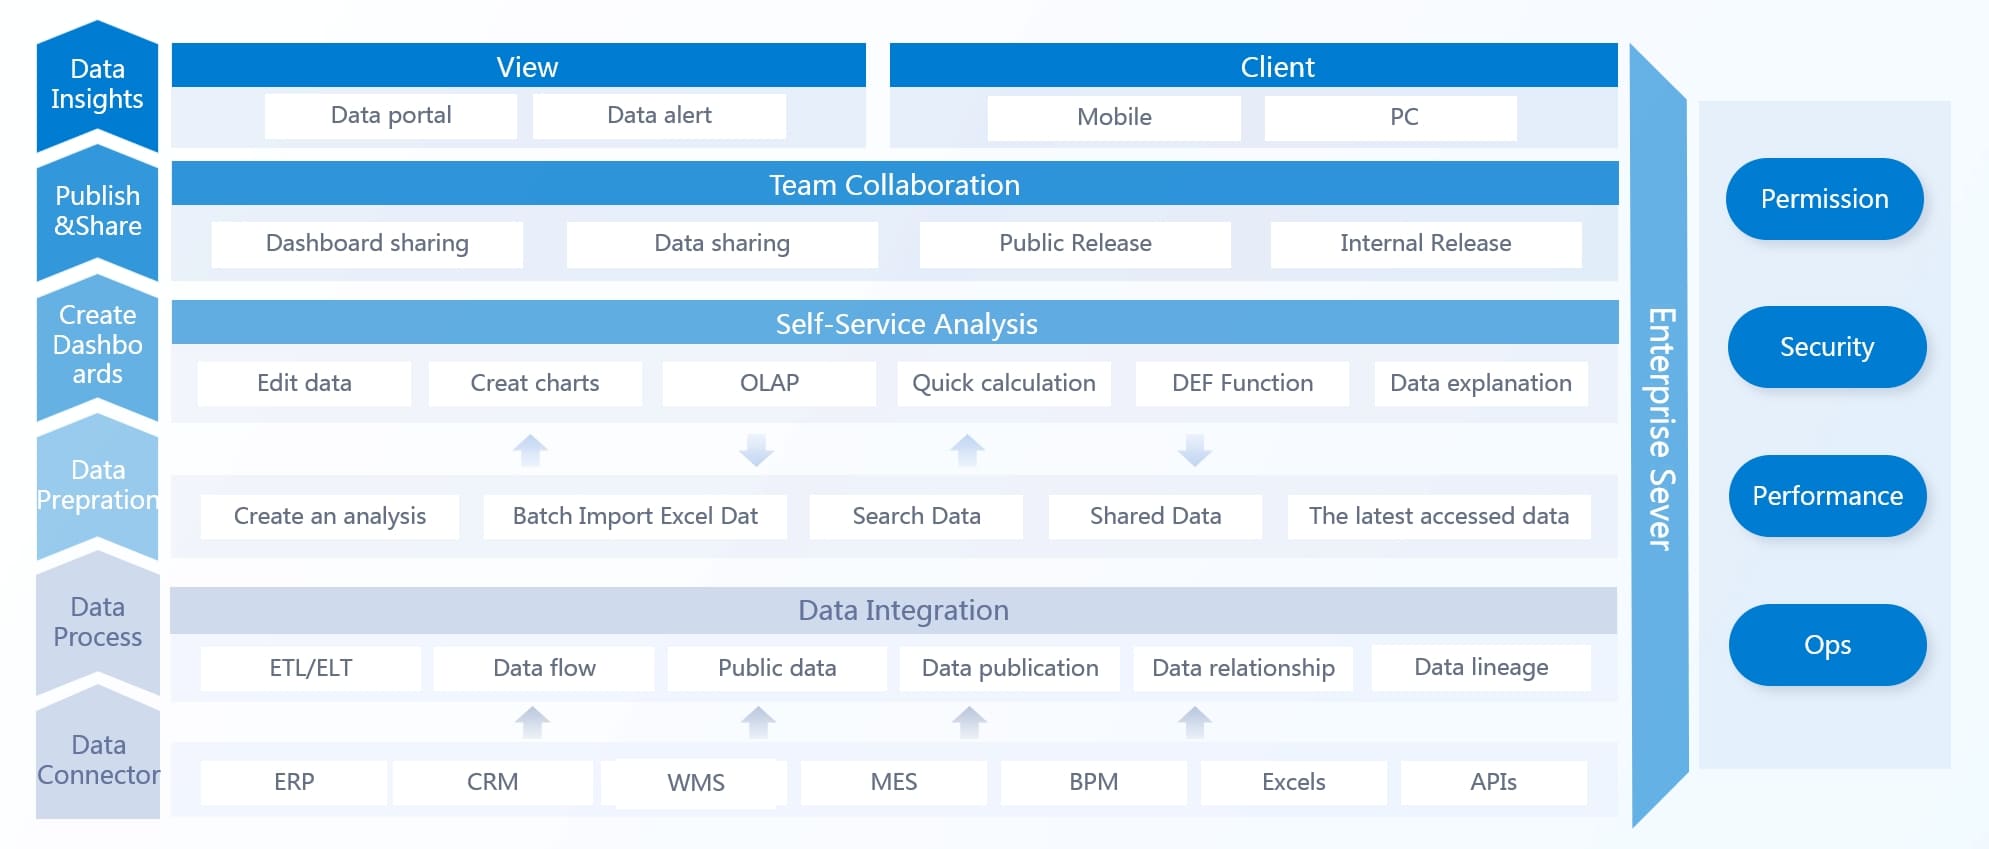
FineBI, developed by FanRuan, stands out in the crowded field of open-source BI tools by combining true self-service analytics with enterprise-grade robustness. Unlike lightweight platforms such as Apache Superset or Metabase, FineBI’s intuitive drag-and-drop interface sits atop a high-performance Java-based engine—enabling you to handle millions of records in real time, perform complex ELT/ETL data cleansing, and model multi-dimensional datasets without writing a single line of code. Its built-in data catalog and folder-based classification ensure governance and reuse, while role-based permissions and cluster-based high-availability deliver the security and uptime that mission-critical deployments demand. Beyond the desktop, FineBI’s mobile app brings interactive dashboards, drill-downs, and secure SSO to iOS and Android, so your team stays empowered on the go. If you’re evaluating open-source BI for 2025, FineBI offers the completeness, scalability, and support to transform raw data into actionable insights—and accelerate ROI faster than any other solution.
Blazing-Fast Performance at Scale FineBI’s proprietary Spider engine, built on a pure-Java B/S architecture, delivers sub-second query responses even on tens of millions of rows. Whether running in live-query mode against your data warehouse or in extracted-data mode for ultra-fast OLAP analysis, FineBI ensures your dashboards and ad-hoc reports never lag—keeping decision-makers focused on insights, not waiting on queries.
Seamless Connectivity and Unified Data View With out-of-the-box connectors for 30+ SQL and big-data platforms—as well as Excel, CSV, and multi-dimensional databases—FineBI lets you stitch together disparate data sources without costly ETL middleware. Its intelligent data catalog automatically indexes and profiles incoming datasets, giving your team a single pane of glass for all analytics needs.
True Self-Service with Enterprise Governance Business users can design complex multi-dimensional models via an intuitive drag-and-drop canvas—no SQL or scripting required—while IT retains full oversight through folder-based permissions, role-based security, and audit trails. FineBI’s built-in ELT/ETL and data-cleansing modules put data quality and lineage front and center, ensuring every insight you surface is both accurate and compliant.
Elastic Scalability and High Availability FineBI’s extract-cluster architecture supports horizontal scaling: simply add additional nodes to increase concurrency, memory, and throughput as your user base grows. Auto-healing features and active-passive failover guarantee uninterrupted service during maintenance or unexpected hardware issues—critical for mission-critical dashboards and real-time monitoring.
Mobility and Collaboration Extend your analytics anywhere with FineBI’s native mobile apps for iOS and Android, offering interactive dashboards, drill-downs, and push notifications. Combined with built-in collaboration features—such as shared annotations, scheduled report delivery, and integrated discussion threads—FineBI turns static reports into dynamic, team-driven conversations.
By delivering enterprise-grade performance, seamless data integration, robust governance, and an empowering self-service experience, FineBI stands out as the open-source BI platform of choice for organizations aiming to drive faster, smarter decisions in 2026.
2.Apache Superset
Apache Superset stands out as one of the most versatile open-source BI tools available today. It offers rich visualizations, an intuitive SQL Lab for querying, and high customizability, making it ideal for businesses with technical expertise. You can create interactive dashboards that provide actionable insights, helping your team make data-driven decisions.
However, setting up and maintaining Apache Superset can be challenging. It requires technical knowledge to deploy and manage effectively. Stability issues may arise during complex operations, but its open-source nature ensures you can adapt it to your needs without incurring additional costs.
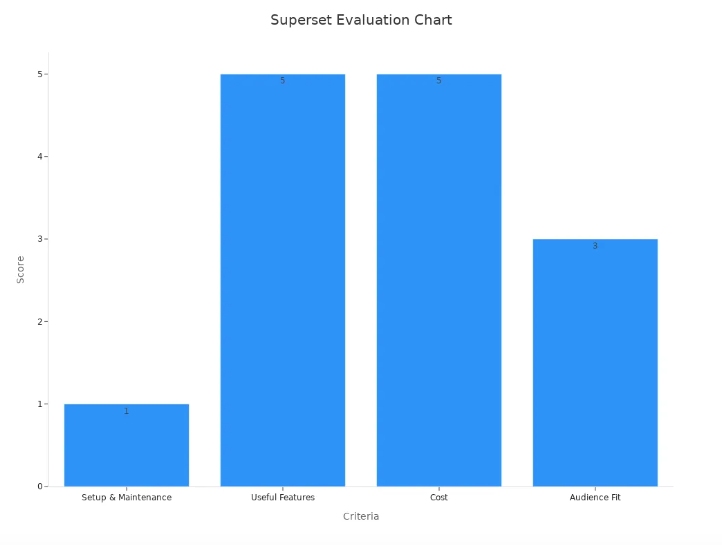
Performance Evaluation of Apache Superset
The following table highlights key performance metrics for Apache Superset:
Criteria
Evaluation
Score
Setup & Maintenance
Difficult to set up and maintain, with stability issues.
1 out of 5
Useful Features
Rich visualizations, SQL Lab, and high customizability.
5 out of 5
Cost
Open-source and free to use.
5 out of 5
Audience Fit
More suited for technical users, lacks polish for general audience.
3 out of 5
Apache Superset excels in delivering powerful features and cost-effectiveness, but it may not be the best fit for non-technical users. If your team has the technical expertise, this tool can be a game-changer for your business intelligence strategy.
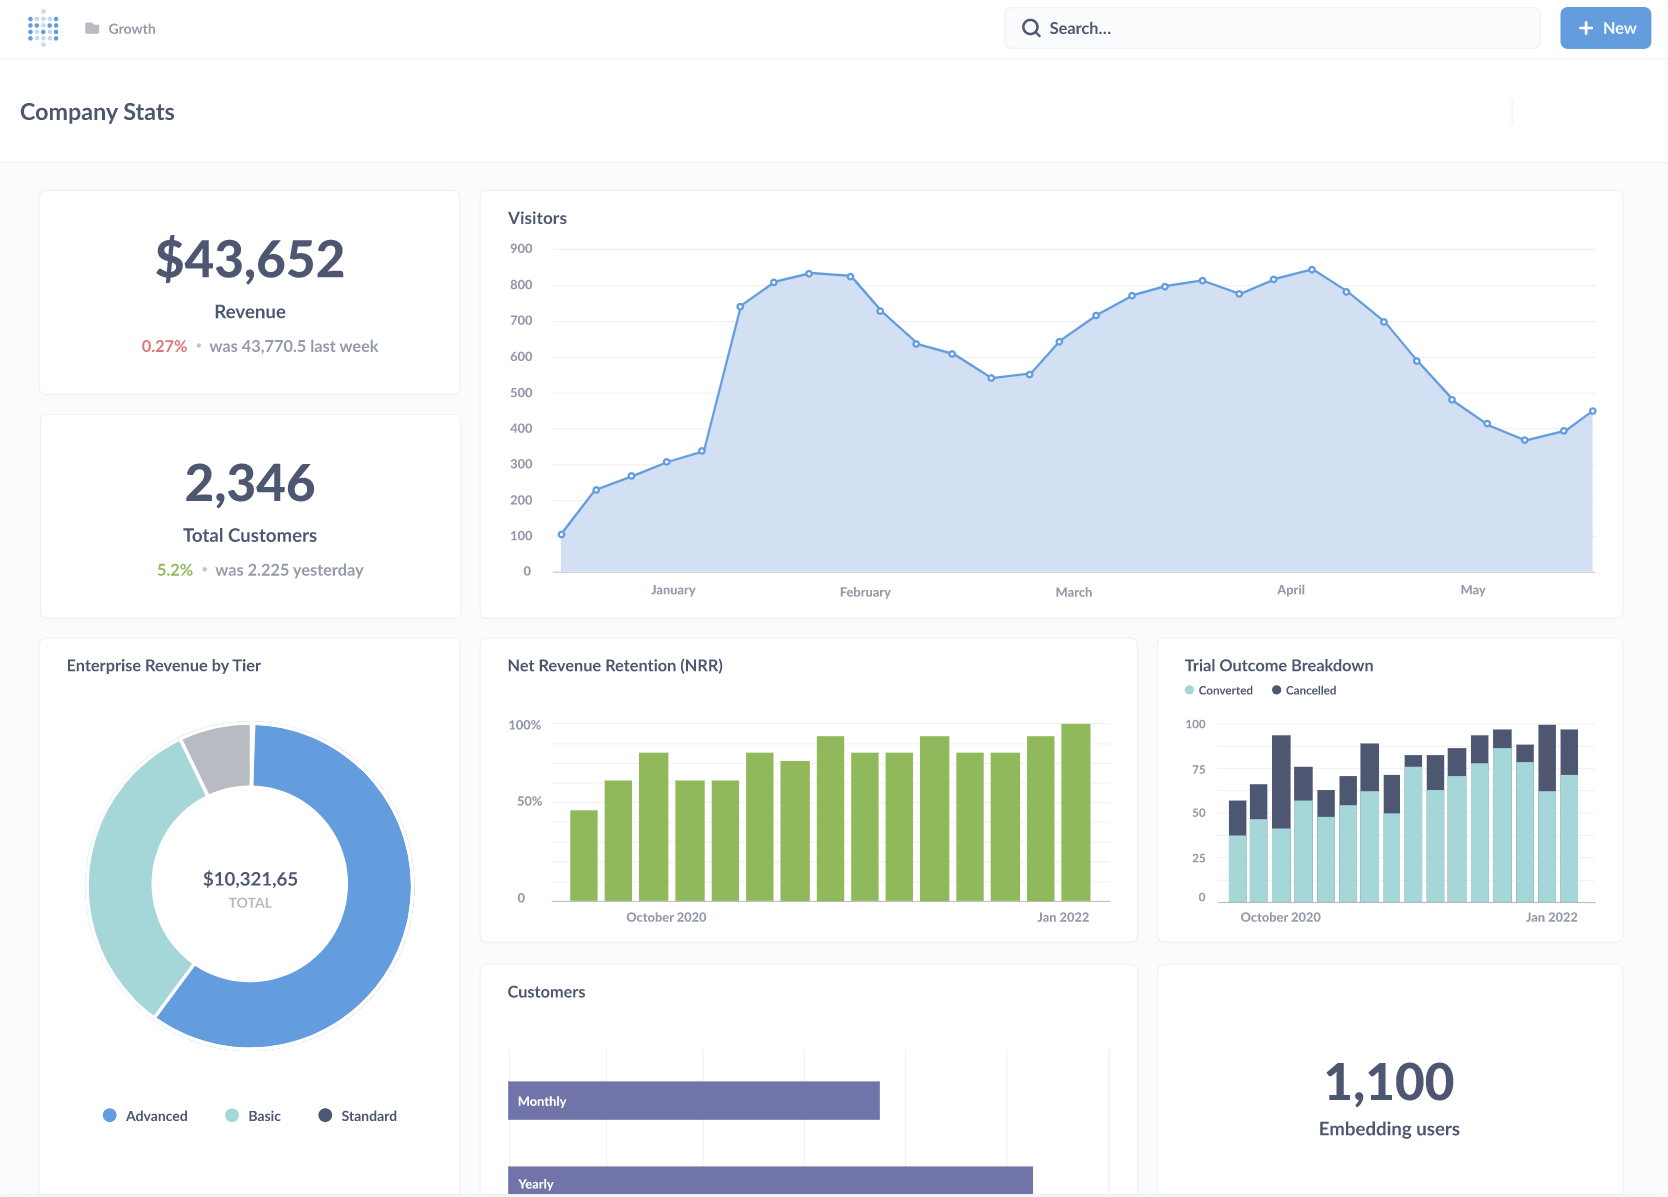
3.Metabase
Metabase has gained immense popularity among businesses seeking open-source BI tools due to its simplicity and flexibility. You can create tailored dashboards and reports without needing advanced technical skills. Its user-friendly interface makes it accessible to small businesses and large enterprises alike.
Metabase integrates seamlessly with various data sources, allowing you to analyze data from multiple streams quickly. This capability is crucial for organizations that rely on diverse datasets to make informed decisions. Its open-source nature ensures you can customize it to suit your unique requirements, enhancing its appeal as a reliable BI solution.
Why Businesses Choose Metabase
Increasing Adoption of Open-Source Solutions: Metabase attracts a wide range of users, from startups to established corporations, looking for cost-effective business intelligence tools.
Customization and Flexibility: You can design dashboards and reports tailored to your specific needs, making it a versatile choice for businesses.
Integration Capabilities: Its compatibility with various data sources ensures quick and efficient data analysis, saving time and resources.
Metabase’s simplicity and adaptability make it a top choice for businesses that prioritize ease of use and integration capabilities. Whether you’re a small business or a large enterprise, this tool can help you unlock valuable insights from your data.
4.BIRT (Business Intelligence and Reporting Tools)
BIRT is a robust open-source BI platform designed for creating data visualizations and reports. It’s particularly suited for developers and technical users who need a powerful tool for integrating business intelligence into their applications. You can use BIRT to generate detailed reports and dashboards that provide a comprehensive view of your business performance.
One of BIRT’s strengths lies in its ability to handle complex data sources. It supports a wide range of formats, enabling you to analyze data from multiple systems. Its open-source nature allows you to customize it extensively, ensuring it meets your specific requirements.
Key Metrics for Evaluating Open Source BI Tools
The table below outlines essential performance metrics that validate the effectiveness of open-source BI tools like BIRT:
Metric
Description
Data consistency
Ensures outputs from different systems align, maintaining data validity.
Data delivery time
Measures the lag between data generation and availability, impacting the usefulness of BI systems.
Data provenance
Tracks the origins and transformations of data, ensuring user confidence in presented data.
System uptime
Monitors the availability of the BI system to users.
Data ingestion rate
Indicates the speed and capacity of data processing, crucial for timely analytics.
Data transformation time
Reflects the efficiency of data processing workflows, affecting data freshness.
Query response time
Measures the time taken to execute queries and generate reports.
Time to insight
Assesses the duration from analysis initiation to deriving insights.
BIRT’s ability to deliver consistent data and handle complex workflows makes it a reliable choice for businesses with advanced reporting needs. If your organization requires detailed reports and dashboards, BIRT can provide the tools you need to succeed.
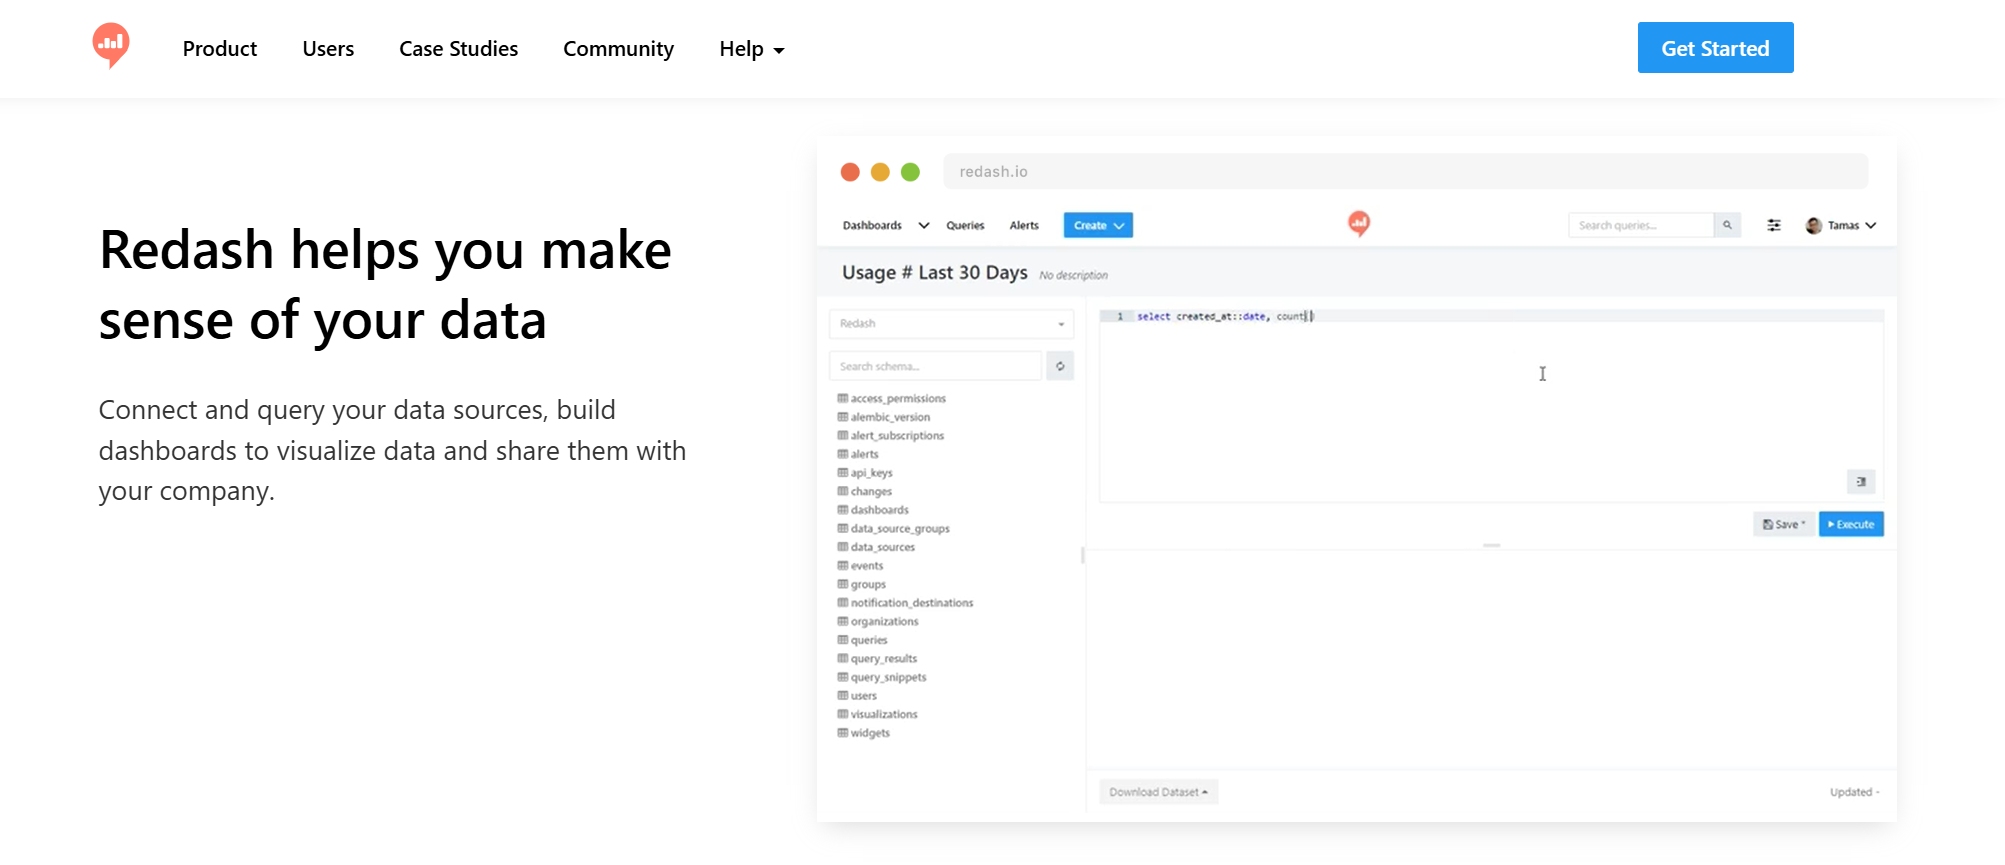
5.Redash
Redash is a lightweight and user-friendly open-source BI tool designed for teams that need quick and efficient data visualization. It allows you to connect to a wide range of data sources, including SQL databases, Google Sheets, and APIs, without requiring extensive technical expertise. With Redash, you can create interactive dashboards that provide real-time insights into your business performance.
One of Redash's standout features is its query editor. This tool enables you to write SQL queries directly or use its visual query builder for a more intuitive experience. Once you retrieve the data, you can transform it into visually appealing charts and graphs. These visualizations can then be shared with your team through customizable dashboards, fostering collaboration and data-driven decision-making.
Tip: Redash is ideal for small to medium-sized businesses that need a simple yet powerful solution for creating dashboards and analyzing data.
Although Redash is easy to use, it may not offer the advanced analytics capabilities found in more complex business intelligence tools. However, its simplicity and focus on core features make it a great choice for teams that prioritize speed and ease of use.
6.KNIME
KNIME (Konstanz Information Miner) is a powerful open-source BI tool that excels in data integration, preparation, and advanced analytics. It provides a visual workflow interface, allowing you to drag and drop nodes to create complex data pipelines without writing code. This feature makes KNIME accessible to both technical and non-technical users.
What sets KNIME apart is its flexibility and extensibility. It supports integration with popular programming languages like Python, R, and Java, enabling you to enhance its functionality as needed. KNIME also offers advanced data preparation capabilities, making it easier to clean, transform, and analyze large datasets.
The following table highlights how KNIME compares to other open-source BI tools in key areas:
Feature
KNIME
Other Open-Source BI Tools
Flexibility
High
Varies
Extensibility
Strong community support
Limited
Data Preparation Capabilities
Advanced
Basic to Moderate
Integration with Technologies
Supports R, Python, Java
Limited integration options
KNIME's strong community support ensures you have access to extensive documentation, tutorials, and forums. This collaborative environment fosters innovation and helps you overcome challenges quickly. Whether you need to build predictive models or create detailed dashboards, KNIME provides the tools to meet your business intelligence needs.
7.Pentaho
Pentaho is a comprehensive open-source BI platform that combines data integration, analytics, and reporting into a single solution. It offers a suite of tools designed to help you extract, transform, and load (ETL) data from various sources, making it easier to analyze and visualize complex datasets.
One of Pentaho's key strengths is its ability to handle large-scale data processing. Its ETL capabilities allow you to prepare data for analysis efficiently, while its reporting tools enable you to create detailed dashboards and reports. These features make Pentaho a popular choice for businesses that deal with high volumes of data.
Pentaho also supports integration with big data technologies like Hadoop and Spark, giving you the flexibility to work with modern data architectures. Its open-source nature allows you to customize the platform to suit your specific requirements, ensuring it aligns with your business goals.
Note: While Pentaho offers a wide range of features, its complexity may require a steeper learning curve compared to simpler open-source BI tools. However, its robust capabilities make it a valuable asset for businesses with advanced analytics needs.
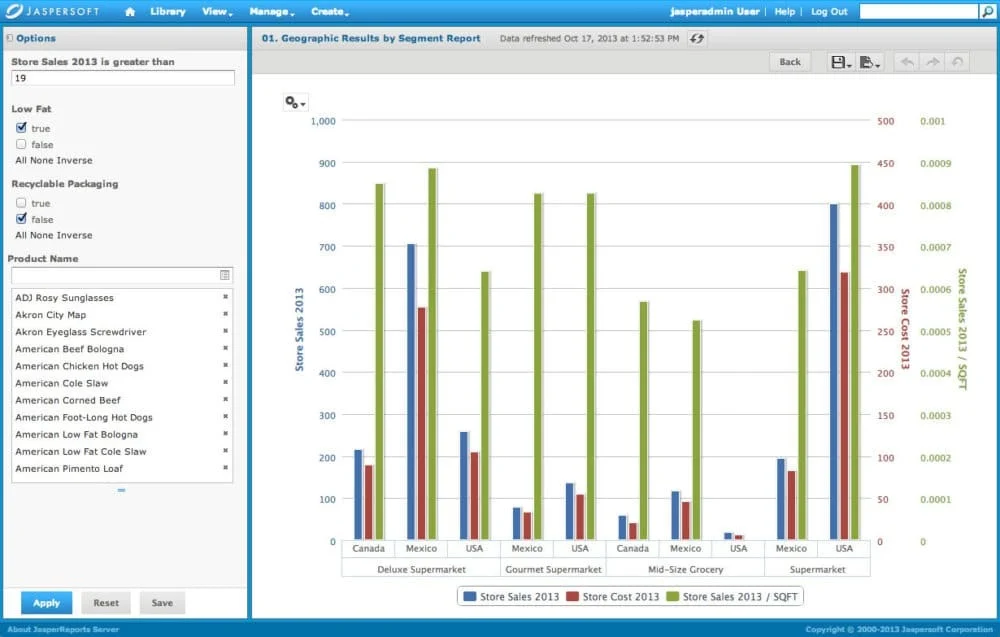
8.Jaspersoft Community Edition
Jaspersoft Community Edition is a powerful open-source BI tool designed for creating detailed reports and interactive dashboards. It provides a robust platform for businesses that need advanced reporting capabilities without the high costs of proprietary software. You can use it to generate pixel-perfect reports, visualize data trends, and share insights across your organization.
One of its standout features is its ability to handle complex data sources. Jaspersoft supports a wide range of databases, including SQL, NoSQL, and Big Data platforms. This flexibility ensures you can connect to virtually any data source and transform raw data into actionable insights.
Feature
Benefit
Multi-Source Support
Connects to SQL, NoSQL, and Big Data platforms for comprehensive analysis.
Enables real-time data exploration and visualization.
Jaspersoft also offers a customizable interface, allowing you to tailor the tool to your specific needs. Whether you want to embed reports into your applications or create standalone dashboards, this tool provides the flexibility to do so.
Tip: If your business requires high-quality reporting and seamless integration with diverse data sources, Jaspersoft Community Edition is an excellent choice.
While Jaspersoft is feature-rich, it may require some technical expertise to set up and maintain. However, its extensive documentation and active community support make it easier to overcome challenges.
Features to Look for in Open Source BI Tools
Scalability and Performance
When choosing open source BI tools, scalability and performance should be at the top of your checklist. A scalable tool ensures that as your data grows, the system can handle the increased load without compromising speed or efficiency. Performance metrics like query response time and data ingestion rate are critical for evaluating how well a tool processes and delivers insights.
Look for features like an analytics lake, which acts as a central repository for structured and unstructured data. This setup allows you to access and analyze data flexibly. Tools with a composable data service layer also stand out. They let you tailor analytics by offering flexibility in querying and consuming data. Advanced caching is another must-have. It speeds up data delivery by storing frequently accessed information, ensuring you get results faster.
A tool with these capabilities will help you maintain smooth operations, even as your business intelligence needs expand. FanRuan’s FineBI exemplifies these best practices with its proprietary Spider engine and extract-cluster architecture. Whether you choose live-query mode against your data warehouse or switch to extracted-data mode for ultra-fast OLAP analyses, FineBI delivers sub-second query responses on tens of millions of rows. Horizontal scaling is as simple as adding nodes to your extract cluster, boosting concurrency and throughput without forklift upgrades. Built-in advanced caching and automatic data partitioning further accelerate repeat queries, while out-of-the-box connectors to 30+ SQL, big-data, and multi-dimensional sources ensure you can unify disparate datasets without costly middleware—maintaining performance at scale and keeping insights flowing smoothly. If you are interested in FineBI, click and put up a request.
Ease of Use and User Interface
The best open-source BI tools prioritize ease of use. A user-friendly interface ensures that everyone on your team, regardless of technical expertise, can navigate the platform and extract insights. Tools with drag-and-drop functionality simplify tasks like creating dashboards and reports.
Self-service analytics is another feature to look for. It empowers users to explore data and generate visualizations without relying on IT teams. This capability saves time and fosters a data-driven culture within your organization.
A clean and intuitive design also enhances the user experience. When tools are easy to use, your team can focus on analyzing data rather than struggling with the software.
FineBI raises the bar for ease of use by pairing a clean, modern UI with powerful drag-and-drop analytics—no SQL or scripting required. Its subject-oriented modeling canvas guides users through building multi-dimensional analyses with visual workflows, so business teams can spin up interactive dashboards in minutes. Self-service is baked in: non-technical users define measures, dimensions, and filters on the fly, while built-in ELT and data-cleansing wizards handle the heavy lifting behind the scenes. The platform’s consistent folder-based organization and intelligent data catalog mean everyone finds the right datasets at their fingertips, reducing dependency on IT. Plus, FineBI’s responsive web and native mobile apps carry that same intuitive experience to tablets and smartphones—so insights stay within reach, whether you’re in the office or on the go.
Integration Capabilities
Integration capabilities are essential for any business intelligence tool. Open-source BI platforms should connect seamlessly with your existing data sources—whether they’re SQL databases, big-data systems, cloud storage, or flat files—to consolidate multiple streams into a single analytics environment. FineBI delivers on this promise with out-of-the-box connectors to over 30 SQL engines (including MySQL, PostgreSQL, and SQL Server), big-data platforms (Hadoop, Spark, Hive), multi-dimensional databases, as well as Excel and CSV files. Its intelligent data catalog automatically profiles and indexes these sources, so users can discover and blend datasets without writing a single line of code.
Visualization tools that integrate well with other systems allow you to create comprehensive data stories—and FineBI goes further by supporting direct connectivity to APIs and cloud data lakes, ensuring real-time analytics against your live data warehouse or high-performance OLAP cubes. Combined with LDAP/AD and SAML-based SSO for security, FineBI adapts to your existing infrastructure, rather than forcing you to rearchitect workflows. By choosing a BI solution with such robust integration capabilities, you streamline data onboarding, reduce maintenance overhead, and maximize the value you derive from every data source.
Data security and compliance are critical when choosing an open-source BI tool. You need to ensure that your data remains protected and meets regulatory standards. Many open-source BI tools adhere to strict data protection laws, such as GDPR (General Data Protection Regulation) and CCPA (California Consumer Privacy Act). These regulations safeguard sensitive information and ensure ethical data handling practices.
To maintain compliance, open-source tools often undergo rigorous audits. These audits evaluate how data is stored, processed, and shared. A robust data governance framework is essential for ensuring compliance. It helps you define clear policies for data access, usage, and retention.
Tip: Always verify whether the BI tool you choose supports compliance with the regulations relevant to your industry.
Here are some key aspects to look for in a secure BI tool:
Encryption: Protects data during transmission and storage.
Access Controls: Ensures only authorized users can access sensitive information.
Audit Trails: Tracks user activity to identify potential security breaches.
By prioritizing these features, you can minimize risks and maintain trust with your stakeholders. Open-source BI tools provide transparency, allowing you to review their code and verify security measures. This openness ensures you can adapt the tool to meet your specific compliance needs.
Community and Documentation Support
A strong community and comprehensive documentation are vital for the success of any open-source BI tool. These resources empower you to troubleshoot issues, learn new features, and maximize the tool's potential.
Open-source BI tools thrive on community-driven innovation. Developers and users worldwide contribute to improving these tools. This collaboration results in frequent updates, new features, and bug fixes. Extensive documentation, forums, and tutorials make it easier for you to get started and resolve challenges.
Note: A well-documented tool saves time and reduces the learning curve for your team.
Research shows that a fully open-source data stack can be highly effective. However, success depends on choosing tools for the right reasons and understanding the implications of support and maintenance. When you select a tool with active community support, you gain access to a wealth of knowledge and expertise.
Resource Type
Benefit
Forums
Connect with other users to share solutions and best practices.
Tutorials
Learn how to use features effectively through step-by-step guides.
Documentation
Access detailed instructions for setup, customization, and troubleshooting.
By leveraging these resources, you can unlock the full potential of your BI tool and ensure it aligns with your business goals.
How to Choose the Right Open Source BI Tools
Assessing Business Needs
Choosing the right open-source BI tool starts with understanding your business needs. Begin by defining your organization's analytical objectives. Do you need detailed reporting, real-time dashboards, or predictive analytics? Identifying these priorities will help you narrow down your options.
Evaluate the features and capabilities of each tool. For example, tools like Metabase offer an intuitive interface for quick insights, while KNIME provides scalable workflows for advanced analytics. If your team requires cutting-edge data exploration, Apache Superset might be a better fit.
Criteria
Description
Analytical Needs
Clearly define your organization's analytical needs and objectives.
Features and Capabilities
Evaluate the functionalities such as data visualization, reporting, and machine learning.
Community Support
Consider the strength of the community and availability of professional support for troubleshooting.
Finally, align your BI strategy with your overall business goals. This ensures the tool you choose supports your long-term vision.
Evaluating Technical Requirements
Technical requirements play a crucial role in selecting the right BI tool. Assess the tool's performance under different conditions. Tools like JMeter and Locust can help you test scalability and response times. For example, JMeter offers load testing to evaluate how well a tool handles high user traffic, while Locust provides real-time statistics for distributed testing.
Tool
Description
Key Features
JMeter
A widely used tool for analyzing and measuring web application performance.
Load and stress testing, user-friendly GUI, extensibility through plugins.
Locust
A scalable performance testing tool scripted in Python.
Programmatic test scenarios, real-time statistics, distributed testing for millions of users.
Additionally, consider integration capabilities. Tools like KNIME and Metabase excel in connecting with other platforms, ensuring seamless data flow. This flexibility is essential for cloud-based business intelligence, where data often resides in multiple systems.
Considering Budget Constraints
Budget constraints often influence your decision. Open-source BI tools eliminate licensing fees, but you should still account for costs like hosting, maintenance, and training. Start by identifying your budget and comparing it to the total cost of ownership for each tool.
Some tools, like Redash, are lightweight and cost-effective, making them ideal for small businesses. Others, like Pentaho, offer advanced features but may require additional resources for setup and maintenance. Conduct demonstrations or proof-of-concept tests to ensure the tool delivers value within your budget.
Tip: Focus on tools that scale with your business. This ensures you only pay for what you need as your data grows.
By balancing your business needs, technical requirements, and budget, you can select a BI tool that empowers your team and supports your goals.
Testing and Trial Periods
Testing and trial periods play a crucial role in choosing the right open-source BI tool. These phases allow you to evaluate the tool's performance, usability, and compatibility with your business needs before committing to it. By testing, you can identify potential challenges and ensure the tool aligns with your goals.
Steps to Conduct Effective Testing
Define Your Objectives: Start by outlining what you want to achieve with the BI tool. For example, do you need advanced visualizations or seamless integration with existing systems?
Create Realistic Scenarios: Use real-world data and workflows during the trial. This approach helps you understand how the tool performs under actual conditions.
Involve Key Stakeholders: Include team members who will use the tool daily. Their feedback will provide valuable insights into its usability and effectiveness.
Measure Performance: Track metrics like query response time, data processing speed, and dashboard loading times.
Tip: Keep a checklist of essential features and compare how well each tool meets your requirements.
Benefits of Trial Periods
Trial periods reduce the risk of investing in a tool that doesn’t meet your expectations. They also give you time to explore advanced features and assess the learning curve. Many open-source BI tools offer free trials or community editions, making it easier to test them without financial commitment.
Key Metric
Why It Matters
Query Response Time
Ensures quick access to insights.
Usability
Determines ease of use for your team.
Integration Capabilities
Confirms compatibility with systems.
Testing and trial periods empower you to make informed decisions. They ensure the tool you choose supports your business intelligence strategy effectively.
Open-source BI tools empower you to make data-driven decisions that drive success. By leveraging accurate and actionable data, you can reduce uncertainty and improve operational efficiency. These tools also provide insights into customer behavior, helping you refine strategies and enhance satisfaction. Organizations that embrace real-time analytics often outperform their peers, demonstrating the strategic value of data.
Explore the tools listed in this blog to find the one that aligns with your needs. Stay updated with emerging trends in business intelligence to maintain a competitive edge. Companies that view data as a strategic asset are significantly more likely to achieve higher revenue and profitability. Make data-driven decision-making a cornerstone of your strategy to unlock your organization’s full potential. Click the banner below to try FineBI for free and empower your enterprise to transform data into productivity!
Access a wealth of case studies, industry insights, and solution guides to accelerate digital transformation.
FAQ
What is an open-source BI tool?
An open-source BI tool is software that helps you analyze and visualize data. It is free to use and modify, allowing you to customize it for your business needs. These tools often have strong community support and frequent updates.
Are open-source BI tools secure?
Yes, many open-source BI tools follow strict security protocols. Features like encryption, access controls, and audit trails protect your data. You can also review the source code to ensure it meets your security standards.
Can small businesses benefit from open-source BI tools?
Absolutely! Open-source BI tools are cost-effective and scalable. They provide small businesses with powerful analytics without high upfront costs. Tools like Metabase and Redash are especially user-friendly for smaller teams.
Do I need technical skills to use open-source BI tools?
Not always. Some tools, like Metabase, are designed for non-technical users with intuitive interfaces. However, others, such as Apache Superset, may require technical expertise for setup and advanced features.
How do I choose the best open-source BI tools?
Start by identifying your business needs. Evaluate features like scalability, integration, and ease of use. Test tools during trial periods to ensure they align with your goals. Consider community support and documentation for long-term success.