Business Intelligence (BI) tools like Tableau, Power BI, and FineReport have transformed how organizations in Malaysia analyze data. Tableau stands out for its advanced visualizations, making it ideal for exploring complex datasets. Power BI excels in integration with Microsoft products and offers a budget-friendly option for small to medium-sized businesses in Malaysia. FineReport specializes in enterprise-level reporting, delivering pixel-perfect reports and dashboards with ease. Choosing the right tool depends on your specific needs. This blog will guide you through the comparison of tableau vs power bi vs FineReport, helping you make an informed decision.
When choosing a business intelligence tool, you should focus on features that enhance decision-making and operational efficiency. Tools like Tableau, Power BI, and FineReport offer a range of capabilities to meet diverse needs. Here are some key features to consider:
| Feature | Description |
|---|---|
| Data Integration | Combines data from various sources for a unified view. |
| Data Analytics | Analyzes data to uncover insights and trends. |
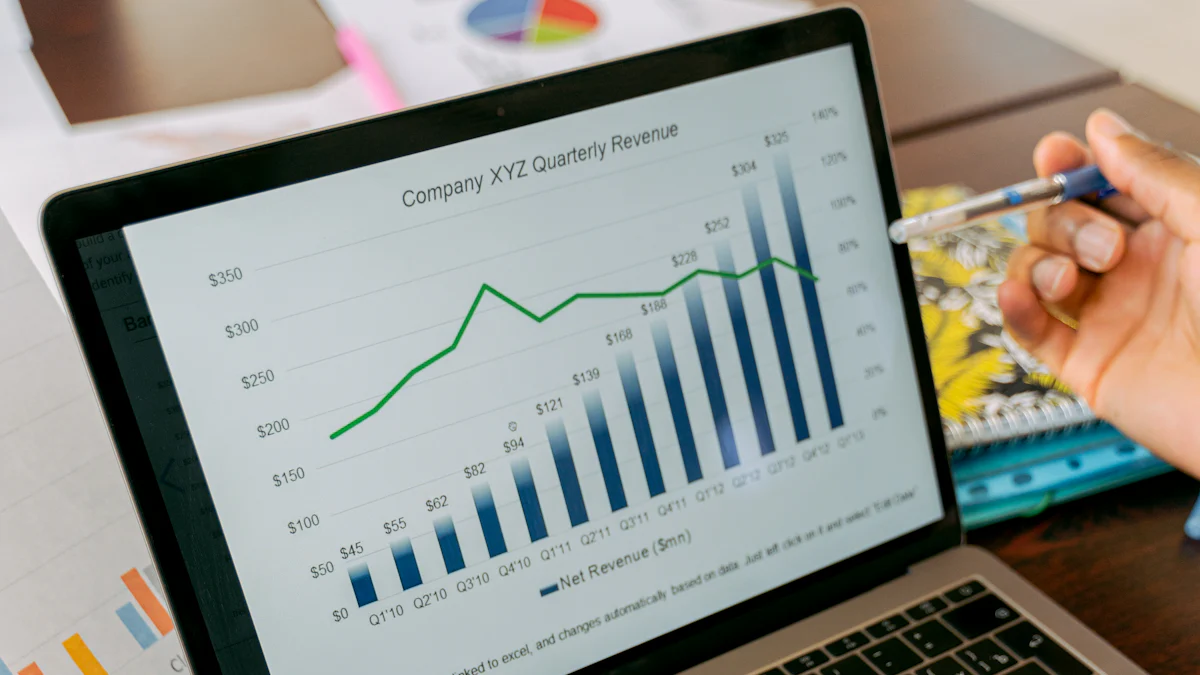
| Data Visualization | Presents data in graphical formats for easier interpretation. |
| Real-time Analytics | Allows for immediate analysis of data as it becomes available. |
| Customizable Dashboards | Enables users to tailor dashboards to their specific needs and preferences. |
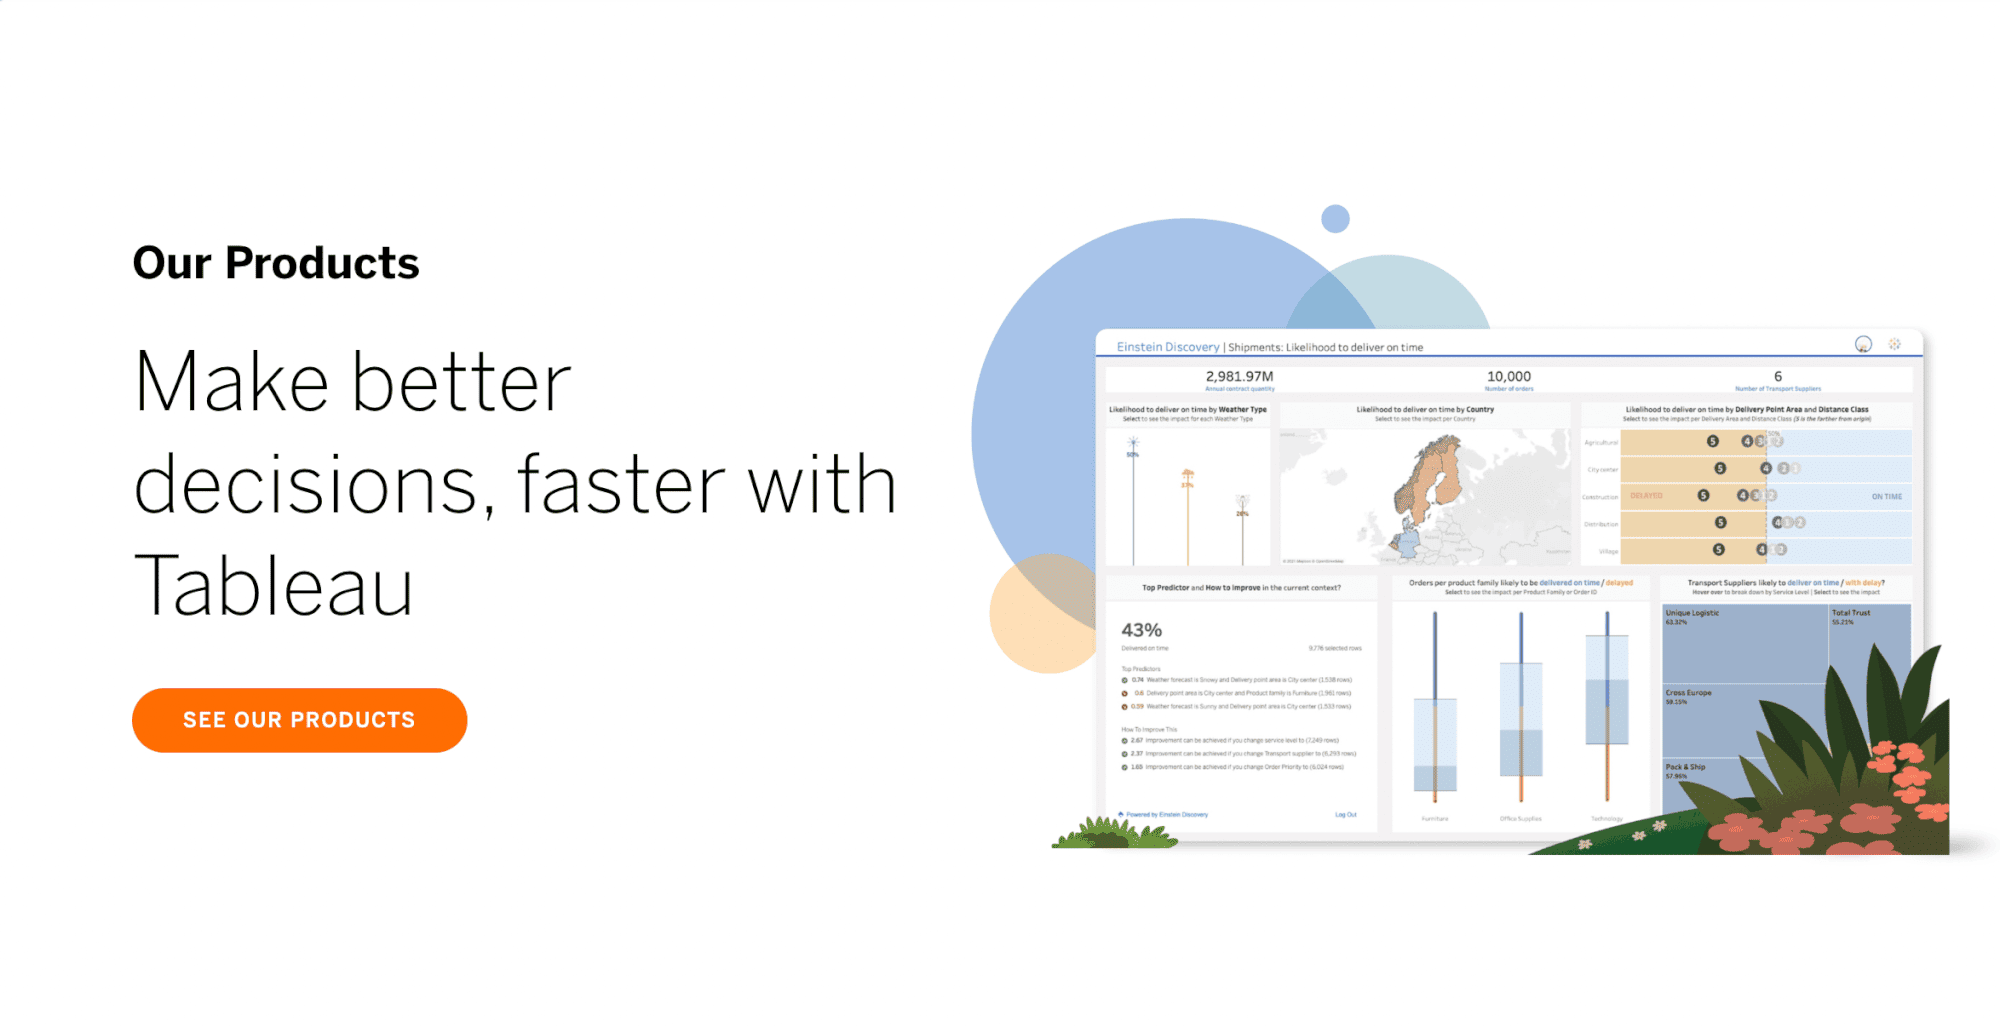
Tableau offers a robust set of features that cater to diverse business intelligence needs. Its advanced data visualization capabilities allow you to create visually appealing outputs like bar charts, maps, and dashboards. These visuals make complex data easier to understand and improve decision-making. Tableau also simplifies data integration by connecting seamlessly with multiple data sources, enabling quick and efficient analysis.
Tableau excels in transforming raw data into actionable insights. Its intuitive interface empowers you to explore data and create reports without requiring extensive technical expertise. Analysts, BI professionals, and visualization specialists rely on Tableau to present complex data in simple terms, making it accessible to stakeholders. These strengths make Tableau a preferred choice for businesses in Malaysia aiming to leverage data for strategic growth.
Tableau shines in specific business scenarios in Malaysia where its advanced visualization and analytical capabilities can make a significant impact. You should consider Tableau if your organization in Malaysia prioritizes data storytelling and interactive dashboards.
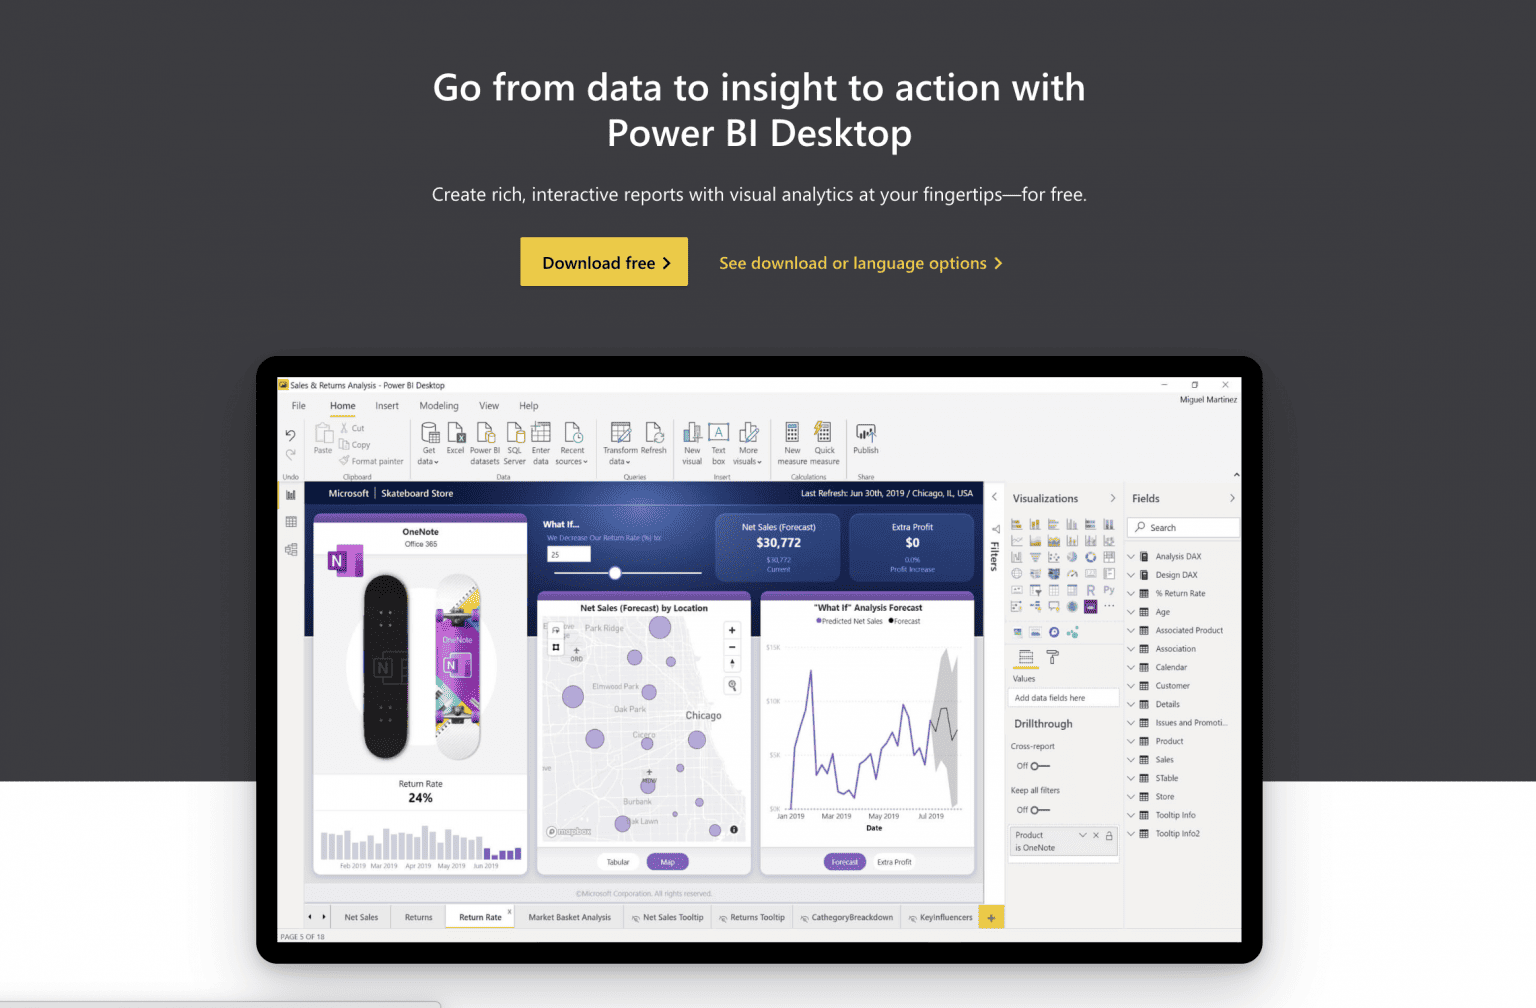
Power BI offers a comprehensive suite of features tailored to meet diverse business intelligence needs. Its advanced analytics capabilities allow you to uncover patterns and forecast trends using machine learning and predictive modeling. The platform also excels in data visualization, providing tools to create interactive dashboards and reports that simplify complex data.
Power BI also provides a centralized platform where you can create personalized dashboards. It integrates seamlessly with diverse data sources, ensuring a unified view of your operations. Additionally, its accessibility across devices enables you to make informed decisions anytime, anywhere.
Power BI stands out for its ease of use and seamless integration with Microsoft products like Excel, SharePoint, and Dynamics 365. This integration simplifies data consolidation, making it easier for you to analyze and share insights across your organization in Malaysia. The platform's drag-and-drop interface and pre-built templates further streamline the process of building interactive dashboards.
These strengths democratize advanced analytics, allowing businesses of any size in Malaysia to leverage data for strategic growth. Whether you're a small business owner or part of a large enterprise, Power BI adapts to your needs.
Power BI proves to be a versatile tool for various business scenarios in Malaysia. Its features cater to organizations of all sizes in Malaysia, helping you make data-driven decisions with ease.

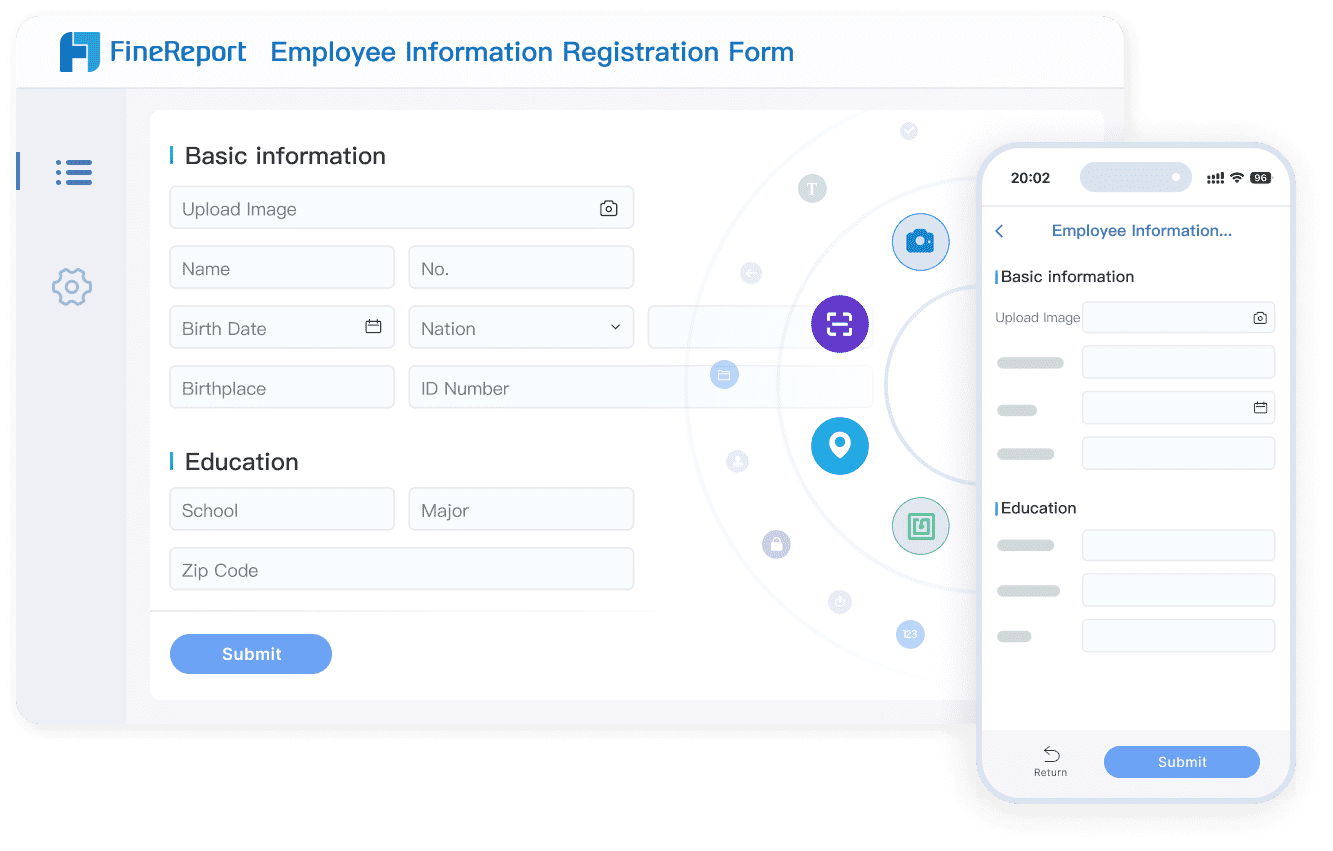
FineReport offers a robust set of features tailored to meet the reporting and analytics needs of businesses in Malaysia. Its data writeback capability allows you to design web and app forms that can update databases like MySQL, Oracle, and SQL Server. This feature ensures seamless data management across platforms. The software also functions as an enterprise-level platform, supporting online analysis reports, dashboards, and timed report distribution. These capabilities make it suitable for businesses of all sizes in Malaysia.
FineReport also excels in printing functions, offering advanced options like PDF and applet printing. You can customize these settings to suit your business needs in Malaysia. Additionally, the software provides an open API, enabling integration with existing systems such as ERP or MES. This flexibility ensures that FineReport adapts to your unique operational requirements.

FineReport stands out for its user-friendly design and enterprise-grade capabilities. Its drag-and-drop interface simplifies report creation, even for users without technical expertise. You can connect to multiple data sources and create pixel-perfect reports with ease. The software also supports permission control, ensuring that employees only access data relevant to their roles. This feature enhances data security and accuracy.
Another strength lies in its scalability. FineReport handles large datasets efficiently, making it ideal for growing businesses in Malaysia. Its ability to integrate with other tools through APIs further enhances its adaptability. Whether you need to generate complex reports or manage real-time data, FineReport provides a comprehensive solution.
Tip: Leverage FineReport's learning resources, including 2000 online documents and 10,000 forums, to maximize its potential.
FineReport provides a powerful solution for businesses in Malaysia that require advanced reporting and data management. Its unique features make it suitable for a variety of scenarios. Here are some ideal use cases where FineReport can add significant value:
| Scenario | Benefit |
|---|---|
| Pixel-Perfect Reports | Ensures accuracy and professional formatting. |
| Real-Time Data Access | Provides up-to-date insights for faster decisions. |
| Complex Data Integration | Combines data from multiple sources for a unified view. |
| Automated Reporting | Saves time and reduces manual effort. |
FineReport adapts to your business needs in Malaysia, whether you manage a small team or a large enterprise. Its flexibility and robust features make it a valuable tool for improving operational efficiency and decision-making.

Scalability ensures that your BI tool can grow with your business in Malaysia. Whether you're a small startup or a large enterprise, your tool should handle increasing data volumes and user demands.
Tip: For small businesses in Malaysia, Power BI offers a cost-effective way to scale. For enterprises, FineReport provides the robustness needed to manage extensive data operations.
Data entry is a critical feature in business intelligence tools, especially when you need to update or manage data directly within the platform. Among Tableau, Power BI, and FineReport, each tool offers unique capabilities for handling data entry.
Tip: If your business in Malaysia requires frequent data updates within the BI tool, FineReport is the best choice. Its data writeback feature simplifies the process and ensures accuracy.
Data visualization transforms raw data into meaningful insights. Interactive reports take this a step further by allowing you to explore data dynamically. Here's how Tableau, Power BI, and FineReport compare in this area:
| Tool | Visualization Strengths |
|---|---|
| Tableau | Advanced visuals, intuitive interface, excellent for storytelling. |
| Power BI | Custom visuals, AI integration, ideal for predictive analytics. |
| FineReport | Pixel-perfect reports, interactive charts, great for detailed and professional outputs. |
Here’s an interactive demo showcasing how sales report works in FineReport.
Note: Choose Tableau for storytelling, Power BI for AI-driven insights, and FineReport for professional, highly formatted reports.
Integration capabilities determine how well a BI tool fits into your existing tech ecosystem. Whether you use ERP systems, CRM platforms, or cloud services, seamless integration ensures smooth data flow.
Tip: If your organization in Malaysia uses Microsoft tools, Power BI is the most seamless option. For broader integration needs, FineReport provides unmatched flexibility.
Customization and advanced features play a pivotal role in determining how well a business intelligence (BI) tool aligns with your specific needs. Whether you aim to tailor dashboards, integrate third-party tools, or leverage advanced analytics, understanding the customization capabilities of Tableau, Power BI, and FineReport will help you make an informed choice.
Tableau offers extensive customization options, especially for visualizations. You can create dashboards that reflect your brand identity by customizing colors, fonts, and layouts. Tableau also supports extensions, allowing you to add third-party tools or build custom applications to enhance functionality.
Tip: Use Tableau's customization features to create dashboards that resonate with your audience. Tailor visuals to highlight key metrics and make data more accessible.
Power BI excels in integrating with Microsoft products, making it a natural choice if you already use tools like Excel or SharePoint. Its customization features focus on enhancing usability and accessibility.
FineReport stands out for its enterprise-level customization capabilities. Its flexible report designer allows you to create pixel-perfect reports tailored to your business requirements in Malaysia. The software also supports advanced features like data writeback and API integration.
Tip: Leverage FineReport's customization features to create reports that align with your operational needs. Use its API integration to streamline data management.
Each BI tool offers unique customization and advanced features. Here's a quick comparison to help you decide:
| Tool | Customization Strengths | Best For |
|---|---|---|
| Tableau | Advanced visualizations, extensions, R/Python integration | Businesses prioritizing data storytelling and predictive analytics. |
| Power BI | Microsoft integration, AI-powered insights | Organizations using Microsoft tools or seeking AI-driven analytics. |
| FineReport | Pixel-perfect reports, data writeback, API integration | Enterprises needing detailed reports and seamless system integration. |
Recommendation: Choose Tableau for advanced visual storytelling, Power BI for AI and Microsoft integration, and FineReport for enterprise-grade reporting and customization.
By understanding the customization and advanced features of these tools, you can select the one that best aligns with your business goals in Malaysia. Whether you need tailored dashboards, seamless integration, or enterprise-level reporting, these tools offer solutions to meet your needs in Malaysia.
Small businesses in Malaysia often operate with limited budgets and resources, making affordability and ease of use critical factors when selecting a business intelligence tool.
Power BI offers a free desktop version, making it an attractive option for startups. Its integration with Microsoft tools like Excel and Teams simplifies workflows, allowing you to analyze data without additional software investments. FineReport, on the other hand, provides robust reporting capabilities and a user-friendly interface. Its drag-and-drop designer enables you to create professional reports quickly, even with minimal technical expertise.
If your business in Malaysia prioritizes cost-effectiveness and ease of use, Power BI is a great starting point. For those needing advanced reporting features, FineReport delivers exceptional value.
Tip: Start with free or low-cost options like Power BI Desktop or Google Data Studio to explore your BI needs before committing to a paid plan.
Enterprises in Malaysia require BI tools that can handle complex data structures, scale with growing demands, and integrate seamlessly with existing systems. Tableau, Power BI, and FineReport each offer unique advantages for enterprise-level organizations in Malaysia.
Tableau excels in data visualization, making it ideal for enterprises that prioritize data storytelling. Its ability to connect to multiple data sources ensures comprehensive insights. Power BI integrates seamlessly with Microsoft tools, offering scalability and advanced analytics. FineReport provides enterprise-grade reporting with features like data writeback and API integration, making it suitable for organizations in Malaysia managing complex data environments.
Note: Enterprises should evaluate their specific needs, such as scalability and integration, to choose the most suitable tool. FineReport's robust reporting capabilities make it a strong contender for enterprises requiring detailed and professional outputs.
Data-heavy industries like manufacturing, finance, and retail demand BI tools that can process large datasets efficiently while providing actionable insights. FineReport, Tableau, and Power BI each cater to these needs in different ways.
FineReport excels in delivering advanced data visualization and interactive dashboards, making it ideal for data-heavy industries. Its integration with FineVis—a zero-code, drag-and-drop visualization platform—empowers users to create dynamic dashboards featuring over 60 chart types, immersive 3D models, and real-time data interactions. This combination facilitates intuitive data exploration and storytelling, enabling organizations in Malaysia to monitor key metrics and make informed decisions swiftly. FineReport's robust capabilities in handling large datasets and providing rich, interactive visualizations make it a standout choice for industries requiring detailed and customizable reporting solutions.
Tableau offers advanced visualization capabilities, helping you identify trends and patterns in complex datasets. Power BI provides real-time analytics, enabling you to monitor key metrics and respond quickly to changes.
| Feature | Benefit |
|---|---|
| Predictive Analytics | Enables forecasting of future trends and behaviors, enhancing strategic decision-making. |
| User-Friendliness | Accessible to users of all skill levels, promoting wider adoption and effective use. |
| Integration Capabilities | Seamlessly connects with existing systems, ensuring smooth data flow and analysis. |
| Real-Time Analytics | Facilitates quick decision-making, crucial for maintaining competitiveness in the market. |

Tip: For industries requiring real-time insights, Power BI's analytics capabilities are invaluable. FineReport's robust reporting and data integration make it ideal for managing large-scale operations.
By understanding your industry's specific requirements, you can select the BI tool that best aligns with your goals in Malaysia. Whether you prioritize real-time analytics, advanced visualizations, or detailed reporting, tools like Tableau, Power BI, and FineReport offer solutions tailored to your needs in Malaysia.
When your business in Malaysia revolves around generating detailed, professional reports, choosing the right BI tool becomes crucial. Reports serve as the backbone of decision-making, offering insights into performance, trends, and areas for improvement. Among Tableau, Power BI, and FineReport, each tool brings unique strengths to the table. However, FineReport stands out as the most suitable option for report-centric needs due to its advanced reporting capabilities and enterprise-grade features.
Reports provide a structured way to present data, making it easier to analyze and act upon. Whether you need daily operational reports, financial summaries, or compliance documentation, a robust reporting tool ensures accuracy and efficiency. Here’s why reporting is essential:
Tip: If your business in Malaysia relies heavily on periodic reporting, prioritize tools that offer automation and customization.
Each BI tool offers reporting features, but their focus and strengths vary. Let’s compare them based on key reporting needs:
| Feature | Tableau | Power BI | FineReport |
|---|---|---|---|
| Report Customization | Limited formatting options | Moderate customization | Highly customizable, pixel-perfect |
| Automated Scheduling | Requires third-party tools | Basic scheduling capabilities | Advanced task scheduling |
| Data Integration | Strong, but visualization-focused | Seamless with Microsoft tools | Extensive, supports 100+ sources |
| Ease of Use | Intuitive for visualizations | User-friendly for dashboards | Spreadsheet-like interface |
| Enterprise Features | Limited reporting focus | Balanced features | Enterprise-grade reporting |
FineReport excels in meeting the demands of report-centric businesses in Malaysia. Its features are specifically designed to simplify complex reporting tasks while maintaining precision and professionalism.
User-Friendly Interface
FineReport’s spreadsheet-like interface makes it easy to use, even for non-technical users. The drag-and-drop designer simplifies report creation, reducing the learning curve.

Note: FineReport’s ability to handle large datasets and integrate seamlessly with other systems makes it ideal for enterprises managing complex data environments.
FineReport is the best choice for businesses in Malaysia that prioritize reporting. Here are some scenarios where it shines:
Here’s an interactive demo showcasing how financial report works in FineReport.
If your business revolves around creating detailed, professional reports, FineReport is the tool you need. Its advanced features, user-friendly design, and enterprise-grade capabilities make it the ultimate choice for report-centric needs. While Tableau and Power BI offer strong visualization and dashboarding capabilities, FineReport’s focus on reporting sets it apart.
Tip: Explore FineReport’s free trial to experience its reporting capabilities firsthand. You’ll see why it’s the preferred choice for enterprises worldwide.
Choosing the right business intelligence tool depends on your unique needs. Tableau excels in advanced visualizations, making it ideal for data storytelling. Power BI offers seamless integration with Microsoft tools and affordability, perfect for small businesses or teams in Malaysia. FineReport stands out for enterprise-level reporting, providing pixel-perfect outputs and robust data integration.
When deciding, consider key trends like user-friendly interfaces, AI capabilities, and data security. For example, 96% of business leaders believe AI improves decision-making. Tools like FineReport and Power BI empower users with self-service analytics, reducing IT dependency. Evaluate your goals and data complexity to select the best fit for your business in Malaysia.
Tip: Use tools that align with your scalability and integration needs to future-proof your business intelligence strategy.
Click the banner below to try FineReport for free and empower your enterprise to transform data into productivity!

The Author
Lewis
Senior Data Analyst at FanRuan
Related Articles

10 Custom Reporting Dashboard Tools Compared: Features, Limits, and Best-Fit Use Cases
Compare 10 custom reporting dashboard tools on features, limits, and best-fit use cases.
Lewis Chou
May 03, 2026

10 Best Dashboard Reporting Tools for 2026 Compared: Power BI, Tableau, Looker Studio, and More
Dashboard reporting tools are software platforms that turn business data into interactive dashboards, scheduled reports, and decision ready insights.
Lewis Chou
Apr 27, 2026
How to create an HTML report from scratch in 2026
Build an html report from scratch in 2026 with easy steps, tools, and tips for customization, sharing, and making your data clear and interactive.
Lewis Chou
Mar 23, 2026


