Descriptive analytics serves as a fundamental tool in data analysis, focusing on understanding past events by examining historical data. This approach provides businesses with valuable insights into patterns and trends, enabling them to make informed decisions. In today's fast-paced business environment, descriptive analytics plays a crucial role in enhancing operational efficiency and strategic planning. Tools like FineReport and FineBI empower organizations to harness the power of descriptive analytics, offering user-friendly interfaces for data visualization and reporting. These tools facilitate the transformation of complex datasets into actionable insights, driving business growth and innovation.

Definition and Overview of Descriptive Analytics
What is Descriptive Analytics?
Descriptive analytics serves as a foundational element in the realm of data analytics. It focuses on analyzing historical data to provide insights into past events, patterns, and trends. By employing techniques such as exploratory data analysis and data visualization, organizations can derive actionable insights that drive strategic decision-making and optimize operations.
Key Characteristics
Descriptive analytics involves summarizing data to reveal key insights. This process includes calculating summary measures like averages, totals, percentages, or ratios relevant to the subject being analyzed. It simplifies complex datasets by providing clear summaries, often utilizing data visualization techniques to make the information more accessible and understandable.

Historical Context
The roots of descriptive analytics can be traced back to the early days of statistical analysis. As businesses began to collect more data, the need to understand and interpret this information became crucial. Over time, descriptive analytics evolved, incorporating advanced tools and technologies to enhance its effectiveness. Today, it remains a vital component of business intelligence, offering a solid foundation for tracking trends and gauging performance over time.
Importance of Descriptive Analytics
Descriptive analytics is a cornerstone of data analysis, offering organizations a thorough understanding of past events. By examining historical data, it allows businesses to assess their performance, recognize recurring trends, and gain insights into key patterns. This retrospective view is crucial for making well-informed decisions, refining strategies, and ensuring continuous improvement. Without this foundation, organizations may struggle to identify underlying factors that influence their operations and outcomes.
Role in Data Analysis
Descriptive analytics serves as the essential first phase in the broader data analysis framework. It organizes raw data into meaningful summaries, transforming complex information into an easily understandable format. This step is invaluable for identifying patterns and trends that might otherwise be overlooked. By painting a clear picture of what has occurred, descriptive analytics paves the way for more advanced approaches like predictive and prescriptive analytics, which build on the insights derived from historical data to forecast future events and optimize decision-making.
Benefits for Businesses
The practical advantages of descriptive analytics for businesses are vast. By measuring performance against predefined benchmarks, it helps organizations pinpoint strengths and areas in need of improvement. The insights it offers into customer behavior, preferences, and interactions enable businesses to fine-tune their marketing efforts, ensuring they target the right audience more effectively. Furthermore, descriptive analytics enhances reporting capabilities, allowing businesses to create comprehensive, data-driven reports that are critical for both internal decision-making and external communications with stakeholders. Overall, descriptive analytics equips businesses with the tools to make better, data-backed decisions and drive sustained success.
Key Components of Descriptive Analytics
Descriptive analytics is built upon several essential components that transform raw data into actionable insights. Each component, from data collection to data processing, plays a critical role in ensuring the analysis is both comprehensive and accurate. Together, these elements enable organizations to derive meaningful information from large data sets, ultimately informing better decision-making.
Data Collection for Descriptive Analytics
Data collection forms the cornerstone of descriptive analytics. It involves the systematic gathering of data from a variety of sources to ensure that the analysis captures a full spectrum of relevant information. A diverse and well-structured data collection process is essential for a robust analysis, as it provides the raw material necessary for generating valuable insights.
Sources of Data
To conduct effective descriptive analytics, organizations draw on multiple data sources, each contributing unique information to the analysis:
- Internal Databases: Companies rely heavily on their internal databases, which contain a wealth of transactional data, customer profiles, operational metrics, and historical records. This internal data forms the backbone of most descriptive analytics initiatives, offering a direct view into business performance.
- External Data Sources: Beyond internal resources, businesses often supplement their analysis with external data such as market research reports, competitive benchmarks, social media metrics, and public datasets. These sources enhance the depth of the analysis by adding context and perspective on industry trends and market dynamics.
- Surveys and Questionnaires: Surveys are a valuable tool for gathering firsthand insights into customer preferences, behaviors, and satisfaction levels. This direct input helps businesses understand shifting market trends and consumer demands, adding an important layer of qualitative data to complement quantitative measures.
Ensuring Data Quality and Integrity
For descriptive analytics to yield accurate and actionable insights, maintaining high standards of data quality and integrity is essential. The accuracy of the analysis is directly linked to the quality of the data being used. Poor data quality—characterized by errors, duplicates, or inconsistencies—can lead to flawed conclusions and misguided strategies. Therefore, organizations must implement rigorous data validation procedures, ensuring that the data is accurate, consistent, and reliable.
Effective data validation processes involve checking for anomalies, correcting errors, and eliminating duplicates. By ensuring data quality at the outset, businesses can confidently rely on their descriptive analytics to guide decision-making, making the insights derived from their analysis both trustworthy and impactful.
Data Processing for Descriptive Analytics
After data is collected, it must undergo processing to prepare it for meaningful analysis. This critical step transforms raw data into a structured format that can be easily interpreted. A range of techniques and tools is employed during this phase to enhance the data’s usability and ensure it’s ready for insightful analysis.
Key Data Processing Techniques
Descriptive analytics utilizes several key techniques to refine and organize data, making it more actionable:
- Data Cleaning: This is a crucial technique that involves identifying and correcting errors, removing inconsistencies, and handling missing values within the dataset. Ensuring the data is clean is foundational to obtaining accurate and reliable results, as poor-quality data can lead to incorrect conclusions.
- Data Aggregation: Aggregation simplifies complex, large datasets by summarizing them into meaningful groups. This technique helps to condense vast amounts of information, making it easier to spot trends and patterns at a glance. By compiling data from various sources or time periods, businesses can view overarching trends across their operations.
- Statistical Analysis: Basic statistical techniques, such as calculating averages, percentages, ratios, and distributions, are used to summarize the data in a clear, concise manner. These calculations reveal key insights and allow businesses to quickly assess their performance and identify areas of interest.
Tools and Technologies for Data Processing
A variety of tools and technologies are available to facilitate the data processing phase in descriptive analytics, each offering unique functionalities that cater to different aspects of the analysis:
- Microsoft Excel and Google Sheets: These widely-used tools provide basic yet powerful data analysis and visualization capabilities. They allow users to organize, clean, and analyze data, as well as create simple graphs and charts. Their ease of use makes them a popular choice for initial data processing and quick analyses.
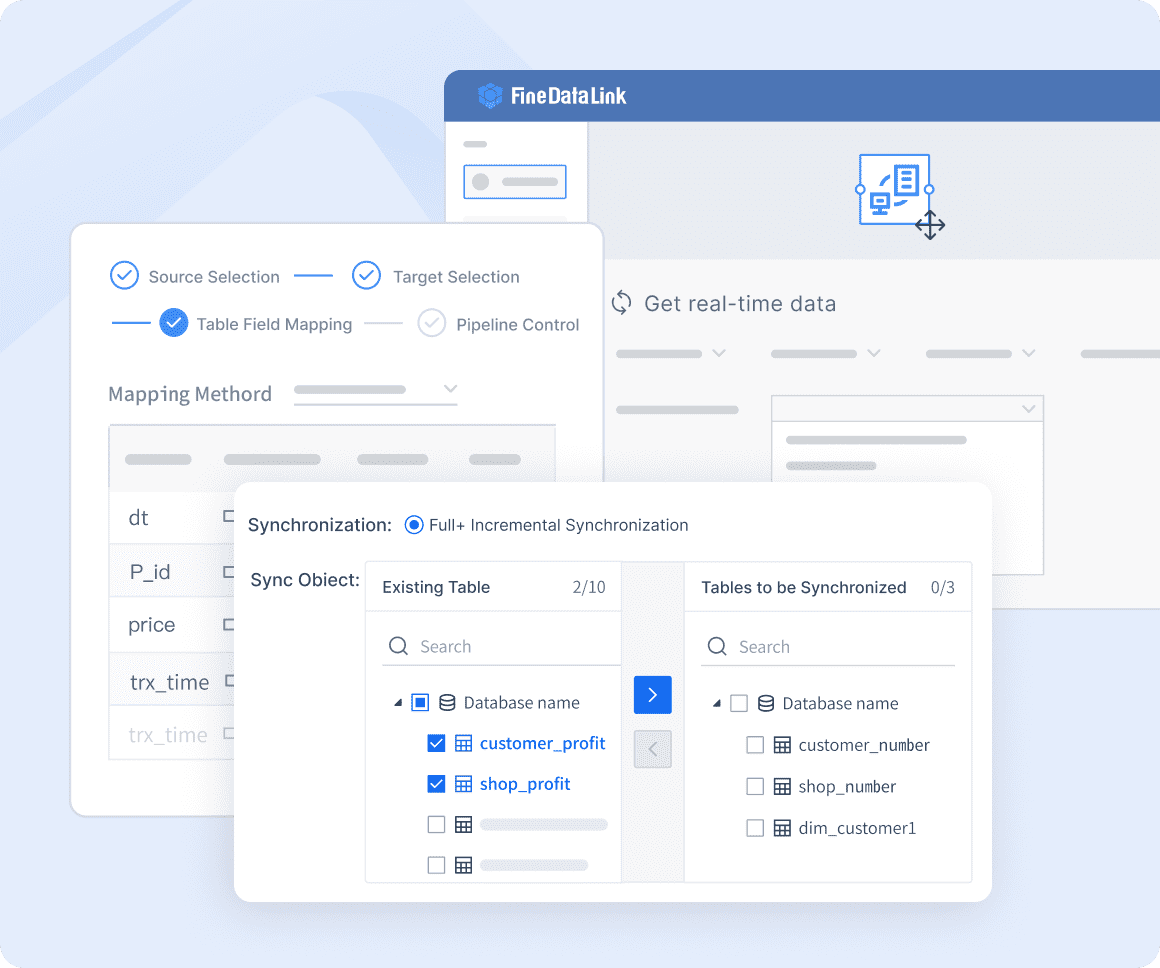
- SQL (Structured Query Language): SQL is a robust tool for managing large datasets. It enables efficient data storage, retrieval, and manipulation, allowing analysts to filter and sort vast amounts of data with ease. SQL is especially useful in environments where data is stored in relational databases.
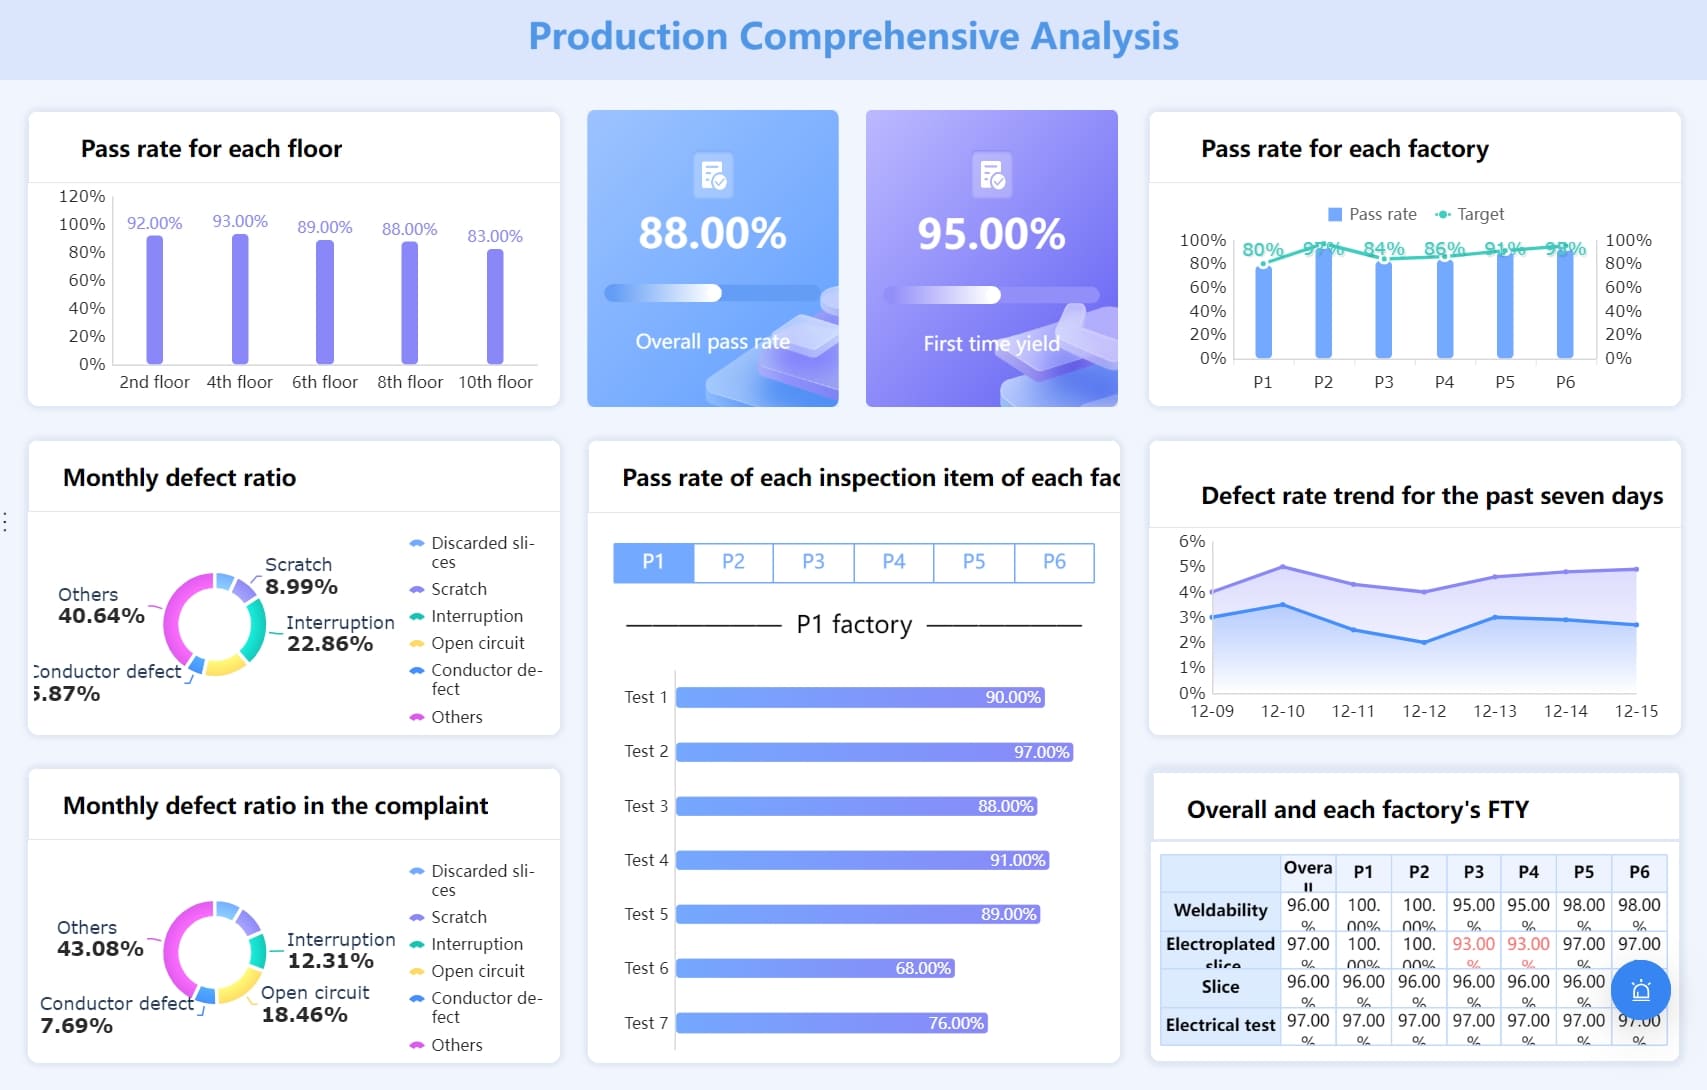
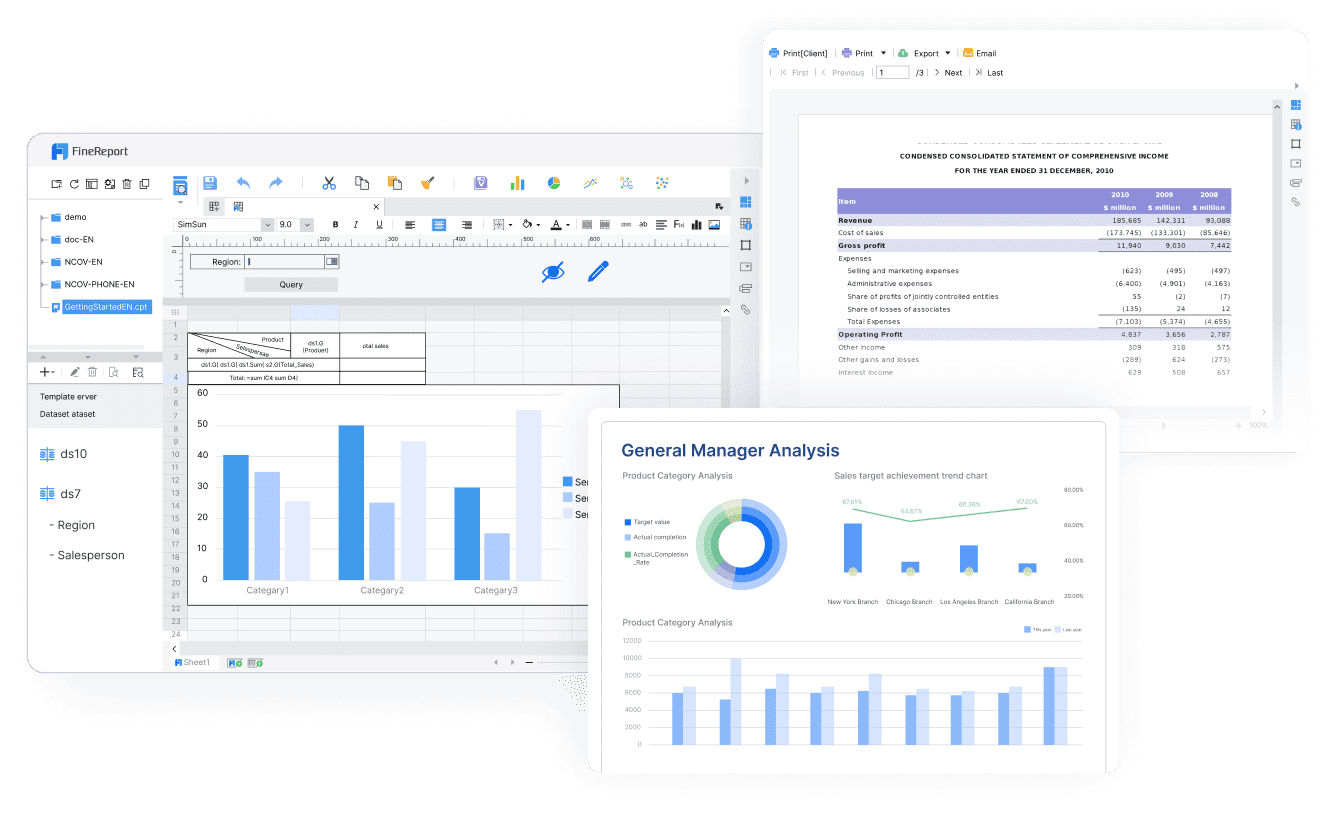
- FineBI and FineReport: These advanced data visualization platforms excel at transforming raw data into dynamic, visually appealing dashboards and charts. They are powerful tools for exploring and communicating data insights, providing users with interactive and customizable visualizations that enhance decision-making.

- R and Python: These programming languages are indispensable for more complex statistical analysis and advanced data visualization. Both offer powerful libraries—such as pandas for data manipulation and matplotlib for visualization—that allow for in-depth analysis. Python and R are particularly favored in data science and research fields for their flexibility and ability to handle large, complex datasets.
By applying these techniques and leveraging advanced tools, descriptive analytics transforms raw and unstructured data into actionable insights. This process enables organizations to better understand past events, uncover valuable patterns, and make informed decisions that are grounded in data. The end result is a clearer view of historical performance, which is essential for future planning and strategy development.
Key Processes in Descriptive Analytics
Descriptive analytics encompasses several crucial processes that convert raw data into valuable insights. These processes ensure the data is accurate, well-organized, and ready for comprehensive analysis, forming the foundation for meaningful interpretations.
Data Cleaning: The Backbone of Descriptive Analytics
Data cleaning is a critical, foundational step in the descriptive analytics process. It ensures that the dataset is free from errors, inconsistencies, and redundancies, which are essential for producing accurate and reliable results. Without this step, faulty data can lead to misleading conclusions and suboptimal decisions.
Essential Methods and Techniques for Data Cleaning
Error Detection and Correction: This method involves carefully scrutinizing the dataset for typographical errors, missing values, and incorrect entries. Analysts use automated tools and manual reviews to detect anomalies and correct them, ensuring the dataset reflects reality. For instance, ensuring that numerical values are within expected ranges or checking for misplaced data entries can drastically improve data integrity.
Duplicate Removal: Removing duplicate entries is essential to prevent the distortion of results. Duplicates can skew statistical outcomes and lead to overrepresentation of certain data points. By eliminating these redundancies, analysts guarantee that each record is unique, contributing to more precise and trustworthy analysis.
Data Standardization: Standardizing data formats is crucial for consistency across the dataset. This includes ensuring uniform formats for dates, currency, and other units of measurement. For instance, aligning all date formats (e.g., DD/MM/YYYY) or converting currency values to a single standard prevents misinterpretation during analysis and simplifies comparisons.
Outlier Detection and Handling: Outliers—data points that deviate significantly from other observations—can skew results and lead to misinterpretation. Identifying these anomalies is a vital part of the cleaning process. Analysts may choose to remove outliers if they are deemed irrelevant or adjust them if they represent valuable but extreme data. Proper handling of outliers ensures that the analysis is reflective of typical patterns, without being distorted by rare, atypical events.
Challenges in Data Cleaning and Effective Solutions
The data cleaning process, while essential, is not without its challenges. Incomplete data, inconsistencies in formatting, and the sheer volume of data to be processed can all pose significant obstacles to obtaining accurate insights. However, with the right strategies and tools, these challenges can be effectively managed to ensure the quality of the data and the reliability of descriptive analytics.
Key Challenges
- Incomplete Data: Missing values and gaps in data can severely limit the scope of analysis, leading to biased or inaccurate results. Incomplete datasets may omit critical information, reducing the overall reliability of the findings and making it difficult to draw actionable conclusions.
- Inconsistent Formats: When data from multiple sources is combined, inconsistent formats—such as differing date formats, currencies, or units of measurement—can create complications during processing. This inconsistency leads to errors during analysis, where comparisons and calculations may become skewed due to format discrepancies.
- Large-Scale Data Management: Handling massive volumes of data, especially in large organizations, can be overwhelming. The more data there is, the greater the likelihood of errors, duplicates, and inconsistencies. Manually processing such data becomes inefficient and prone to mistakes.
Effective Solutions
To overcome these challenges, analysts implement several strategies to maintain data integrity and streamline the cleaning process:
- Robust Validation Rules: Implementing validation rules helps to automatically flag errors and inconsistencies in real time. These rules ensure that the data being entered meets certain predefined criteria, reducing the chances of incorrect entries and preventing common errors. For instance, enforcing specific date and number formats or setting constraints on values ensures the data aligns with expected standards from the start.
- Automated Cleaning Tools: Leveraging advanced automated tools significantly enhances the data cleaning process. These tools can identify and correct inconsistencies, handle duplicates, and fill in missing values where possible. Automation accelerates the process and minimizes human error, especially when managing large datasets. Tools like Python's Pandas library, SQL scripts, and data quality platforms are commonly used to streamline this task.
- Regular Data Audits: Regular audits of the data help to maintain long-term accuracy and consistency. By periodically reviewing and validating data, organizations can ensure ongoing data quality. These audits help catch emerging issues before they compound, allowing for timely corrective actions that sustain data integrity throughout the organization.
By addressing these challenges with proactive solutions—such as automated tools, validation rules, and consistent data audits—organizations can overcome the complexities of data cleaning. These efforts not only improve the accuracy and quality of their data but also enhance the reliability of descriptive analytics, providing a solid foundation for effective decision-making and future analysis.
Data Aggregation for Descriptive Analytics
Data aggregation is a crucial component of descriptive analytics, allowing organizations to condense large datasets into meaningful, digestible insights. By summarizing data, this process makes it easier to detect patterns, trends, and correlations that drive informed decision-making.
Purpose and Methods
- Summarization: Aggregation distills vast amounts of data into summary statistics such as totals, averages, and percentages. This simplification provides a clear, high-level overview of complex datasets, helping decision-makers quickly grasp the most critical information.
- Grouping: Data aggregation often involves grouping data by key variables, such as time periods (e.g., daily, monthly, quarterly) or categories (e.g., product lines, customer segments). This enables comparative analysis and helps uncover trends or anomalies that may not be immediately visible in raw data.
- Data Consolidation: The process of combining data from multiple sources is essential for creating a unified dataset. This consolidation enriches the analysis by providing a more comprehensive view, incorporating diverse data points that enhance the accuracy and depth of insights.
Tools for Aggregation
Various tools and platforms facilitate the aggregation process, each offering unique capabilities that cater to different levels of analysis:
- SQL (Structured Query Language): SQL is a powerful tool for aggregating large volumes of data from relational databases. It allows analysts to perform complex calculations, create summary reports, and manipulate data efficiently, making it ideal for detailed data analysis and reporting.
- Excel and Google Sheets: These widely accessible tools offer built-in aggregation functions such as SUM, AVERAGE, and COUNT. While more basic than SQL, they are highly effective for smaller datasets and quick analyses, especially in early stages of data processing.
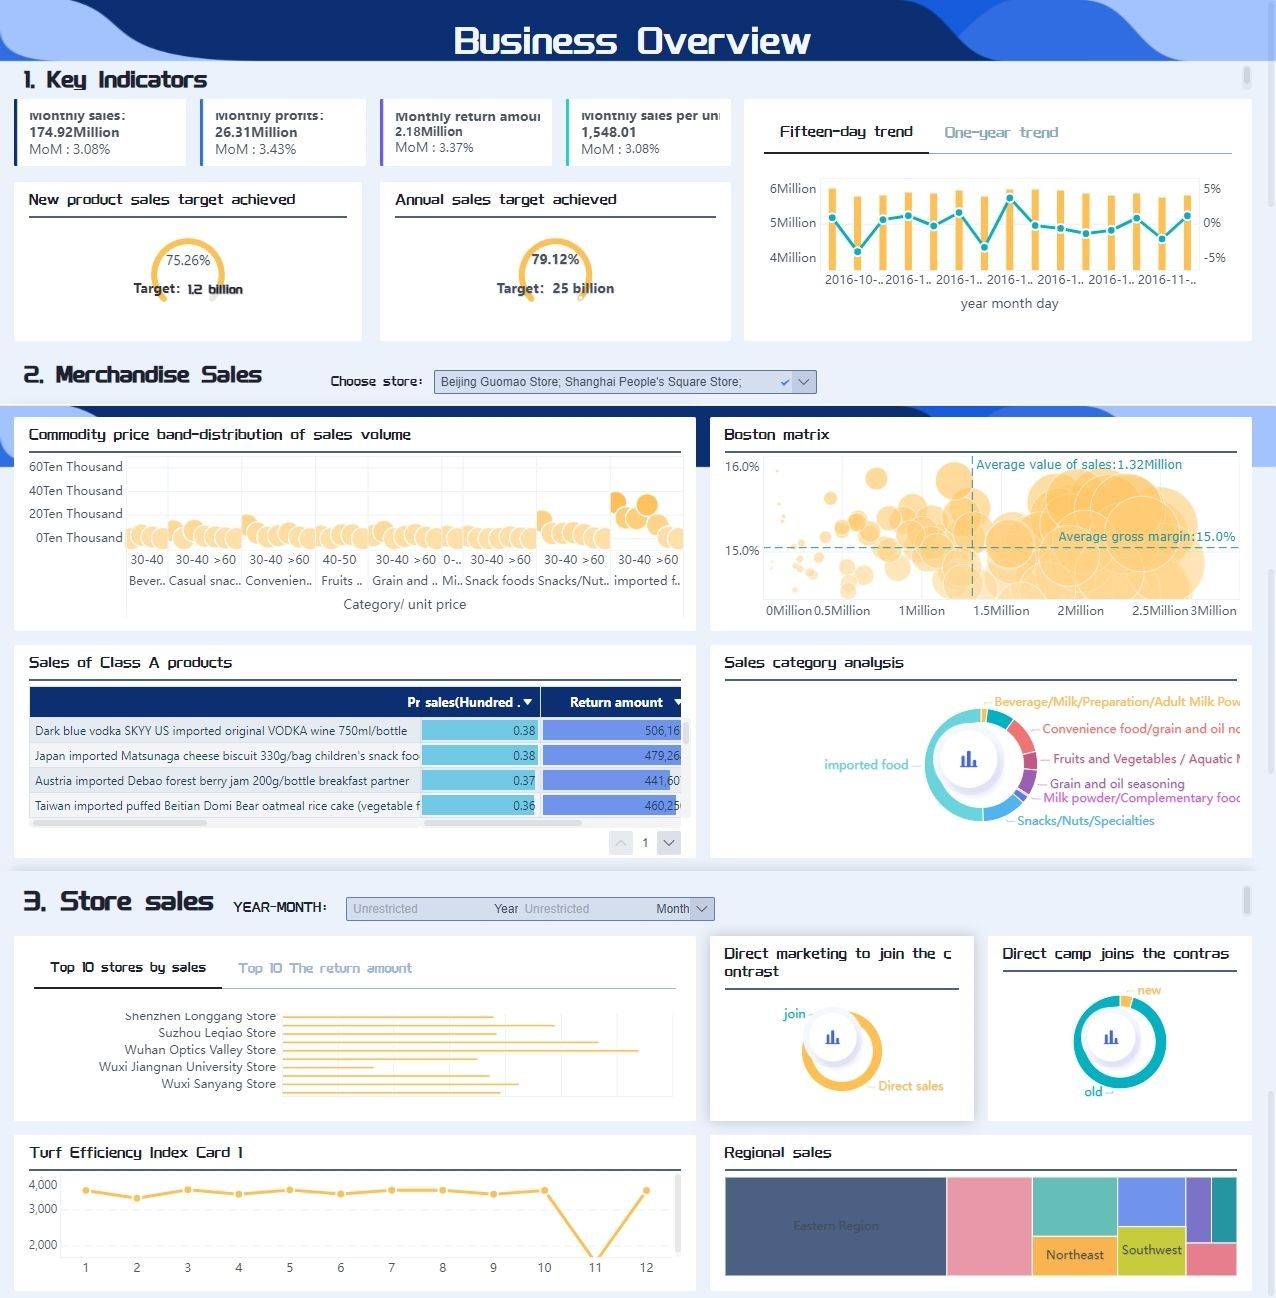
- Business Intelligence Platforms: Advanced tools like FineBI and FineReport provide dynamic data aggregation capabilities, allowing users to create interactive dashboards and real-time visualizations. These platforms not only aggregate data but also offer powerful visualization features that transform raw numbers into intuitive charts and graphs, enabling deeper insights.


Building a Strong Foundation for Analysis
By carefully aggregating data, organizations can transform raw datasets into actionable insights that reveal historical trends and performance metrics. The process ensures that the data is structured, reliable, and ready for further exploration. With clean, consolidated data, businesses can enhance their understanding of past events and leverage this knowledge to guide future strategies and optimize operations.
Applications of Descriptive Analytics
Descriptive analytics serves as a cornerstone in various business applications, offering crucial insights that drive data-driven decision-making and strategic planning. This section delves into how businesses leverage descriptive analytics across different industries, highlighting the capabilities of FanRuan's FineBI and its transformative impact on market research and beyond.
Business Intelligence with FanRuan's FineBI
FineBI, developed by FanRuan Software, is a cutting-edge business intelligence tool designed to unlock the potential of data through advanced analytics and visualization. With its user-friendly interface and powerful analytical features, FineBI empowers organizations to analyze vast datasets, uncover trends, and generate actionable insights. Its versatility makes it a valuable asset across multiple sectors, providing a comprehensive platform for both data discovery and performance optimization.

Use Cases in Various Industries
Retail Sector: FineBI enables retailers to dive deep into sales analytics, track inventory levels in real time, and gain insights into customer preferences. By visualizing sales trends and analyzing customer behavior, retailers can make informed decisions about inventory management and personalize marketing strategies to align with consumer demand. This not only helps in reducing stockouts or overstocking but also improves overall customer satisfaction and profitability.
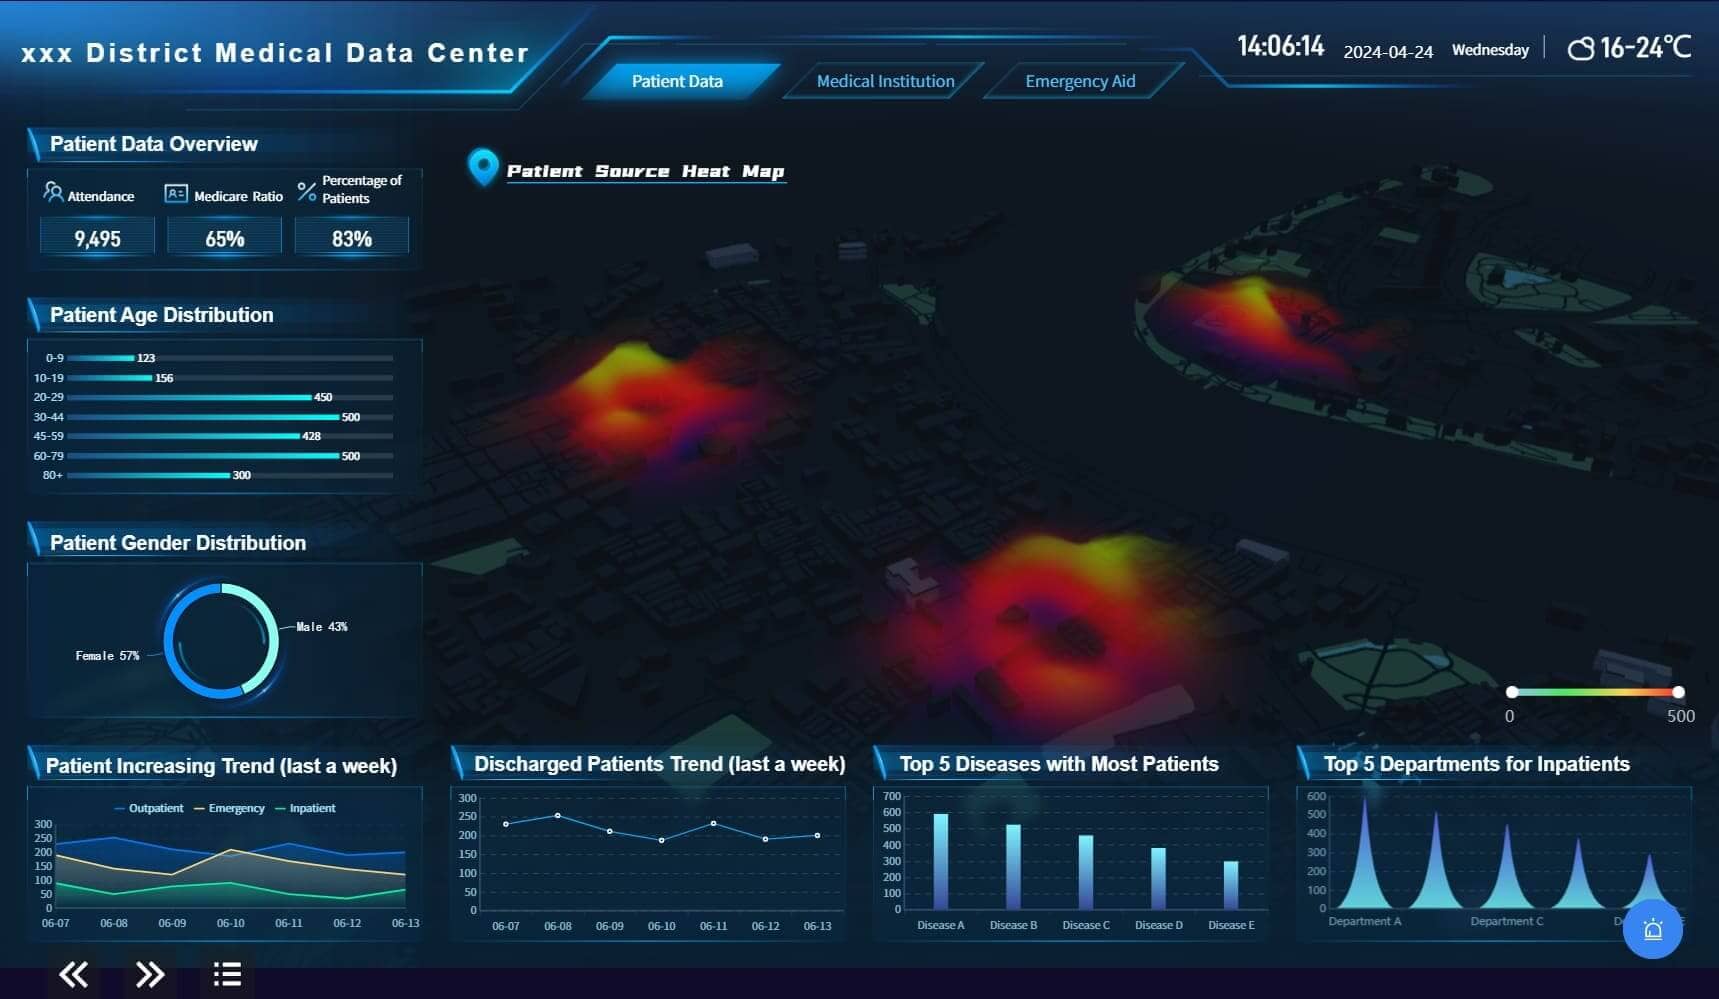
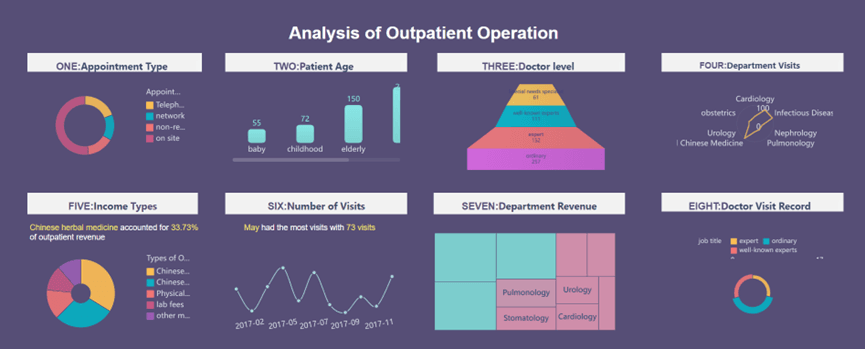
Healthcare: In the healthcare industry, FineBI supports hospitals and medical facilities in monitoring patient data, optimizing resource allocation, and improving service quality. By tracking key performance metrics such as patient outcomes and hospital efficiency, healthcare providers can enhance the quality of care while streamlining operations. FineBI also aids in identifying patterns in patient data that can be used to forecast demand for services, optimize staffing, and improve patient management.
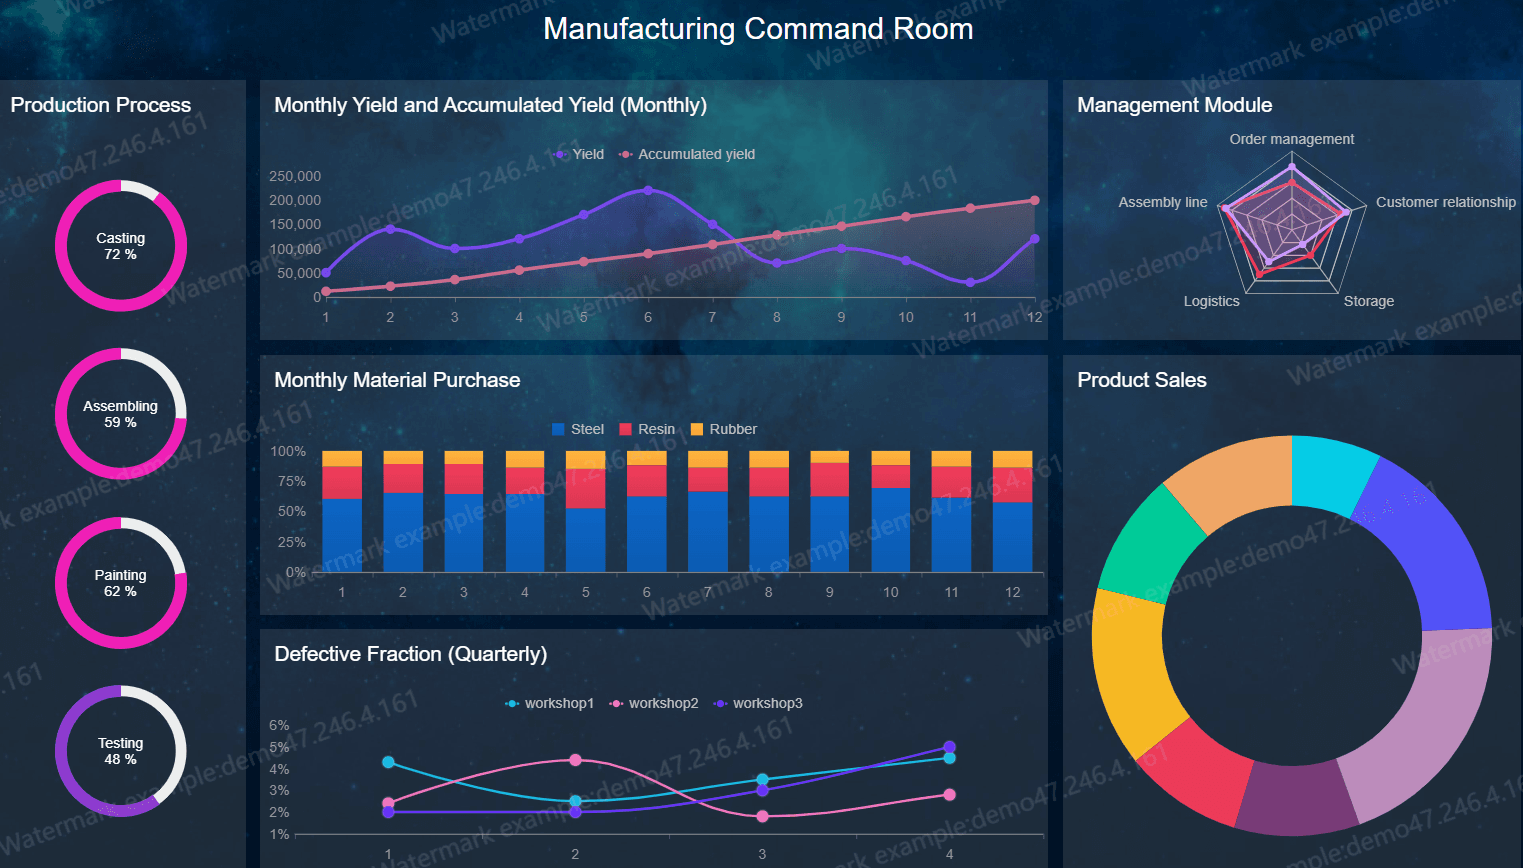
Manufacturing: Manufacturers rely on FineBI to closely monitor production processes, detect inefficiencies, and improve quality control. By analyzing data from various stages of production, manufacturers can identify bottlenecks, reduce waste, and optimize their workflows. This data-driven approach leads to higher productivity, better resource management, and ultimately, improved product quality and cost savings.
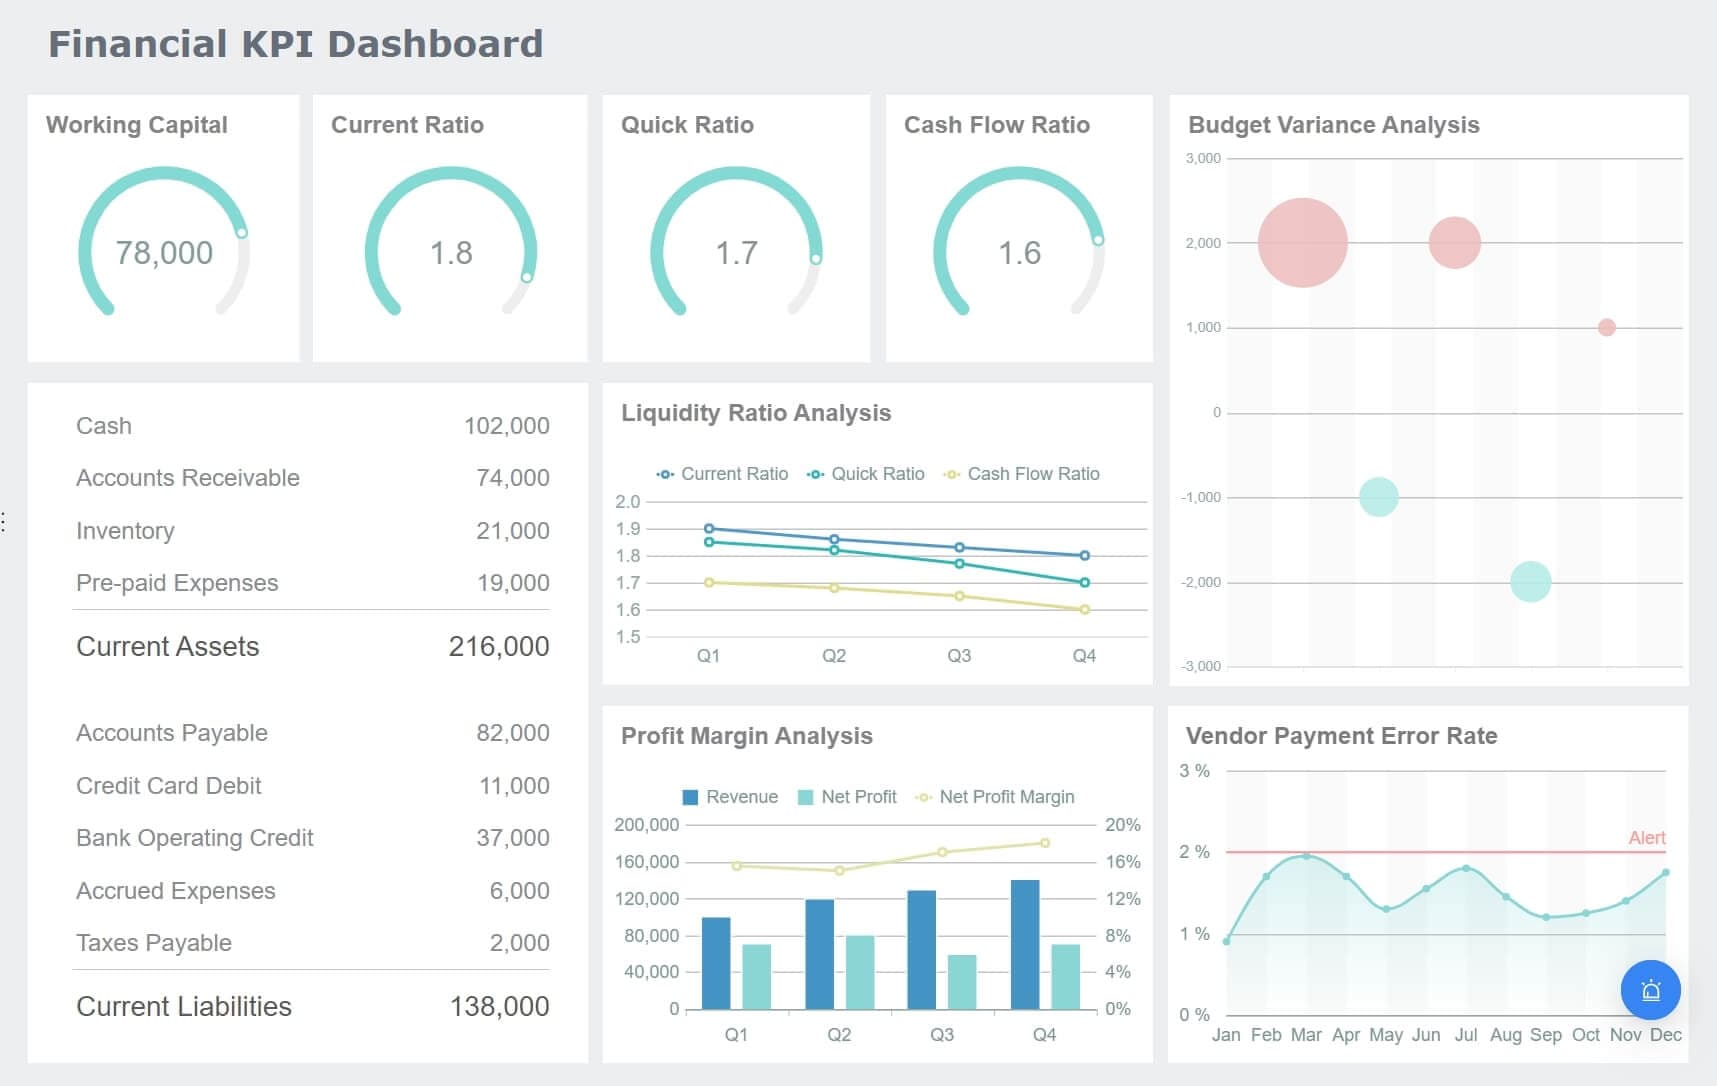
Finance: Financial institutions leverage FineBI for transaction analysis, risk assessment, and regulatory compliance. The platform helps identify fraudulent activities, optimize investment portfolios, and ensure that financial operations adhere to compliance standards. FineBI’s real-time reporting capabilities enable financial analysts to track key metrics like liquidity, risk exposure, and profitability, providing a solid foundation for strategic decision-making and risk management.
In all these sectors, FineBI’s ability to transform raw data into valuable insights empowers businesses to enhance their operations, minimize risk, and improve decision-making. By utilizing descriptive analytics, organizations can unlock the potential hidden within their data, leading to more accurate forecasts, efficient processes, and a competitive edge in the market.
Impact on Decision Making
FineBI has a profound impact on decision-making processes across various industries by transforming how organizations interpret and act on data. With its real-time data visualization and analysis capabilities, FineBI enables decision-makers to access up-to-the-minute insights, allowing them to respond swiftly and accurately to changing circumstances. The platform simplifies complex datasets into intuitive visual formats, making critical information accessible to stakeholders at all levels—from executives to frontline managers.
This accessibility ensures that informed decisions are made with confidence, grounded in clear, data-driven insights. By enhancing both the speed and accuracy of decision-making, FineBI not only improves operational efficiency but also cultivates a data-driven culture within organizations. This shift towards data-centric decision-making empowers businesses to stay competitive, adapt to market trends, and seize opportunities based on robust, actionable intelligence.
Market Research
Descriptive analytics is fundamental to market research, providing businesses with crucial insights into consumer behavior and market dynamics. By leveraging this analytical approach, organizations gain a clearer understanding of their markets, allowing them to make data-backed decisions that drive growth and innovation.
Identifying Trends
Descriptive analytics enables market researchers to uncover emerging trends and patterns. By examining historical sales data, tracking social media interactions, and analyzing consumer feedback, companies can anticipate shifts in market demand. This foresight allows businesses to adapt their strategies proactively, keeping them ahead of competitors and positioning them to capitalize on new opportunities. The ability to spot trends early provides a competitive edge in fast-evolving industries.
Consumer Behavior Analysis
Understanding consumer behavior is key to creating effective marketing strategies. Descriptive analytics offers a deep dive into customer preferences, purchasing habits, and demographic profiles. These insights allow businesses to segment their audiences more precisely, enabling the development of targeted marketing campaigns that resonate with specific customer groups. This tailored approach not only enhances customer engagement but also strengthens brand loyalty, leading to higher retention rates and increased lifetime value.
Role of FineReport and FineBI
FanRuan's tools, FineReport and FineBI, play vital roles in market research applications. FineReport’s flexible report design and extensive visualization options allow businesses to craft detailed, easy-to-interpret reports that communicate insights clearly. Meanwhile, FineBI’s self-service analytics empower users to explore data independently, fostering a culture of data-driven decision-making. These tools collectively enhance the ability of organizations to transform raw data into actionable insights, improving decision-making and enabling more agile, informed strategies.
Comparisons with Other Analytics
Descriptive analytics serves as a foundational tool in data analysis, but it is essential to understand how it compares to other forms of analytics. This section explores the differences and applications of descriptive analytics in relation to predictive and prescriptive analytics.
Descriptive vs. Predictive Analytics
Key Differences
Descriptive analytics focuses on summarizing historical data to provide insights into past events. It answers the question, "What happened?" by using data aggregation and data visualization techniques. In contrast, predictive analytics aims to forecast future outcomes based on historical data patterns. It addresses the question, "What could happen?" by employing statistical models and machine learning algorithms.
- Purpose: Descriptive analytics provides a clear picture of past performance, while predictive analytics anticipates future trends and behaviors.
- Techniques: Descriptive analytics uses data visualization tools like FineReport and FineBI to create reports and dashboards. Predictive analytics relies on advanced algorithms and statistical models to make predictions.
"Predictive analytics is about understanding the future, while descriptive analytics is about understanding the past," says a data science expert.
When to Use Each
Organizations should use descriptive analytics when they need to understand historical performance and identify patterns. It is ideal for generating reports and dashboards that summarize past data. FineReport excels in this area by offering flexible report design and diverse visualization options.
Predictive analytics becomes valuable when businesses want to forecast future trends and make proactive decisions. It is particularly useful in scenarios where anticipating customer behavior or market changes can provide a competitive advantage. FineBI supports predictive analytics by enabling users to explore data trends and patterns, facilitating informed decision-making.
Descriptive vs. Prescriptive Analytics
Comparative Analysis
While descriptive analytics explains what has happened, prescriptive analytics goes a step further by recommending actions based on insights. It answers the question, "What should we do?" by analyzing data to suggest the best course of action.
- Focus: Descriptive analytics centers on past events, whereas prescriptive analytics focuses on future actions.
- Outcome: Descriptive analytics provides insights into historical data, while prescriptive analytics offers actionable recommendations.
"Prescriptive analytics not only predicts future outcomes but also suggests ways to achieve desired results," notes a business strategist.
Practical Applications
Descriptive analytics is widely used in reporting and performance measurement. Businesses leverage tools like FineReport to create detailed reports that communicate insights clearly. FineBI enhances this process by allowing users to independently explore data and generate visual insights.
Prescriptive analytics finds applications in areas where decision-making is critical. It is used in supply chain optimization, resource allocation, and risk management. By analyzing data and recommending actions, prescriptive analytics helps organizations optimize operations and achieve strategic goals.
Examples and Case Studies of Descriptive Analytics
Real-world Examples
Successful Implementations
Descriptive analytics has proven its value in various industries through successful implementations. Netflix, for instance, utilizes descriptive analytics to identify trends in viewer preferences. By analyzing historical viewing data, Netflix determines which TV shows and movies are popular among different demographics. This insight influences their content creation, marketing strategies, and partnerships, ensuring they cater to audience demands effectively.
In the retail sector, companies analyze sales data to understand customer purchasing patterns. This analysis helps optimize inventory management, marketing strategies, and product assortment. Retailers can adjust stock levels based on consumer demand, reducing waste and increasing profitability. FineReport plays a crucial role in this process by providing flexible report design and diverse visualization options, enabling retailers to create detailed reports that communicate insights clearly.
Lessons Learned
From these implementations, businesses have learned the importance of asking clear questions with achievable answers. Descriptive analytics allows organizations to understand website users and evaluate marketing campaign performance. By leveraging tools like FineBI, businesses can independently explore data and generate visual insights, fostering a culture of data-driven decision-making. This approach not only enhances operational efficiency but also improves customer engagement and brand loyalty.
Case Studies
Industry-specific Cases
In the healthcare industry, hospitals use descriptive analytics to monitor patient data and manage resources. By analyzing historical patient outcomes, healthcare providers can improve service delivery and streamline operations. FineBI empowers healthcare professionals to visualize patient data, track key performance indicators, and identify areas for improvement.
The manufacturing sector also benefits from descriptive analytics. Manufacturers monitor production processes to identify bottlenecks and improve quality control. By analyzing operational data, they enhance productivity and reduce waste. FineReport supports this process by offering robust tools for data visualization and reporting, enabling manufacturers to create detailed reports that highlight key insights.
Outcomes and Insights
These industry-specific cases demonstrate the transformative power of descriptive analytics. In healthcare, improved patient outcomes and resource management lead to enhanced service delivery. In manufacturing, increased productivity and reduced waste contribute to operational efficiency. FineBI and FineReport play integral roles in these outcomes by providing user-friendly interfaces for data visualization and reporting. These tools facilitate the transformation of complex datasets into actionable insights, driving business growth and innovation.
Challenges and Limitations of Descriptive Analytics
Descriptive analytics offers valuable insights into historical data, yet it presents several challenges and limitations that organizations must navigate to maximize its effectiveness.
Common Challenges
Data Privacy Concerns
Data privacy remains a significant concern in descriptive analytics. Organizations collect vast amounts of data, often containing sensitive information. Ensuring this data's security and privacy is paramount. Analysts must adhere to strict data protection regulations to prevent unauthorized access and breaches. They must also balance the need for comprehensive analysis with the ethical obligation to protect individual privacy.
Limitations in Scope
Descriptive analytics focuses on summarizing past events, which limits its scope. It does not predict future outcomes or provide reasons for observed patterns. This limitation can hinder organizations from adopting more advanced analytical techniques that offer proactive insights. Descriptive analytics serves as a foundational tool, but relying solely on it may prevent businesses from exploring predictive or prescriptive analytics, which can drive strategic growth.
Overcoming Limitations
Strategies and Solutions
Organizations can overcome the limitations of descriptive analytics by adopting several strategies:
- Data Integration: Combining descriptive analytics with predictive and prescriptive analytics can provide a more comprehensive understanding of data. This integration allows businesses to move beyond understanding past events to predicting future trends and making informed decisions.
- Collaborative Analysis: Encouraging collaborative analysis and peer review can mitigate interpretation bias. By fostering a data-driven culture, organizations promote objectivity and reduce the risk of biased conclusions.
- Ethical Use of Algorithms: Analysts must use algorithms and AI tools responsibly. Understanding these tools' potential limitations and committing to ethical practices ensures fair and accurate data interpretation.

Future Trends
The future of descriptive analytics lies in its integration with more advanced techniques. As technology evolves, organizations will increasingly leverage AI and machine learning to enhance descriptive analytics. These advancements will enable businesses to derive deeper insights from historical data, paving the way for more informed decision-making. Additionally, the focus on data ethics will grow, ensuring that organizations gather and interpret information accurately and fairly.
FAQ of Descriptive Analytics
Descriptive analytics often raises questions among those new to the field. Here are some frequently asked questions that provide clarity and understanding.
1. What is Descriptive Analytics?
Descriptive analytics involves analyzing historical data to understand past events. It summarizes data to identify patterns and trends, offering a clear picture of what has happened. This type of analytics serves as a foundation for more advanced analytics, such as predictive and prescriptive analytics.
2. How Does Descriptive Analytics Work?
Descriptive analytics follows a structured process:
- Metrics Identification: Analysts determine which metrics are relevant to the analysis.
- Data Collection and Aggregation: Data is gathered from various sources and aggregated for a comprehensive view.
- Analysis: The data undergoes analysis to extract meaningful insights.
- Visualization and Presentation: Insights are presented through visualizations, making them easy to interpret.
3. What Are the Advantages of Descriptive Analytics?
Descriptive analytics offers several advantages:
- Historical Perspective: Provides insights into past performance.
- Ease of Understanding: Simplifies complex data, making it accessible.
- Facilitates Decision-Making: Supports data-driven decisions by identifying patterns and trends.
- Performance Evaluation: Helps in evaluating performance against benchmarks.
4. How Is Descriptive Analytics Applied in Business?
Businesses use descriptive analytics to summarize past events and report general trends. It plays a crucial role in areas like market research, where it helps identify connections between variables and trends. By analyzing survey and focus group data, businesses can gain insights into consumer behavior and preferences.
5. What Are Common Applications of Descriptive Analytics?
Descriptive analytics finds applications across various sectors:
- Retail: Analyzing sales data to optimize inventory and marketing strategies.
- Healthcare: Monitoring patient data to improve service delivery.
- Finance: Assessing transaction data for risk management and compliance.
6. What Are the Benefits of Using Descriptive Analytics?
Descriptive analytics provides tangible benefits by asking well-formulated questions with clear, achievable answers. It supports performance evaluation and enhances reporting capabilities, facilitating better communication within and outside the organization.
7. What Tools Support Descriptive Analytics?
Several tools support descriptive analytics:
- FineReport and FineBI: These tools offer robust data visualization and reporting capabilities, empowering users to explore data independently.
- Microsoft Excel and Google Sheets: Provide basic data analysis and visualization features.
- Tableau and Power BI: Offer advanced visualization options for creating interactive dashboards.
Descriptive analytics continues to evolve, offering organizations a solid foundation for understanding past events and driving informed decision-making. As data generation increases, its importance and applications will only grow.
Descriptive analytics serves as a cornerstone in data analysis, offering businesses insights into past performance and operational effectiveness. By summarizing and visualizing data, it enables easy understanding and interpretation, facilitating informed decision-making. As technology advances, the future of descriptive analytics will likely involve integration with predictive and prescriptive analytics, enhancing its value. Businesses can leverage these insights to drive strategic growth and optimize operations. In conclusion, descriptive analytics remains an indispensable tool for organizations aiming to understand historical trends and make data-driven decisions.


The Author
Lewis
Senior Data Analyst at FanRuan
Related Articles

What Is Business Management? A Real-World Guide to Strategy, Operations, Finance, and People
$1 is the discipline of turning goals into results. It connects strategy with execution, money with decisions, and people with performance. Whether a company has 5 employees or 50,000, strong management is what keeps pri
Lewis Chou
Jun 24, 2026

What Recruiters Look for in a Data Analysis Portfolio: 10 Criteria to Score Yours Fast
A $1 is not judged like a school assignment. It is judged like a hiring shortcut. Recruiters, hiring managers, and analytics leads use it to answer one question fast: Can this person solve business problems with data in
Lewis Chou
May 29, 2026

What Is Data Analytics Consulting? Beginner’s Guide to Services, Deliverables, and Business Value
$1 helps organizations turn raw data into decisions they can trust. For many business leaders, the challenge is not a lack of data. It is a lack of clarity. Reports conflict, teams track different KPIs, dashboards are un
Lewis Chou
Jun 03, 2026