In 2025, analytical tools will shape the future of business success. You can use data analysis to predict customer behavior, improve efficiency, and foster innovation. Businesses that embrace data-driven strategies will gain a competitive edge. Real-time analytics will help you respond instantly to market changes, while self-service tools will empower your team to make informed decisions. As global data usage grows, scalable solutions will become essential for thriving in a fast-paced environment. Choosing the right tools ensures your company stays ahead in this data-driven era.
Analytical tools are essential applications that help you process, analyze, and interpret data to make informed decisions. These tools enable you to capture both quantitative and qualitative data from various sources, transforming raw information into actionable insights. Business analytics tools, for instance, allow you to evaluate trends, identify patterns, and predict outcomes, which are critical for improving efficiency and profitability. According to a Deloitte survey, nearly half of businesses credit data analysis for enhancing decision-making, showcasing its importance in modern industries.
In 2025, the role of analytical tools will expand further as businesses increasingly rely on data analytics software to stay competitive. These tools will not only simplify complex data but also empower you to make strategic decisions faster. Whether you are a data practitioner or a business leader, analytical tools will serve as your gateway to unlocking the full potential of your data.
The growing reliance on data analytics highlights the importance of analytical tools in business operations. These tools provide functionalities like statistical analysis, predictive modeling, and data mining, which are indispensable for decision-making. Here’s a quick overview of their significance:
| Analytical Tool Type | Key Features | Importance in Business Operations |
|---|---|---|
| Statistical Tools | Data analysis, trend identification | Helps in making informed decisions |
| Predictive Modeling | Forecasting, trend prediction | Enhances strategic decision-making |
| Data Mining Tools | Pattern recognition, data extraction | Improves efficiency and profitability |
The demand for advanced business analytics tools is rising due to their ability to streamline operations and improve decision-making. For example, data analytics courses now emphasize the use of these tools to prepare data practitioners for real-world challenges. By adopting these tools, you can gain a competitive edge, enhance productivity, and create new opportunities for growth.

The evolution of data analytics is driving the development of more sophisticated analytical tools. Several key trends are shaping this transformation:
| Trend | Description |
|---|---|
| Increased Use of Artificial Intelligence | AI and ML techniques will enable more sophisticated and automated data analysis. |
| Growth of Big Data | Methods must adapt to handle larger datasets more efficiently as data grows in volume and variety. |
| Advancements in Data Privacy Regulations | New methods will be developed to protect individual privacy in data collection and analysis. |
| Rise of Edge Computing | Data analysis will occur closer to data generation, improving speed and reducing transfer costs. |
| Augmented Analytics | Incorporates NLP and automated algorithms, making data analysis more accessible to non-experts. |
These trends highlight the dynamic nature of data analytics and the need for tools that evolve alongside technological advancements. As a data practitioner or business leader, staying updated on these trends will help you leverage the latest innovations in business intelligence solutions.
Website: https://www.fanruan.com/en/finebi
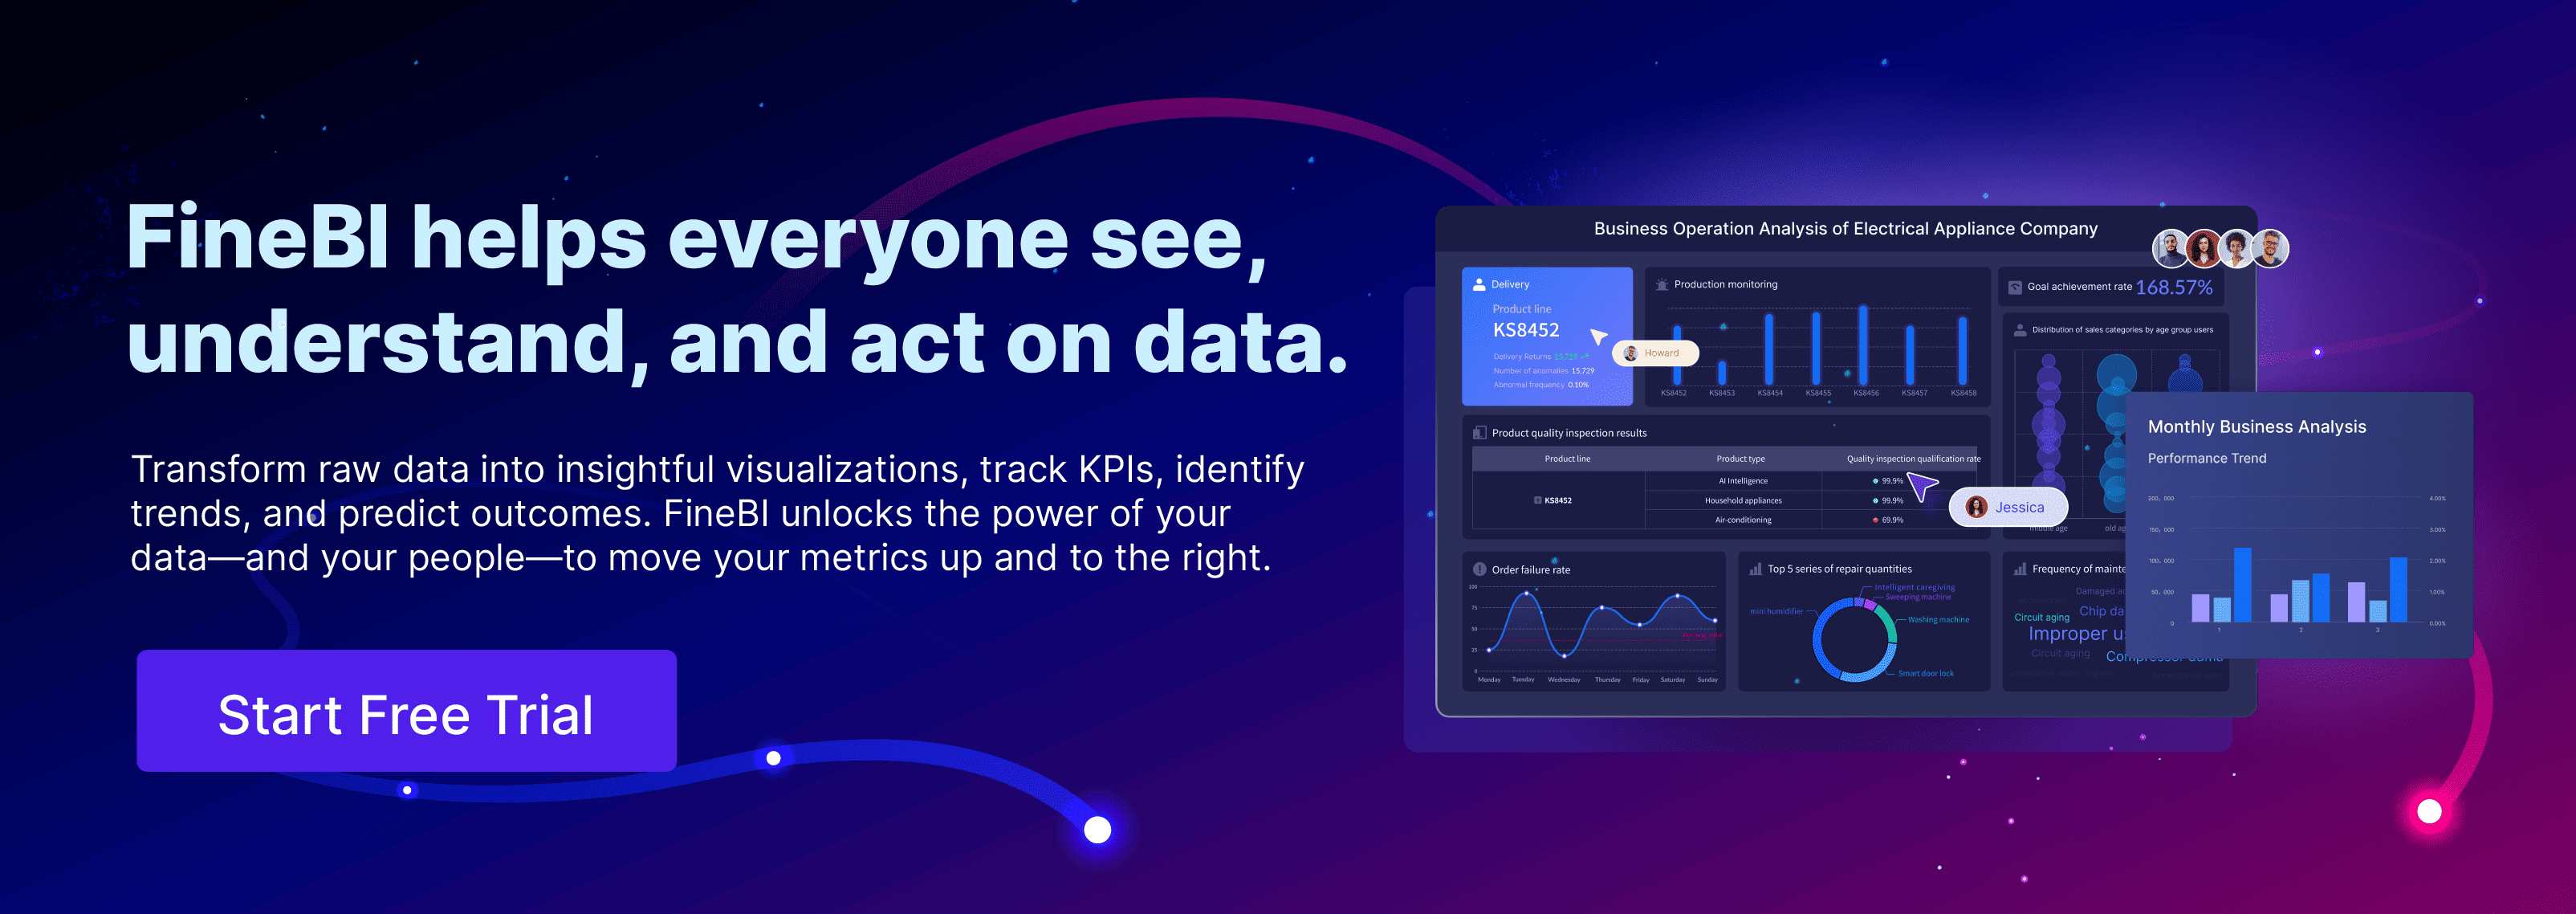
FineBI makes data analysis easy for everyone, even without technical skills. It connects to various data sources like databases, big data platforms, and Excel, offering flexibility. With over 60 chart types, users can create dynamic visualizations tailored to their needs.
Its OLAP analysis feature lets you drill down, filter, and explore data interactively to uncover trends. FineBI’s high-performance engine ensures smooth processing of large datasets, delivering fast results. Real-time updates keep insights current, while role-based access and encryption protect sensitive data.
FineBI’s collaborative tools allow teams to share dashboards and reports easily, promoting data-driven decisions. Whether you’re analyzing trends or making strategic plans, FineBI turns raw data into actionable insights, driving efficiency and growth.
FineBI boosts productivity by enabling teams to analyze data independently, reducing IT dependency. Its real-time analysis ensures decisions are based on the latest data, helping businesses stay agile. With role-based access control, FineBI keeps sensitive information secure while maintaining compliance.
The platform’s collaborative features let teams work together on dashboards, fostering data-driven decision-making. FineBI transforms raw data into actionable insights, helping businesses identify trends, optimize operations, and drive growth. Its high-performance engine handles large datasets efficiently, delivering fast, accurate results.
By integrating seamlessly with various data sources, FineBI offers flexibility and scalability, making it a powerful tool for smarter decisions and long-term success.

Tableau stands out for its robust data visualization capabilities. It offers interactive dashboards that provide a comprehensive view of your business performance. You can access real-time analytics to respond quickly to market changes. Tableau’s self-service analytics empower employees across all levels to analyze data independently. Predictive analytics tools help you identify trends and prepare for future developments. Its cloud-based analytics ensure you can access data anytime, anywhere. Tableau also excels in data governance, prioritizing security and compliance.

Website: https://www.tableau.com/
| Performance Metric | Description |
|---|---|
| Interactive Dashboards | Users can create customized dashboards focusing on crucial metrics, providing an aerial view of performance. |
| Real-time Analytics | Enables businesses to act faster than competitors by organizing data for useful insights. |
| Self-Service Analytics | Empowers all employees to analyze data without needing a data science background. |
| Predictive Analytics | Offers tools to uncover hidden trends and stay ahead of future developments. |
| Cloud-Based Analytics | Provides access to data anytime and anywhere, facilitating real-time insights. |
| Data Governance | Prioritizes data protection and governance in an era of increased data reliance. |
| Data Integration and Transformation | Solves challenges of merging information from various sources into a unified view. |
Tableau helps you visualize complex data effortlessly, making it easier to identify opportunities and challenges. Its real-time analytics give you a competitive edge by enabling faster decision-making. The platform’s predictive analytics tools allow you to anticipate trends and adapt proactively. Tableau’s cloud-based solutions ensure flexibility, letting you work from anywhere. With its focus on data governance, Tableau provides a secure environment for managing your data. These features make Tableau a trusted choice for businesses aiming to excel in data visualization.
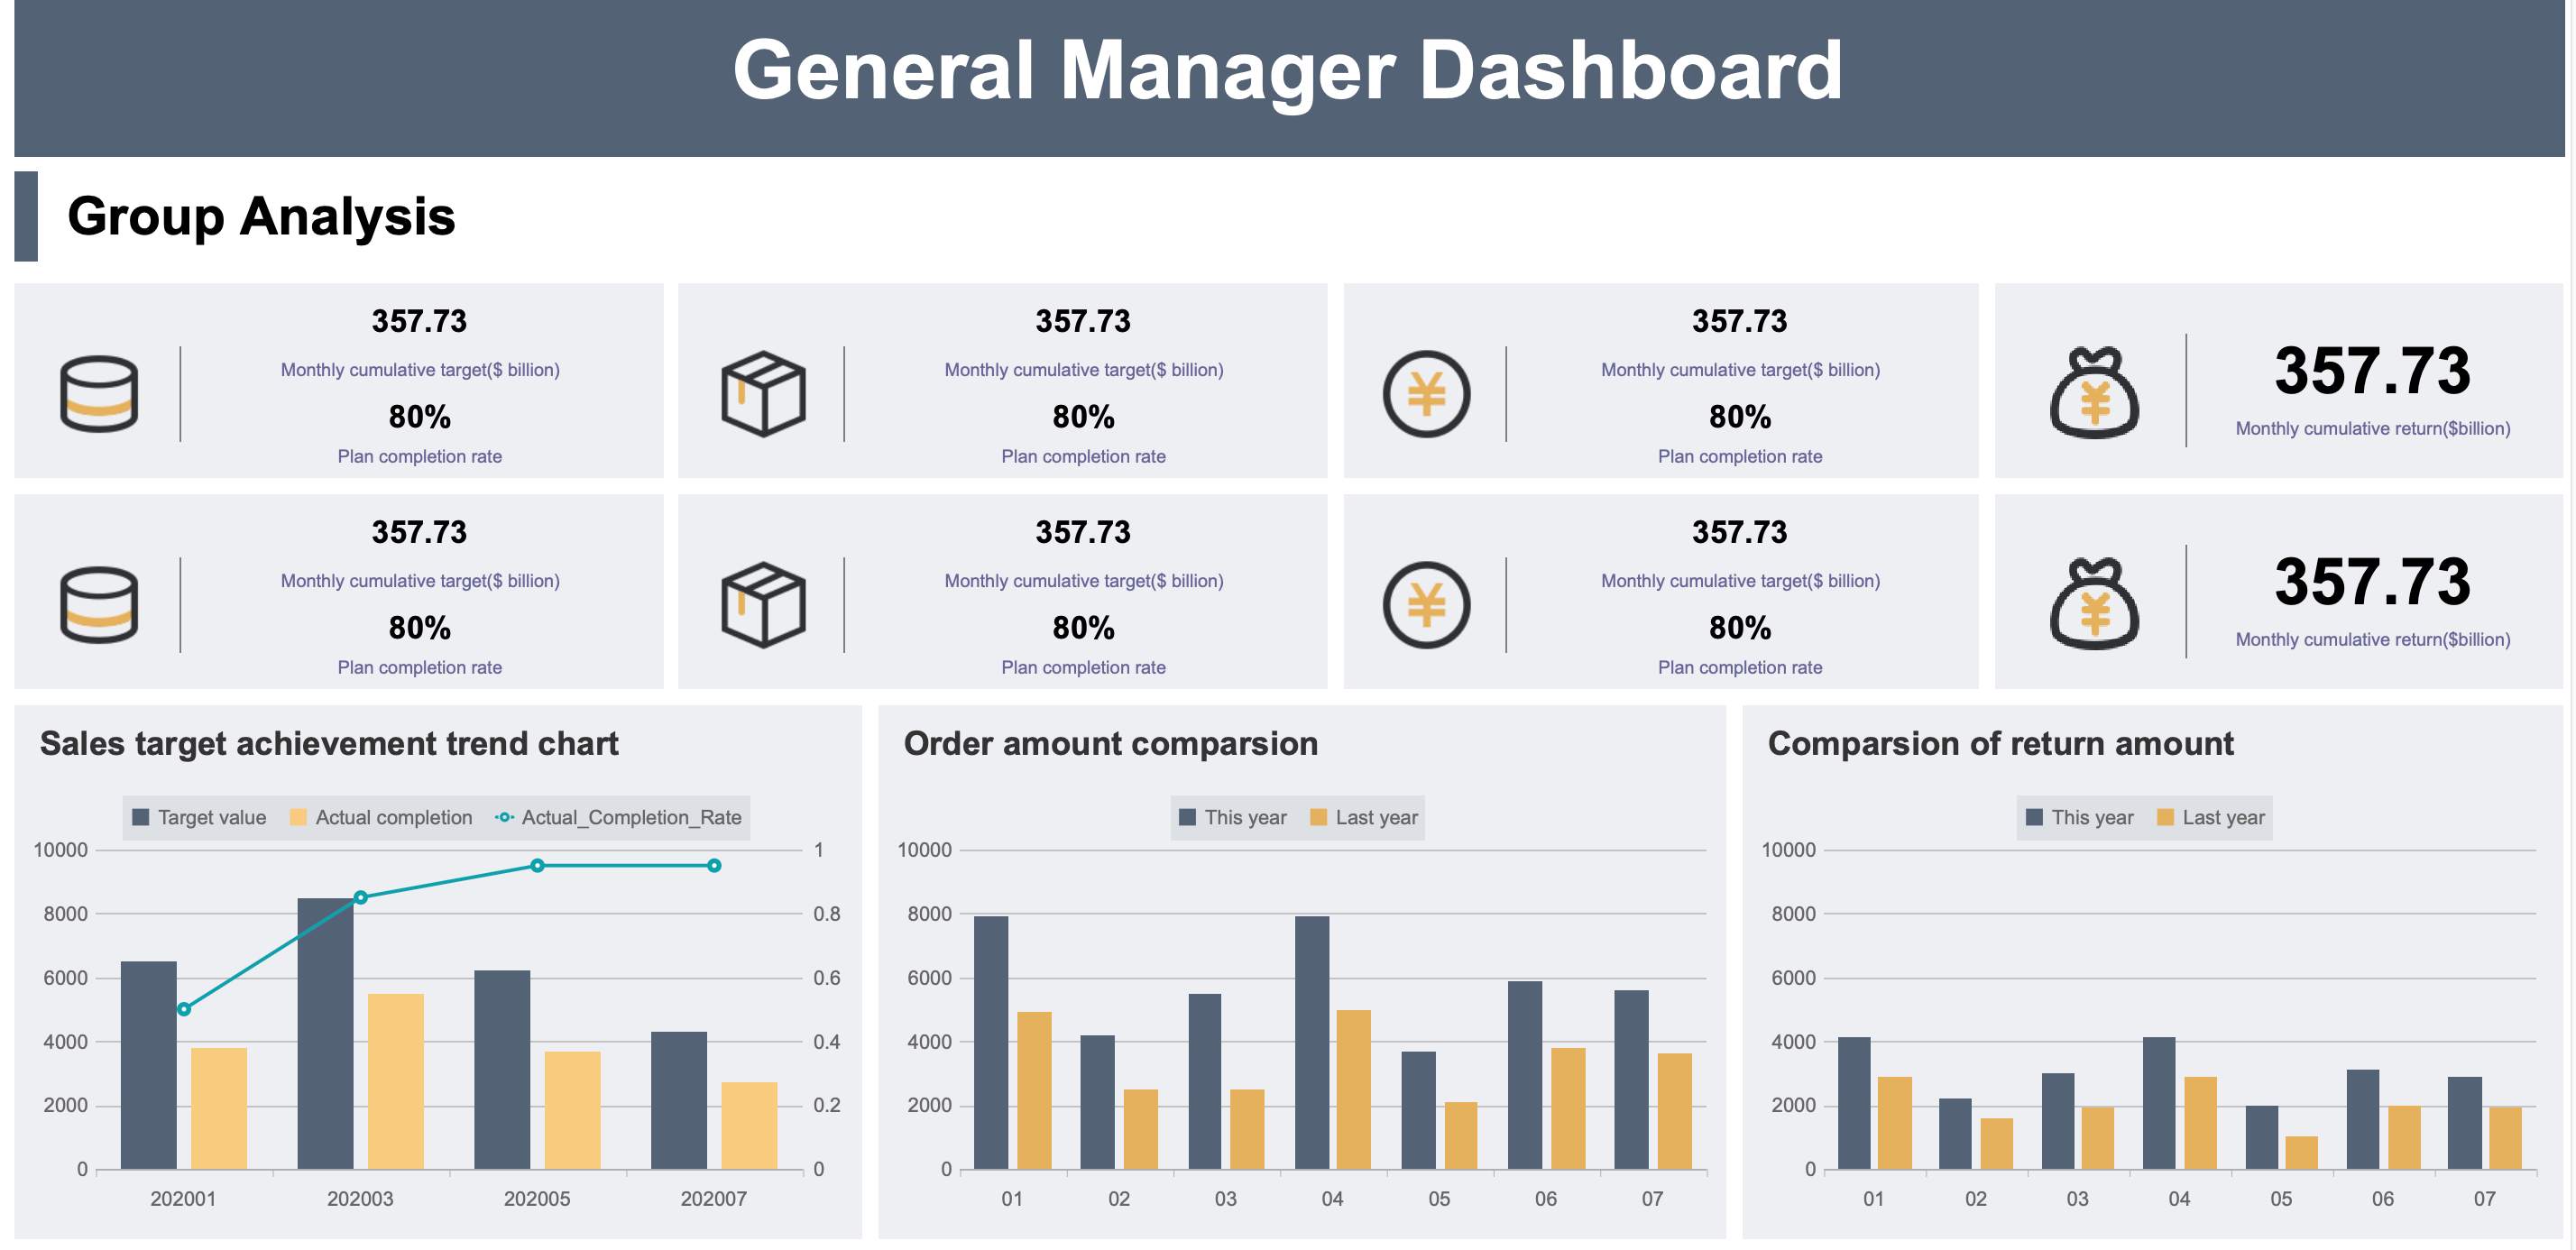
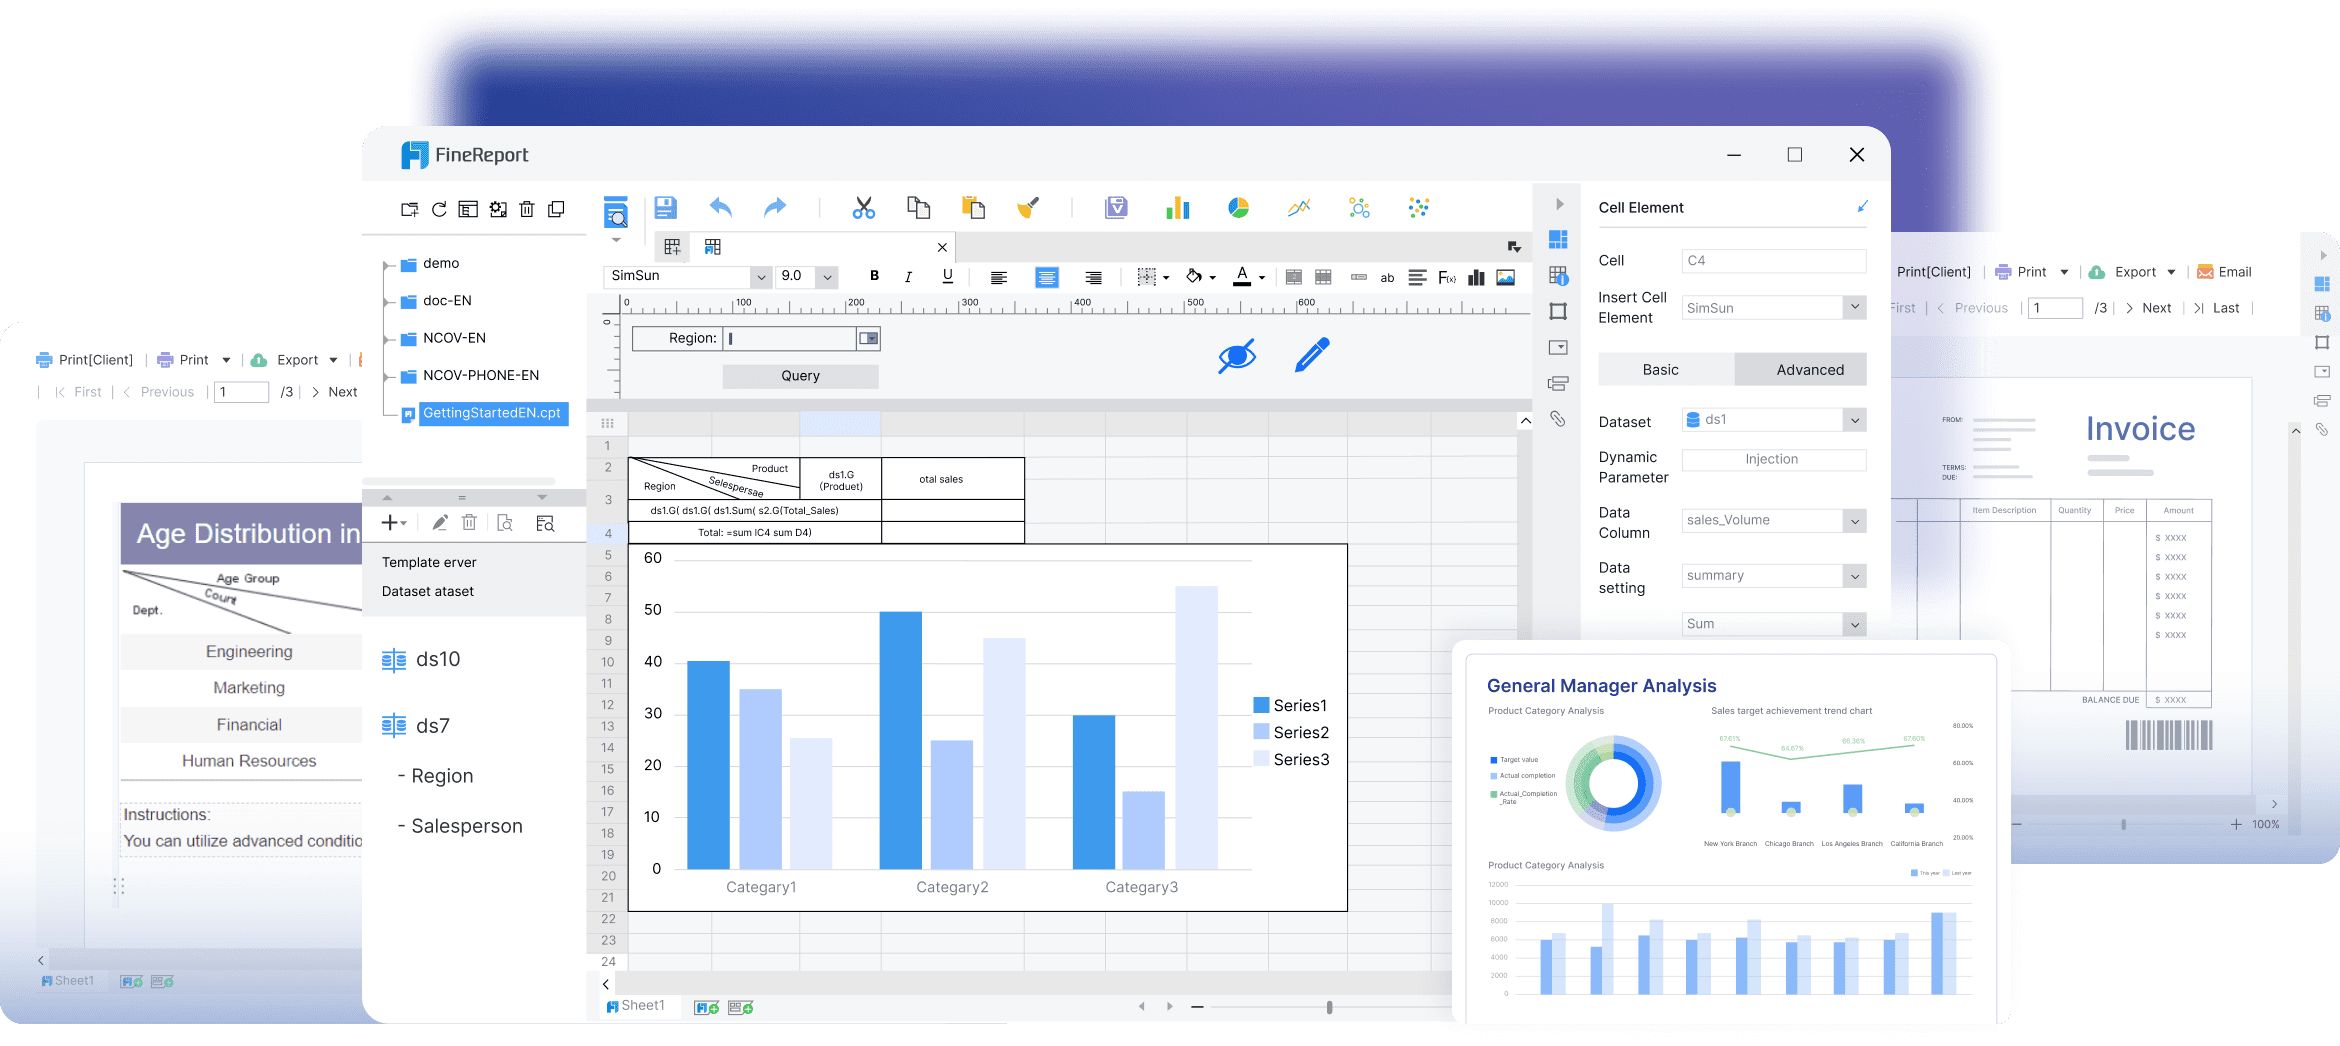
FineReport empowers businesses with tools to create dynamic, interactive visualizations. It offers over 60 chart types, including advanced options like Sankey diagrams and 3D visuals, making complex data easy to understand. The drag-and-drop interface allows anyone to design dashboards and reports without coding.
Website: https://www.fanruan.com/en/finereport
You can try it out in the FineReport demo model below:
With real-time analytics, FineReport ensures you always have the latest insights for quick decision-making. Its adaptive design works seamlessly across devices, from smartphones to large screens, for on-the-go access. Tailored solutions for industries like healthcare, logistics, and finance address specific needs and improve efficiency.
FineReport integrates with systems like ERP and CRM, automates tasks, and ensures data security with role-based access. Whether for detailed reports or interactive dashboards, FineReport helps businesses unlock data’s full potential and drive growth.
FineReport simplifies complex data into actionable insights, helping businesses make faster, smarter decisions. Its user-friendly, zero-code interface makes it accessible to everyone, regardless of technical expertise. With real-time analytics, businesses can stay ahead by gaining immediate insights and adapting quickly to changes.
The platform’s adaptive design ensures seamless access to dashboards and reports on any device, enabling on-the-go monitoring. FineReport offers industry-specific solutions, enhancing efficiency in sectors like finance, healthcare, and retail. Its dynamic dashboards and pixel-perfect reports present data clearly and effectively.
FineReport saves time by automating tasks and integrating data seamlessly, while advanced security features like role-based access protect sensitive information. By streamlining workflows and improving collaboration, FineReport helps businesses unlock the full potential of their data, driving growth and innovation in a data-driven world.
Microsoft Power BI offers a wide range of features that make it a standout tool for business intelligence. Its seamless integration with Microsoft applications like Excel and Teams ensures a smooth workflow. You can connect to various data sources, enabling you to consolidate information into a single platform. The tool supports automatic data refresh, providing real-time updates for accurate decision-making.

Website: https://www.microsoft.com/en-us/power-platform/products/power-bi
Power BI allows you to create custom dashboards and reports tailored to your business needs. Its built-in AI capabilities help detect trends and uncover insights that might otherwise go unnoticed. The mobile app ensures you can access dashboards on the go, making it easier to stay informed. Additionally, Power BI’s flexibility in handling large datasets, enhanced by Microsoft Fabric, makes it suitable for businesses of all sizes.

Key features include:
Microsoft Power BI empowers businesses to make data-driven decisions with ease. Its user-friendly interface allows non-technical users to visualize data and share insights effortlessly. By acting as a central hub for analytics workflows, Power BI bridges data silos and fosters collaboration across teams.
The tool’s real-time data updates ensure you always work with the latest information, helping you respond quickly to market changes. Its advanced data visualization capabilities make complex data easier to understand, enabling you to identify opportunities and challenges effectively. With mobile accessibility, you can monitor performance and make decisions from anywhere.
Power BI’s AI features enhance your ability to predict trends and optimize strategies. Whether you need basic data manipulation or advanced machine learning applications, the platform adapts to your requirements. Its integration with Microsoft Fabric ensures scalability, making it a reliable choice for growing businesses.
By using Microsoft Power BI, you can streamline operations, improve productivity, and gain a competitive edge in your industry. The tool’s comprehensive features and benefits make it an essential asset for businesses aiming to thrive in a data-driven world.

DataRobot simplifies machine learning by automating complex processes, making it accessible to users without extensive technical expertise. Its platform supports end-to-end machine learning workflows, from data preparation to model deployment. You can leverage its advanced analytics capabilities to build, test, and deploy models faster than traditional methods. DataRobot also integrates seamlessly with various business analytics software, ensuring compatibility with your existing tools. Its scalability allows you to handle large datasets efficiently, making it suitable for businesses of all sizes.
Website: https://www.datarobot.com/
DataRobot offers several advantages that can transform your business operations:
| Benefit | Description |
|---|---|
| Cost reduction | Reduces operational expenses through automation and efficient resource use. |
| Platform stability | Ensures high availability with global cluster management. |
| Reducing work delays | Minimizes delays with strategic deployment in key regions. |
| Flexibility in implementation | Adapts to diverse customer needs with Azure and GCP integration. |
| Simplifying platform management | Streamlines operations by consolidating services. |

TensorFlow stands out as one of the most popular machine learning frameworks globally. Its flexibility supports a wide range of tasks, from research to production. You can deploy models across mobile, web, and server environments, thanks to its cross-platform compatibility. TensorFlow Lite enables real-time applications on mobile devices, making it ideal for on-the-go analytics. Recent updates focus on improving user experience, especially for mobile and embedded applications. These features make TensorFlow a versatile tool for businesses seeking advanced analytics capabilities.
Website: https://www.tensorflow.org/
TensorFlow empowers your business with tools to tackle complex AI challenges. Its widespread adoption ensures a robust community for support and innovation. The framework’s cross-platform compatibility allows seamless integration into your existing systems. TensorFlow Lite enhances mobile applications, enabling real-time insights wherever you need them. By using TensorFlow, you can optimize processes, improve decision-making, and stay competitive in a rapidly evolving market.
FineChatBI revolutionizes data analysis by combining conversational AI with business analytics software. Its Text2DSL technology translates natural language queries into structured data queries, ensuring accurate results. The platform integrates rule-based and large models to handle both simple and complex queries. You can generate comprehensive analysis reports and action recommendations through its anomaly detection and attribution analysis features. FineChatBI also supports multi-turn Q&A, maintaining context for seamless interactions.
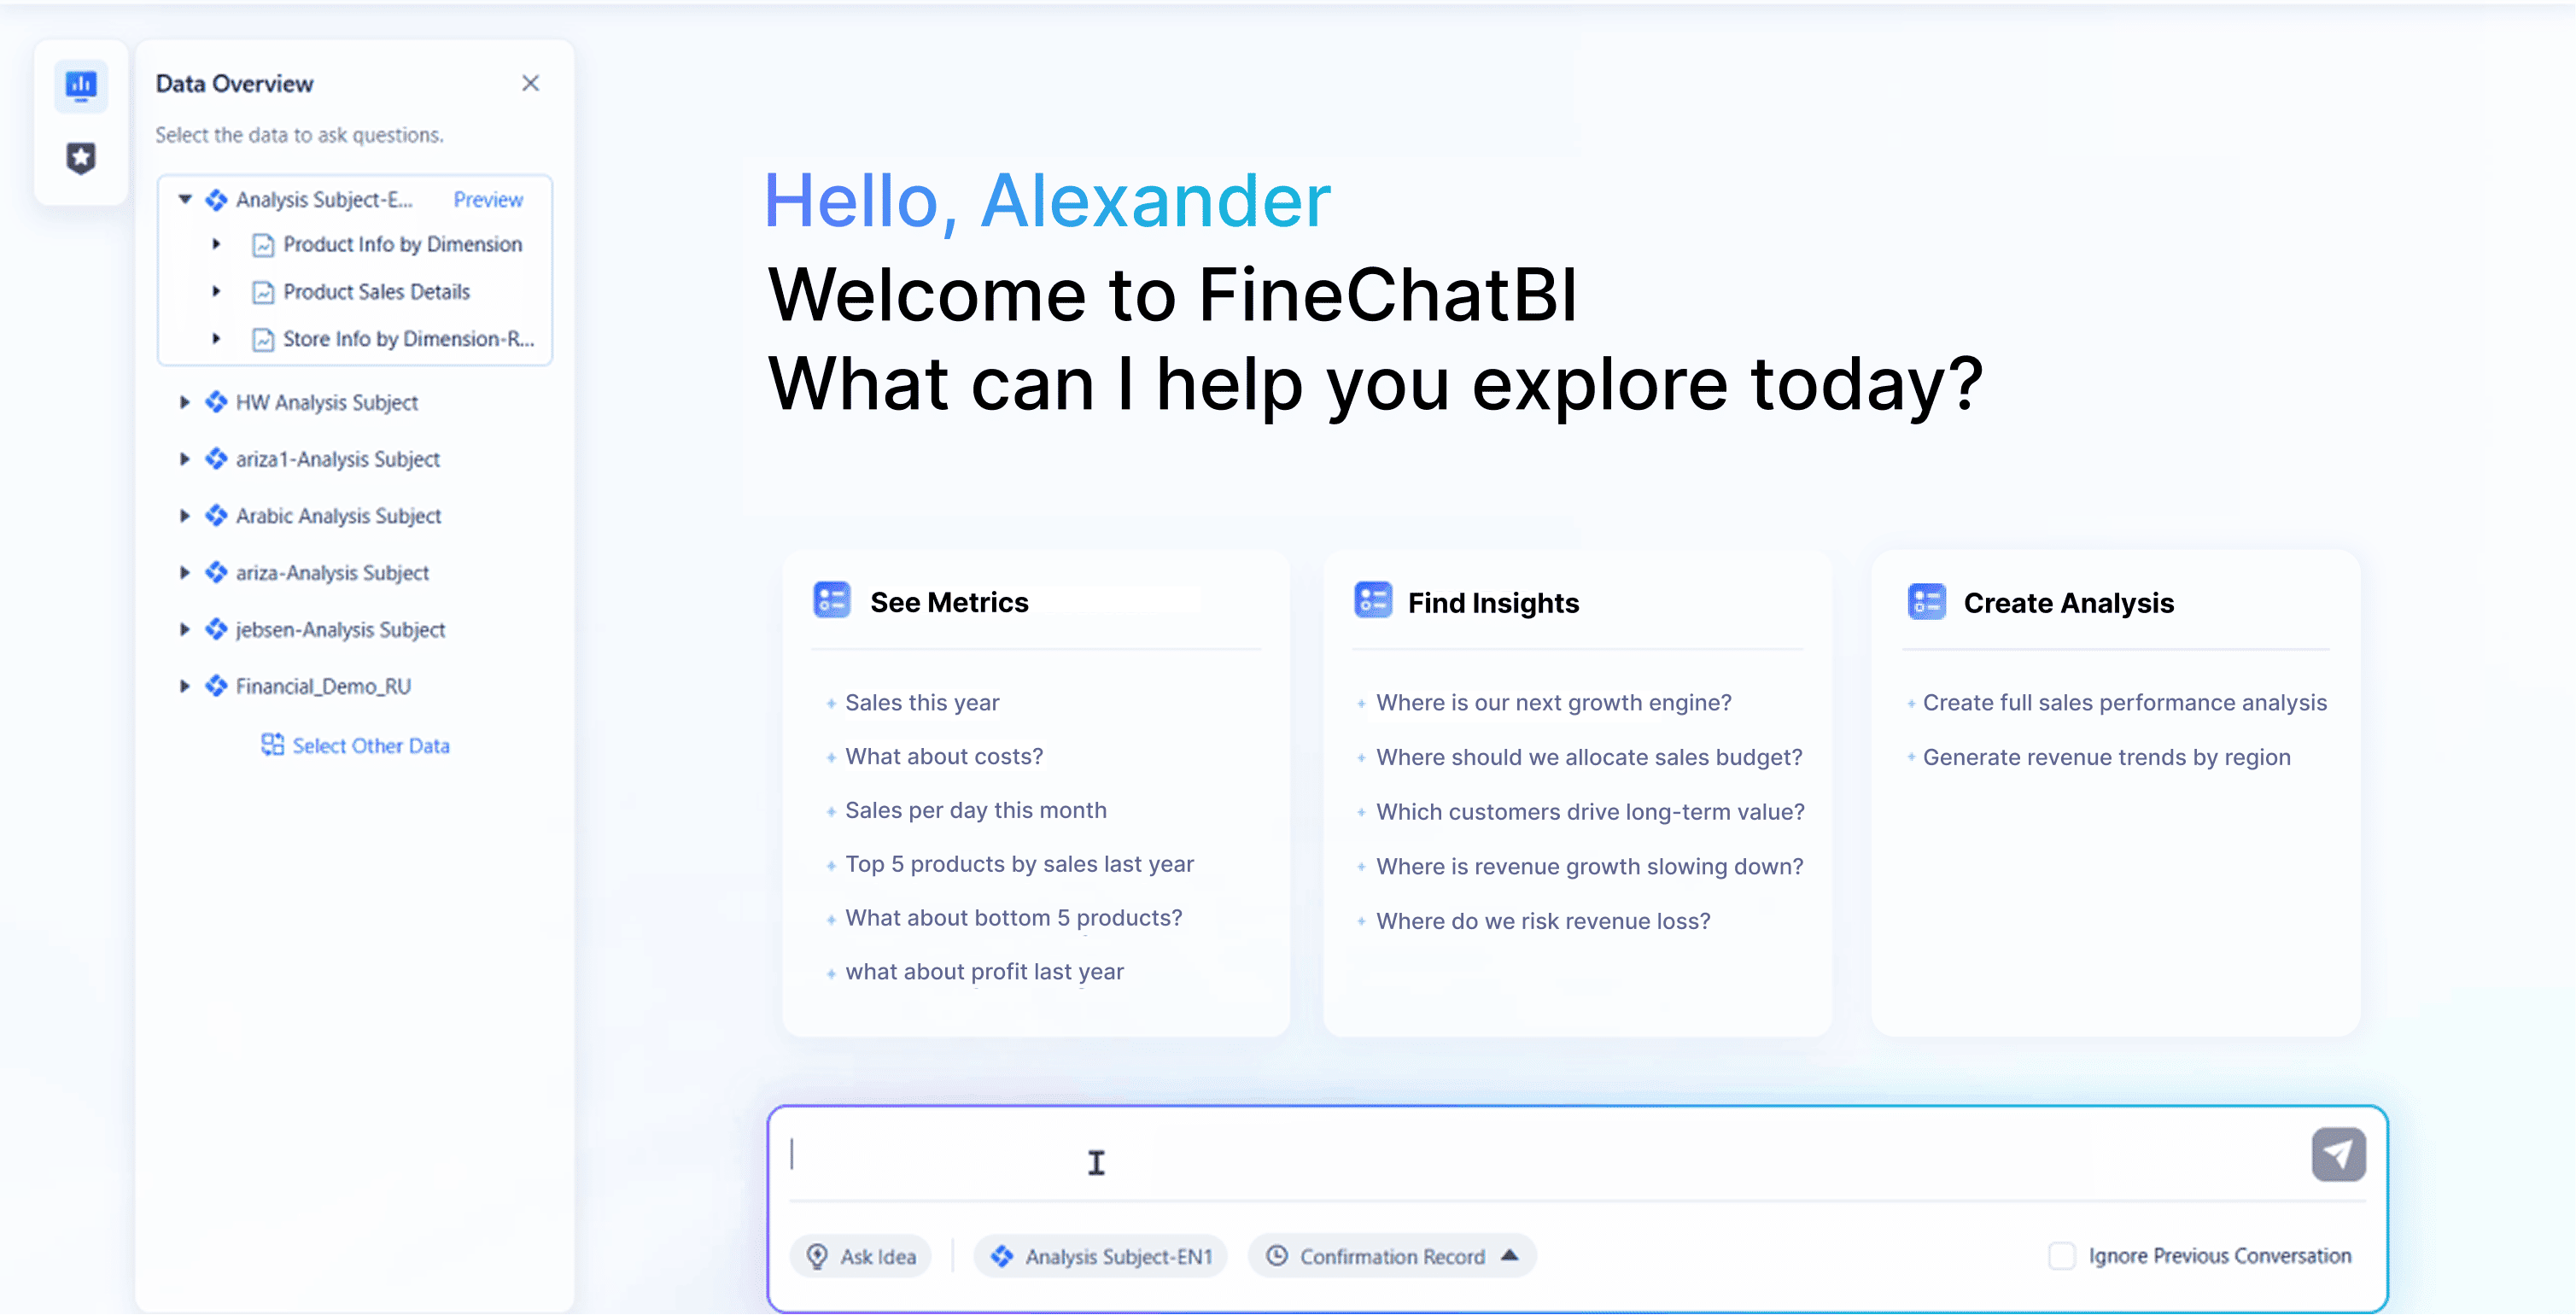
Website: https://www.fanruan.com/en/finechatbi
FineChatBI provides a transparent and trustworthy data analysis experience. Its Text2DSL technology ensures you can verify query accuracy, fostering confidence in the results. The combination of rule-based and large models delivers precision and credibility. FineChatBI guides you through a complete analysis loop, from descriptive to prescriptive insights. This tool enhances decision-making by providing actionable recommendations, making it an invaluable asset for businesses aiming to leverage advanced analytics capabilities.
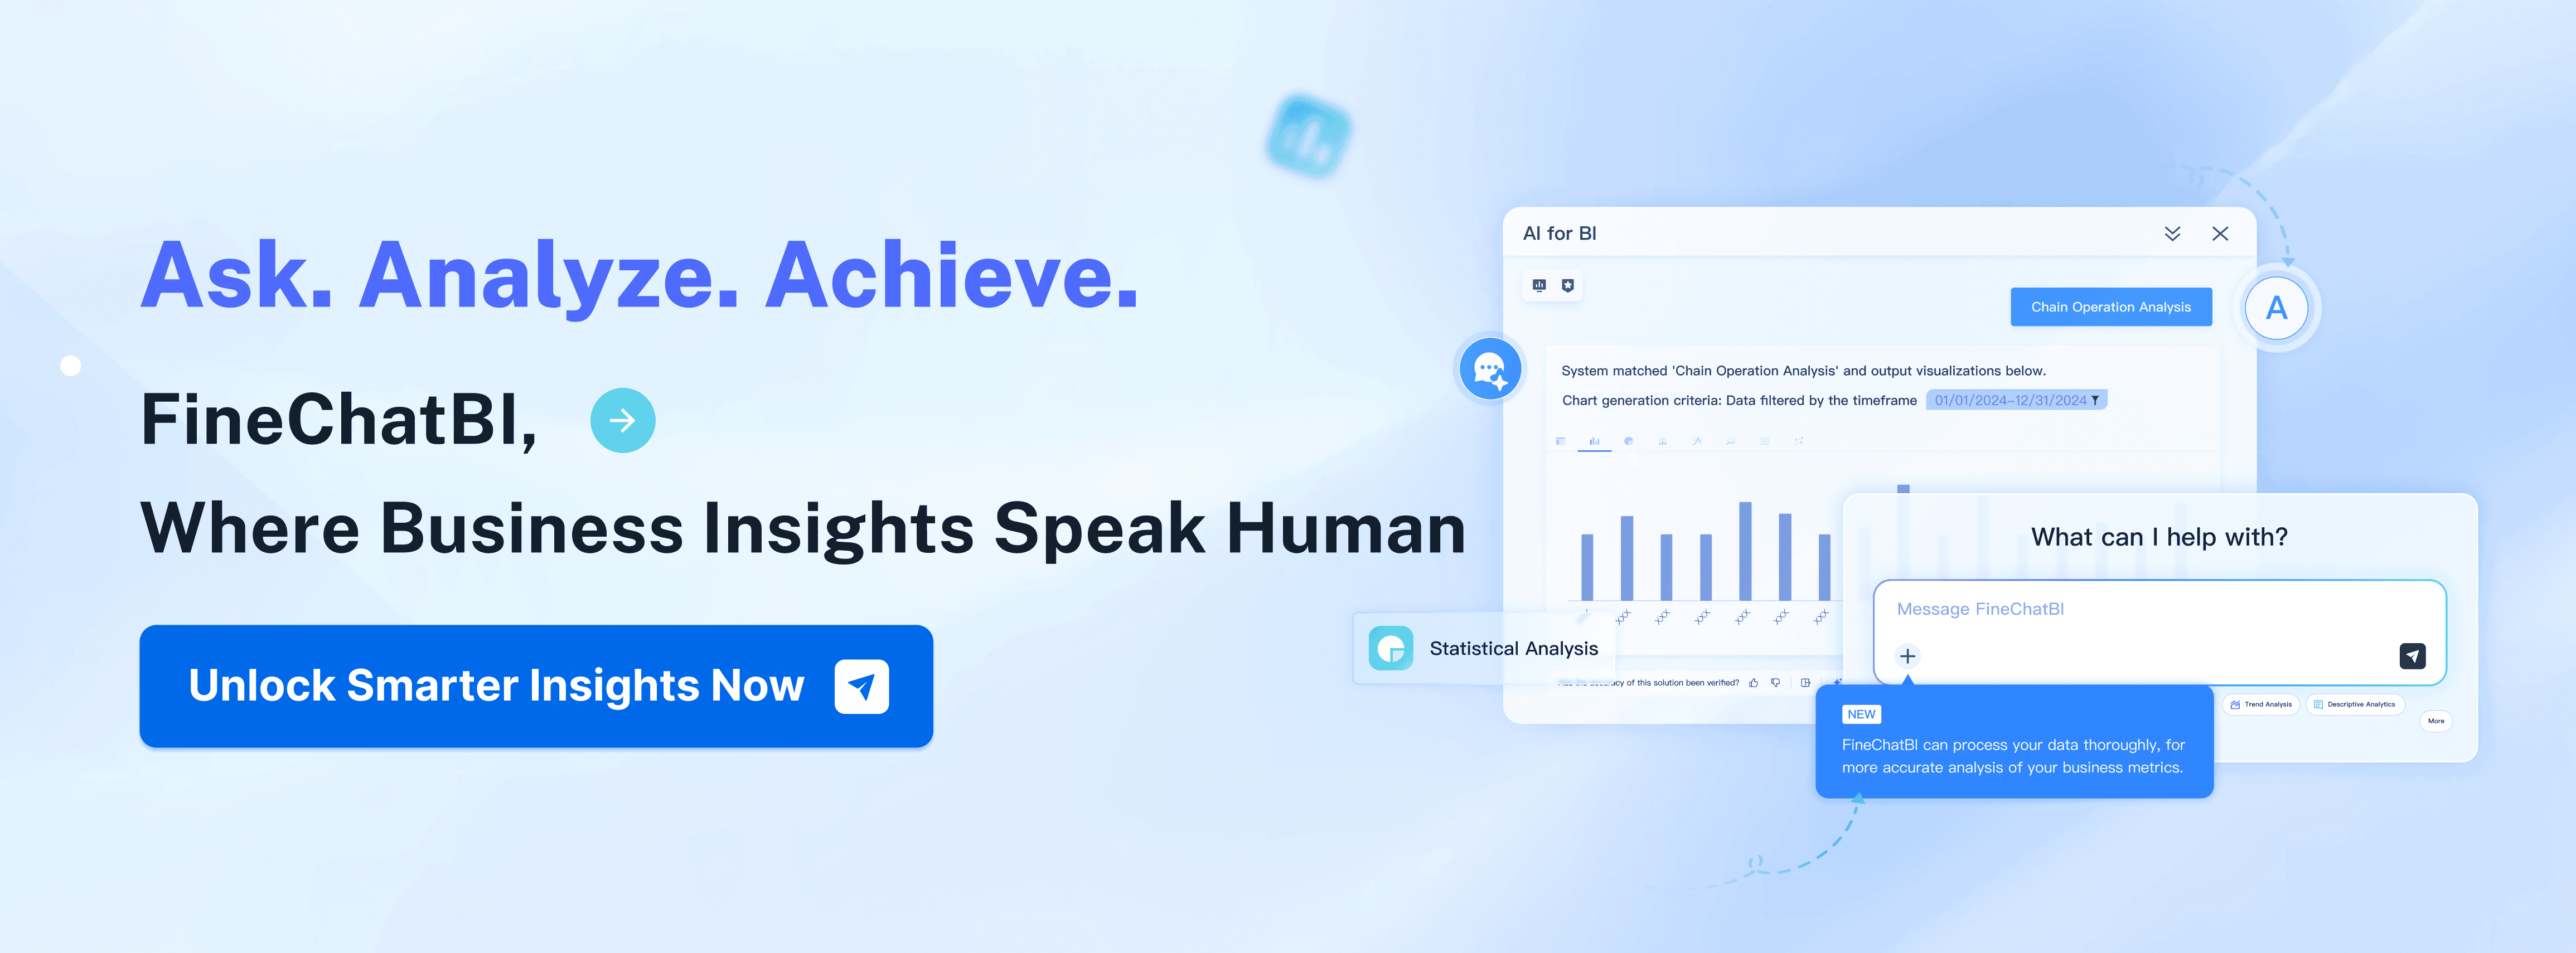
FineChatBI’s conversational approach simplifies complex data analysis, empowering you to make informed decisions quickly.
PyTorch stands out as a versatile machine learning framework, offering features that simplify complex tasks. Its dynamic graphing capability allows you to modify computational graphs in real time. This flexibility makes debugging and customizing models much easier. You can experiment with different approaches without being restricted by static graphs.
Website: https://pytorch.org/
PyTorch integrates seamlessly with the Python ecosystem, leveraging popular libraries like NumPy and SciPy. This compatibility ensures a smooth workflow, especially if you already use Python for other tasks. The framework also supports a define-by-run approach, enabling you to make real-time changes during model development. This feature provides immediate feedback, which is invaluable for rapid prototyping and experimentation.
Another key strength is PyTorch’s growing community and resources. You gain access to extensive documentation, tutorials, and forums. This strong support network helps you troubleshoot issues and stay updated with the latest advancements.
| Feature | Benefit |
|---|---|
| Dynamic Graphing | Easier debugging and model customization. |
| Integration with Python Ecosystem | Leverages Python libraries for a smooth workflow. |
| Growing Community and Resources | Strong community support and extensive documentation. |
PyTorch offers several advantages that can transform how your business approaches machine learning. Its user-friendly design makes it ideal for experimenting with models. You can quickly test ideas and refine them based on immediate results. This agility helps you stay ahead in a competitive market.
The framework’s flexibility supports a wide range of applications, from natural language processing to computer vision. Whether you need to analyze customer sentiment or automate quality control, PyTorch adapts to your needs. Its dynamic graphing feature ensures you can customize models to fit specific business requirements.
PyTorch’s integration with Python simplifies workflows, especially if your team already uses Python-based tools. This compatibility reduces the learning curve, allowing you to implement solutions faster. Additionally, the strong community backing ensures you have access to resources and support whenever challenges arise.
💡 Tip: Use PyTorch’s dynamic graphing to fine-tune models for unique business challenges. This feature can save time and improve accuracy.
By adopting PyTorch, you can enhance your machine learning capabilities and drive innovation. Its flexibility, ease of use, and robust support system make it a valuable tool for businesses aiming to leverage AI effectively in 2025.

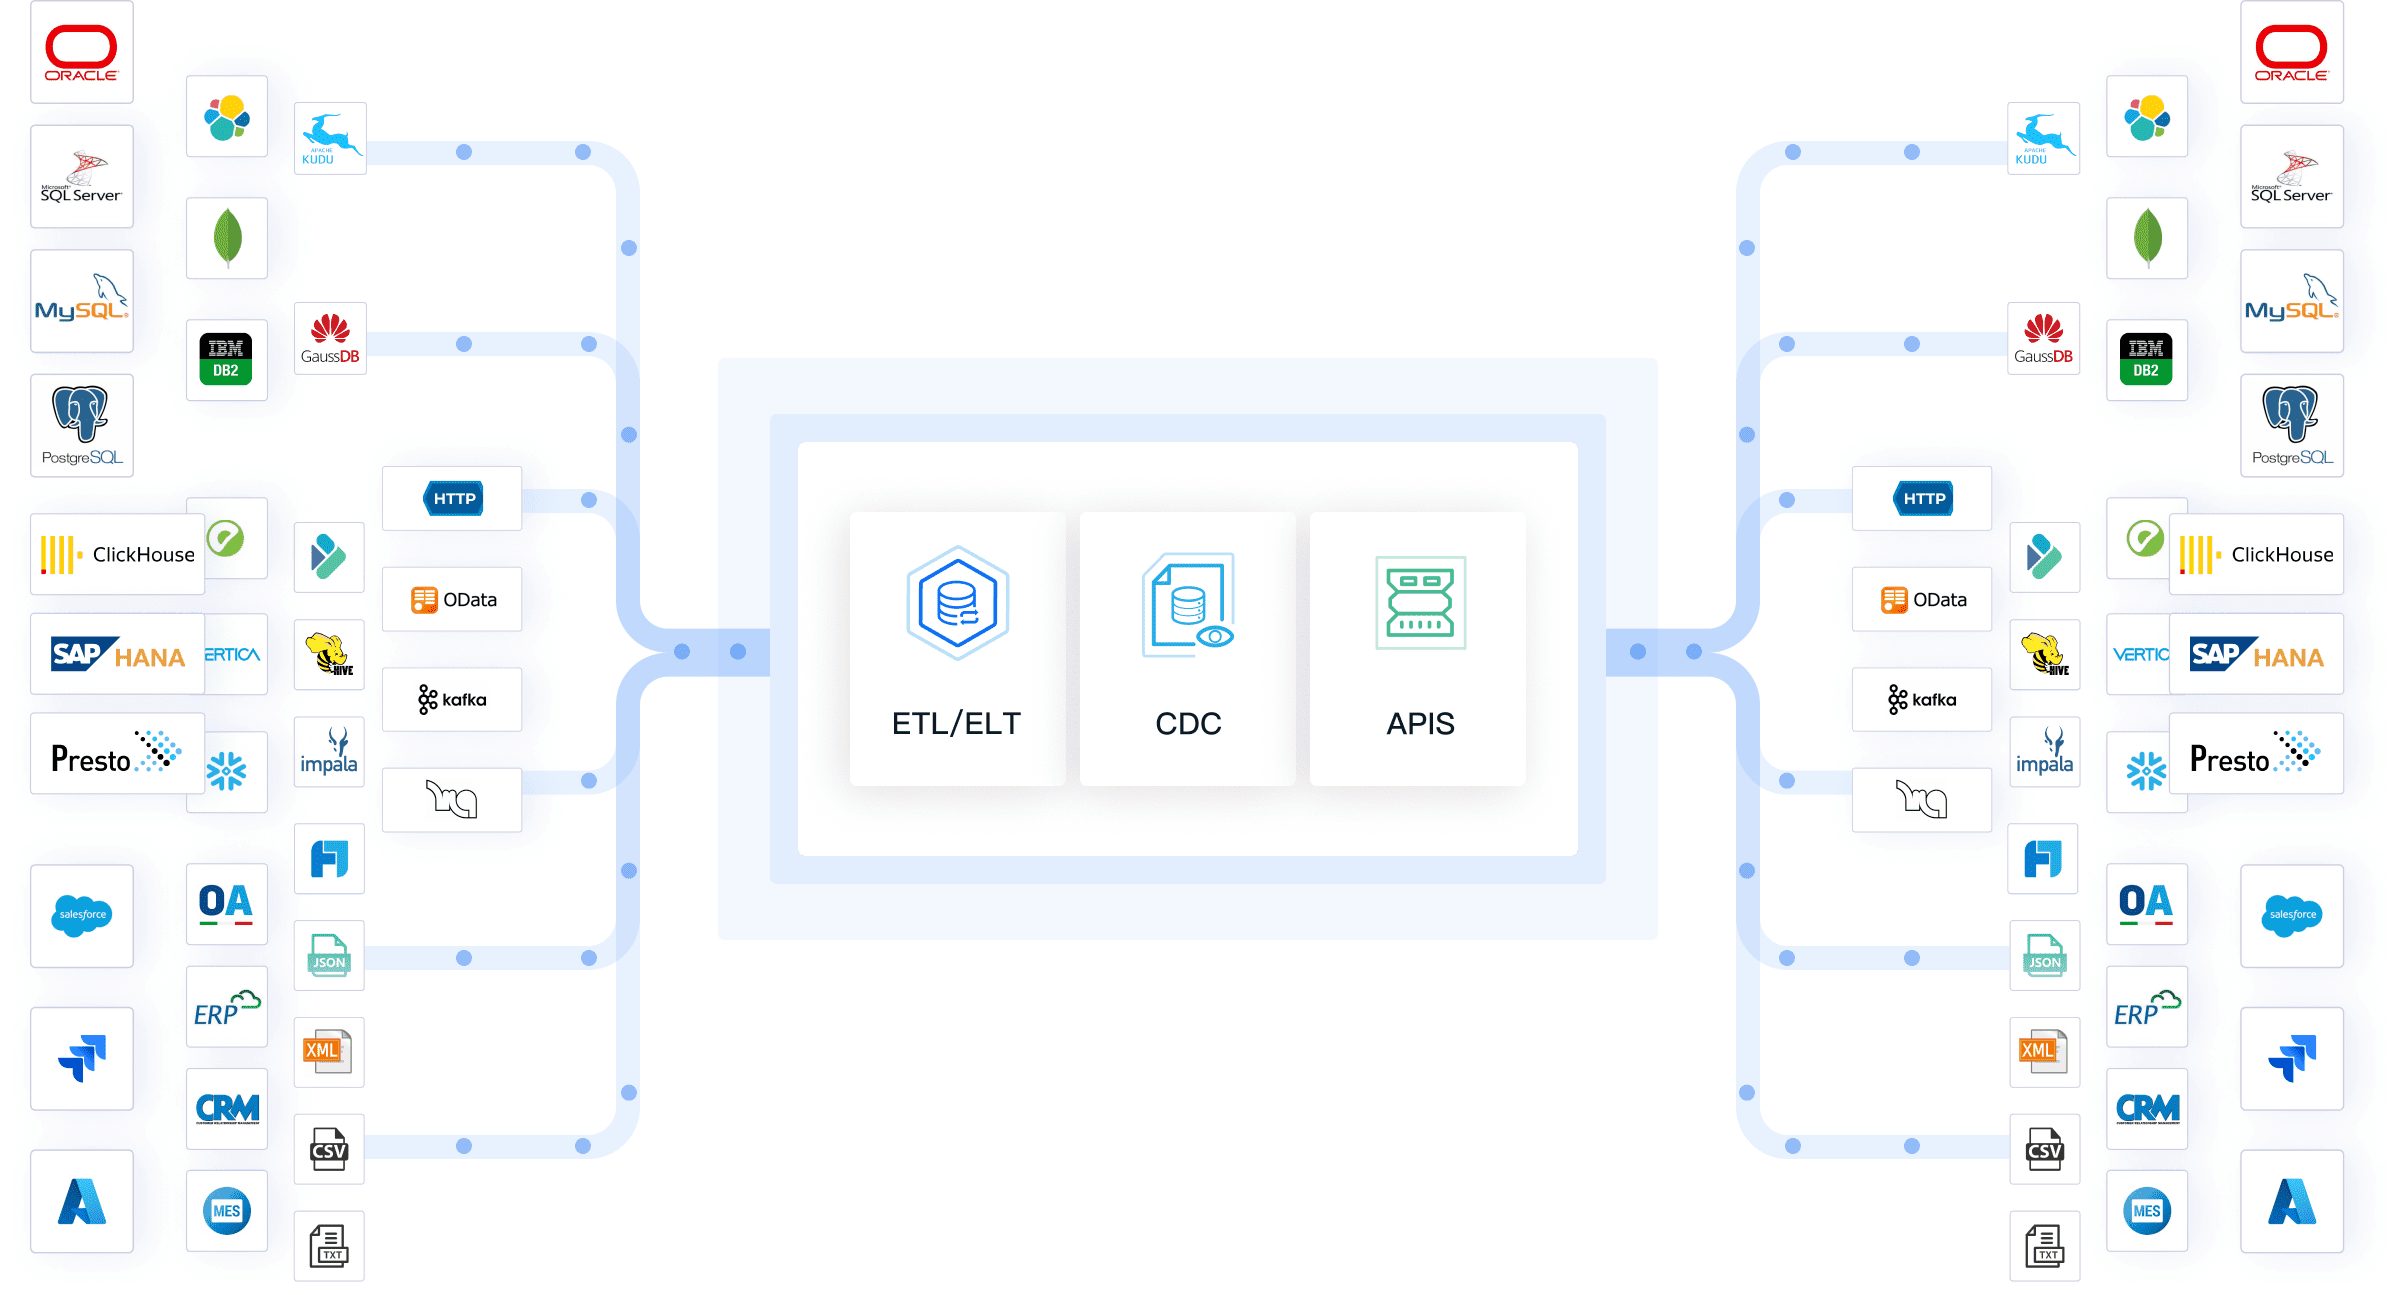
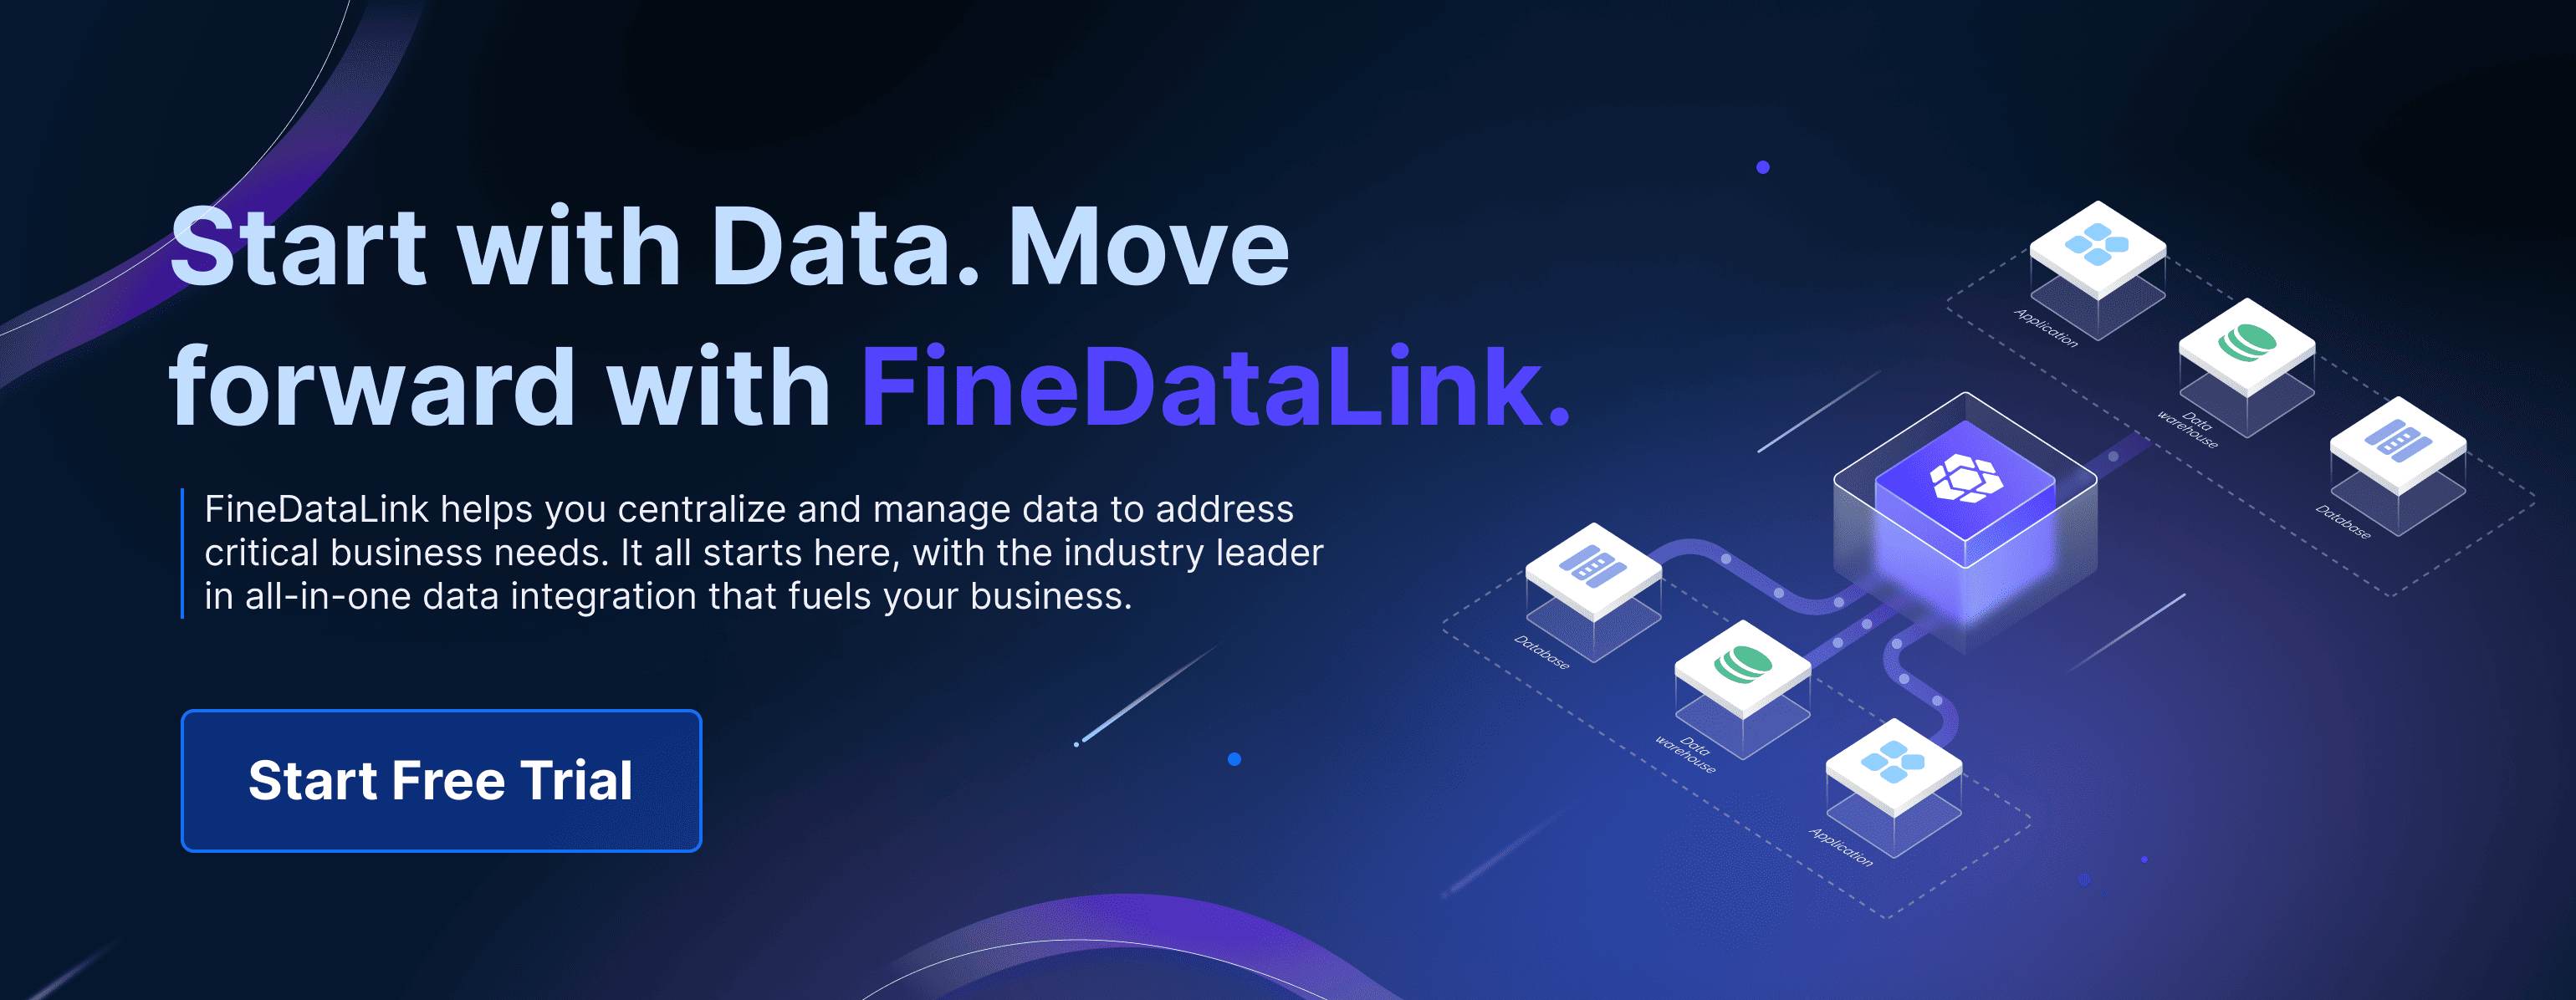
FineDataLink simplifies real-time data integration, syncing data across systems with minimal delay. Its ETL/ELT capabilities efficiently preprocess data, making it ready for analysis. The platform supports over 100 data sources, including databases, big data platforms, and SaaS apps, offering unmatched flexibility.
Website: https://www.fanruan.com/en/finedatalink
With a user-friendly visual interface, FineDataLink is easy for both technical and non-technical users. Its drag-and-drop functionality and pre-built connectors let you create data pipelines without coding. The API feature enables seamless data sharing between systems, enhancing collaboration.
FineDataLink also includes data quality checks, error handling, and automated scheduling for reliable integration. With role-based access and encryption, it ensures data security and compliance. Whether for real-time analytics or building data warehouses, FineDataLink streamlines workflows and drives data-driven decisions.
FineDataLink breaks down data silos by integrating data from various sources into one platform, giving businesses a complete view of operations for better decision-making. Its real-time synchronization ensures you always work with the latest information, boosting efficiency and reducing errors.
The platform scales effortlessly to handle large datasets, making it ideal for big data analytics. With an intuitive visual interface and drag-and-drop tools, FineDataLink simplifies complex tasks, saving time and effort. Its pre-built connectors and API features enable seamless data sharing and collaboration.
FineDataLink also includes data quality checks, automated scheduling, and robust security like role-based access and encryption. By streamlining workflows and reducing manual processes, FineDataLink helps businesses focus on turning data into actionable insights, driving growth and innovation.
Apache Spark is a powerful tool for big data analytics, known for its speed and scalability. It processes data in-memory, which significantly reduces the time required for data analysis. Spark supports multiple programming languages, including Python, Java, and Scala, making it versatile for developers. Its ability to handle both batch and streaming data ensures you can analyze real-time data alongside historical datasets. Spark also integrates seamlessly with big data platforms like Hadoop, enhancing its functionality.
Website: https://spark.apache.org/
Apache Spark enables you to process large datasets quickly, helping you uncover patterns and trends that drive strategic decisions. Its real-time data processing capabilities allow you to respond to market changes promptly. The platform’s scalability ensures it can grow with your business, handling increasing data volumes without compromising performance. By leveraging Spark, you can improve customer experiences, optimize operations, and gain a competitive edge in your industry.

Snowflake offers a cloud-based data warehousing solution that simplifies big data analytics. Its elastic scaling feature adjusts compute resources based on demand, ensuring cost efficiency. Snowflake supports seamless integration with multiple cloud platforms, making it adaptable to your existing infrastructure. Advanced compression techniques reduce storage requirements, allowing you to store large datasets economically. The platform also automates tasks like tuning and maintenance, freeing up your resources for more strategic activities.
Website: https://www.snowflake.com/en/
Snowflake transforms your data strategy by providing a flexible and efficient solution for data warehousing. Its elastic scaling ensures you only pay for the resources you use, optimizing costs. The platform’s automation features enhance productivity by eliminating manual tasks, allowing your team to focus on innovation. Snowflake’s ability to integrate with various cloud platforms ensures smooth workflows and operational efficiency. By adopting Snowflake, you can improve data accessibility, streamline analytics, and drive business growth.
Apache Hadoop has become a cornerstone for businesses managing large-scale data. Its ability to store and process massive datasets makes it a reliable choice for big data analytics. By clustering multiple computers, Hadoop enables parallel data processing, ensuring efficiency and scalability.
Website: https://hadoop.apache.org/
These features make Hadoop a robust framework for handling complex data challenges.
Hadoop offers numerous advantages that help businesses thrive in a data-driven world.
💡 Did you know? Hadoop powers big data analytics for industries like retail, finance, and healthcare. Its distributed and scalable nature makes it a go-to solution for processing massive datasets.
Hadoop’s real-world applications highlight its versatility. Retailers use it to optimize inventory, while financial institutions rely on it for risk analysis. Its ability to process data in parallel ensures businesses can uncover insights quickly and efficiently.
By adopting Hadoop, you can transform your approach to big data analytics. Its features and benefits provide a solid foundation for managing and analyzing large datasets, helping you stay competitive in a data-driven market.
Start by defining what you aim to achieve with data analysis. Clear objectives help you narrow down the right analytical tools for your business. For example, if your goal is to improve customer retention, you might prioritize tools that excel in predictive analytics. On the other hand, if you need to monitor real-time operations, tools with real-time analytics capabilities will be more suitable.
To align your objectives with the right tools, consider the following criteria:
| Analytical Criteria | Description |
|---|---|
| Business Objectives | Define what you aim to achieve with analytics to narrow down tool options. |
| Technical Requirements | Assess if your team can handle advanced models or needs a user-friendly solution. |
| Budget Planning | Evaluate the cost of tools against potential ROI, considering both open-source and premium options. |
| Implementation Needs | Consider the setup and training required for the tool, including time and resources for onboarding. |
| Integration Capabilities | Ensure compatibility with existing systems like CRM and ERP. |
| Vendor Evaluation Criteria | Compare vendors based on reputation, support, and user reviews, utilizing trials for assessment. |
Selecting the right tool can enhance insights, streamline processes, and improve decision-making capabilities. Each tool offers unique advantages tailored to specific tasks, enabling you to find the best fit for your business analytics needs.
The volume and complexity of your data play a critical role in tool selection. If your business handles large datasets, prioritize tools with robust data integration and processing capabilities. For example, Apache Hadoop excels in managing massive datasets, while FineDataLink simplifies real-time data integration across multiple systems.
For smaller datasets or simpler analyses, tools like FineBI or Tableau may be more appropriate. These tools offer user-friendly interfaces and powerful data visualization features, making them ideal for data exploration and discovery.
💡 Tip: Choose tools that can scale with your data needs. This ensures you won’t outgrow your solution as your business expands.

Ensure the analytical tools you choose integrate seamlessly with your current systems. Tools like Microsoft Power BI, which integrates with Excel and Teams, can streamline workflows and reduce disruptions. Similarly, FineDataLink supports over 100 data sources, making it a versatile choice for businesses with diverse systems.
Integration capabilities are essential for maintaining data consistency and avoiding silos. Evaluate whether the tool can connect to your CRM, ERP, or other platforms. This compatibility ensures smooth data flow and enhances the accuracy of your business analytics tools.
Scalability is another critical factor. As your business grows, your data needs will evolve. Tools like Snowflake and Apache Spark offer elastic scaling, allowing you to handle increasing data volumes without compromising performance.
Plan for future growth by choosing tools that support advanced features like AI and machine learning. These capabilities can future-proof your investment and enable you to make data-driven decisions as your business landscape changes.
Ease of use is vital, especially if your team includes non-technical users. Tools like FineBI and FineReport feature drag-and-drop interfaces, enabling users to create dashboards and perform data exploration without coding skills.
A user-friendly tool reduces the learning curve and empowers your team to analyze data independently. This fosters a culture of data-driven decisions across your organization.
Budget constraints often influence tool selection. Compare the cost of tools against their potential ROI. Open-source options like Apache Hadoop may offer cost savings, but premium tools like Tableau or Microsoft Power BI provide advanced features and better support.
💡 Note: Investing in the right tool can save time and resources in the long run. Evaluate both upfront costs and long-term benefits to make an informed decision.
By carefully assessing your needs, scalability, and budget, you can select analytical tools that align with your business goals and drive growth.
AI and automation are transforming how you approach data analysis. By 2025, AI-powered analytics will dominate, enabling businesses to predict outcomes and trends with remarkable accuracy. Machine learning algorithms will automate repetitive tasks, reducing the time needed for qualitative data analysis by up to 70%. This efficiency allows you to focus on strategic decision-making rather than manual processes.
The generative AI market is expected to grow at a staggering 42% CAGR, reaching $1.3 trillion by 2032. This growth highlights the increasing reliance on AI for handling unstructured data, which will account for 80-90% of global data by 2025. Tools leveraging agentic AI will independently perform tasks, further streamlining operations. These advancements will make business analytics tools more powerful and accessible, helping you stay competitive in a data-driven world.
💡 Tip: Start exploring AI-driven tools now to prepare for the shift toward automation in data analytics.

Real-time analytics will become a cornerstone of business success. Companies using real-time data insights can adapt quickly to market changes, improving productivity and profitability. For instance, businesses focusing on data-driven strategies are 5% more productive and 6% more profitable than their competitors.
Real-time analytics also enhances operational efficiency. A retail giant increased its inventory turnover rate by 40% using real-time metrics, minimizing costs and maximizing sales. Similarly, a tech firm reduced customer acquisition costs by 30% while boosting customer satisfaction by 25%. These examples demonstrate how real-time data insights can drive growth and improve decision-making.
| Metric/Example | Impact/Outcome |
|---|---|
| Revenue Growth | Companies implementing analytics can improve revenue growth by up to 20%. |
| Productivity and Profitability | Data-driven strategies increase productivity by 5% and profitability by 6%. |
| Inventory Turnover Rate | A retail giant improved turnover by 40%, reducing costs and increasing sales. |
By adopting real-time analytics, you can respond to challenges and opportunities faster, ensuring your business remains agile and competitive.
As reliance on data grows, ensuring its security becomes critical. Analytical tools in 2025 will prioritize enhanced data security and privacy features. Proactive threat detection and prevention will protect your data from unauthorized access. Encryption and firewalls will safeguard sensitive information, while compliance with regulations like GDPR will ensure ethical data usage.
Improved response times to security incidents will minimize potential damage. Enhanced visibility into risks and vulnerabilities will help you address issues before they escalate. These features will not only protect your business but also build trust with your customers.
🔒 Note: Investing in tools with robust security measures ensures compliance and protects your reputation in an increasingly data-reliant world.
Analytical tools are essential for thriving in 2025's data-driven landscape. They transform raw data into actionable insights, enabling you to make informed decisions and address challenges proactively. For example, organizations using effective analytics report a 63% increase in productivity and a 73% boost in employee engagement.
Explore tools like FineBI, FineReport to unlock your data's potential. By adopting the right tools, you can enhance performance, identify key metrics, and stay ahead in a competitive market.
Click the banner below to try FineBI for free and empower your enterprise to transform data into productivity!
How to Fix Data Analysis Excel Not Showing in 2025
What is SaaS Analytics and Why Businesses Need It
Top Beginner-Friendly Data Analysis Projects to Build Your Portfolio
Data Analysis vs Data Analytics: What’s the Real Difference?
What’s Topological Data Analysis? Simplify Data Secrets!
What is Retail Industry Data Analysis and Why It Matters
1. What are analytical tools, and why do you need them?
Analytical tools help you process and interpret data to make informed decisions. They transform raw data into actionable insights, enabling you to identify trends, predict outcomes, and improve efficiency. These tools are essential for staying competitive in today’s data-driven business environment.
2. How do you choose the right analytical tool for your business?
Start by identifying your business goals and data needs. Evaluate tools based on scalability, ease of use, integration capabilities, and cost. Consider tools like FineBI for self-service analytics or FineDataLink for real-time data integration.
3. What is the difference between FineBI and FineReport?
FineBI is a self-service BI tool for dynamic data exploration and interactive dashboards, ideal for real-time decision-making. FineReport specializes in creating structured, print-ready reports and formal dashboards, excelling in template-based documentation. While FineBI focuses on user-driven analytics, FineReport is tailored for professional reporting, together offering a comprehensive solution for diverse data needs.
4. Can non-technical users work with analytical tools?
Yes, many tools like FineBI and FineReport offer user-friendly interfaces. Features like drag-and-drop functionality and guided workflows make it easy for non-technical users to analyze data and create visualizations without coding skills.
5. What industries benefit most from analytical tools?
Analytical tools benefit industries like manufacturing, healthcare, retail, and finance. For example, manufacturers use them for supply chain optimization, while retailers analyze customer behavior to improve sales strategies.
6. How do real-time analytics improve decision-making?
Real-time analytics provide up-to-date insights, enabling you to respond quickly to market changes. For instance, a retailer can adjust inventory based on live sales data, reducing costs and maximizing profits.
7. What makes FineChatBI unique among analytical tools?
FineChatBI combines conversational AI with business intelligence. Its Text2DSL technology translates natural language queries into structured data queries, making data analysis intuitive. It also supports multi-turn Q&A, ensuring seamless interactions.
8. Are analytical tools secure for handling sensitive data?
Yes, most modern tools prioritize data security. Features like encryption, role-based access control, and compliance with regulations (e.g., GDPR) ensure your data remains safe and protected.

The Author
Lewis
Senior Data Analyst at FanRuan
Related Articles
Data Analyst Dashboard: A Scenario-Based Guide to KPI Views That Drive Better Business Decisions
Learn how data analyst dashboards turn raw data into actionable KPI views for operational, analytical, and strategic decisions. Drive better business outcomes.
Lewis Chou
May 03, 2026

Self-Service Analytics Defined and Why You Need It
Self-service analytics lets you analyze data without IT help, empowering faster, data-driven decisions and boosting agility for your business.
Lewis
Jan 04, 2026

Best Self-Service Tools for Analytics You Should Know
See which self-service tools for analytics let business users access data, build dashboards, and make decisions faster—no IT help needed.
Lewis
Dec 29, 2025


