A revenue cycle management dashboard helps you see the financial health of your organization. You use it to track billing and patient billing. You get real-time insights that show you changes as they happen. These insights help you spot trends and patterns. You can view insights about payments, claims, and accounts. Insights let you see which areas need attention. With real-time insights, you respond quickly to issues. You gain insights about cash flow and denials. FineBI gives you more insights by connecting data sources. You get insights that improve your decisions. Insights show you what works best. You use insights to boost efficiency and accuracy. Insights help you reach your goals.
What Is a Revenue Cycle Management Dashboard

Core Purpose and Users
A revenue cycle management dashboard lets you see your organization’s money health. You use it to watch each step in the revenue cycle management process. This means making invoices, handling payments, and checking on unpaid bills. The dashboard helps you make fewer mistakes and bill faster. You can find late payments and invoices that need help. This makes your work better and quicker.
If you work in finance or healthcare, you use the revenue cycle management dashboard. People in different jobs use the dashboard for their own reasons.
Compliance officers, billing teams, and collections teams also use the dashboard. They check for mistakes, follow up on payments, and make sure rules are followed. The dashboard helps everyone work together and stay updated.
Key Components and Data Sources
A revenue cycle management dashboard brings many important things together. You see live data from billing, payments, and patient records. The dashboard connects to other systems so you always have the newest information. This helps you make good choices quickly.
Some main parts of a revenue cycle management dashboard are:
- Tools for making and sending invoices
- Features for handling payments and matching records
- Alerts for invoices that are not paid or only partly paid
- Modules for handling disputes
- Logs for tracking rules and audits
You also get built-in tools for reports. These help you watch key performance indicators (KPIs) and cash flow. The dashboard uses live data, so you always see the latest numbers. You can use predictive analytics to guess future payments and find trends. This makes your money planning better.
The dashboard gets data from many places, like:
- Electronic health records
- Billing systems
- Payment gateways
- Insurance claim platforms
- Financial databases
You may face problems when setting up a revenue cycle management dashboard. If you cannot track claims well, you may see more denials. Late payments can hurt your cash flow. You need to keep up with new rules and make sure your data is current. Tracking KPIs by hand takes time and can cause mistakes.
Modern revenue cycle management dashboards fix these problems. They give you live insights and easy-to-use screens. You can see all your data in one spot. This helps you work faster and make fewer mistakes. You can use the dashboard to keep your team on track. Billing teams can focus on the right claims. Collections teams can find late accounts fast. Managers can see the big picture and make better choices.
A revenue cycle management dashboard helps you follow healthcare rules. Compliance officers use it to watch processes and make sure you follow rules like HIPAA, Medicare, and Medicaid. They can run checks and train staff to stop legal problems.
You also use the dashboard to help finance and clinical teams work together. Everyone can see the same data and aim for the same goals. This teamwork helps your organization run well and meet its money targets.
How Revenue Cycle Management Dashboard Works
Data Integration and Real-Time Analytics with FineBI
You need correct information to handle billing and patient billing. FineBI connects your data sources and puts all your information together. You see updates from billing systems, insurance platforms, and payment gateways right away. FineBI uses automation to keep your data up-to-date and trustworthy. You do not have to wait for people to update things. Data analytics tools in FineBI help you find trends and patterns. You can check billing performance and patient billing results. FineBI lets you use advanced analytics to guess future payments and make claims processing better. You get a clear look at your revenue cycle. Automation cuts down mistakes and makes billing faster. You can focus on analytics instead of doing things by hand. FineBI makes data analytics simple for everyone.
Workflow from Billing to Patient Billing
You follow steps to handle billing and patient billing. The dashboard shows each step in order. Here is how the workflow goes:
- Patient registration
- Insurance verification
- Medical coding
- Claims submission
- Payment processing
- Patient billing
You start with patient registration. You check insurance details. You use medical coding to explain services. You send claims for processing. You handle payment processing. You finish with patient billing. Automation helps you move through each step fast. You track claims processing and billing as it happens. You see where delays happen and fix them quickly. Analytics tools help you make each step better. You use data analytics to find weak spots and work more efficiently.
User Experience and Accessibility
You want a dashboard that is simple to use. FineBI gives you a visual interface with easy charts and tables. You see key performance indicators for billing and patient billing. You track claims processing and payment collection. The dashboard uses automation to update data and send alerts. You can use the dashboard from any device. Working together is easy. Clinical staff, billing teams, and administrators can work as a team. Regular updates keep everyone in the loop. You use analytics to make decisions fast. Data analytics tools help you understand how things are going. You see the whole revenue cycle at once. The dashboard helps communication and teamwork. You make smart choices and reach your goals.
Essential Metrics and Visualizations in Revenue Cycle Management Dashboards
Revenue Cycle KPIs Tracked
A revenue cycle management dashboard helps you watch important numbers. These numbers tell you how your billing is doing. You can see what needs to get better. Here are some key performance indicators you should check:
- Clean claim rate
- Denial rate
- Days in accounts receivable
- Net collection rate
- Cost to collect
- Aged accounts receivable rate
- Claim appeal rate
- Bad debt rate
- Gross collection rate
- POS collection rate
- Charge lag
- Revenue per patient visit
You look at these KPIs to find what needs work. You can spot problems in billing and fix them. You see how fast you get paid and how many claims are denied. This information helps you make your billing better.
Visualizing Billing and Cash Flow
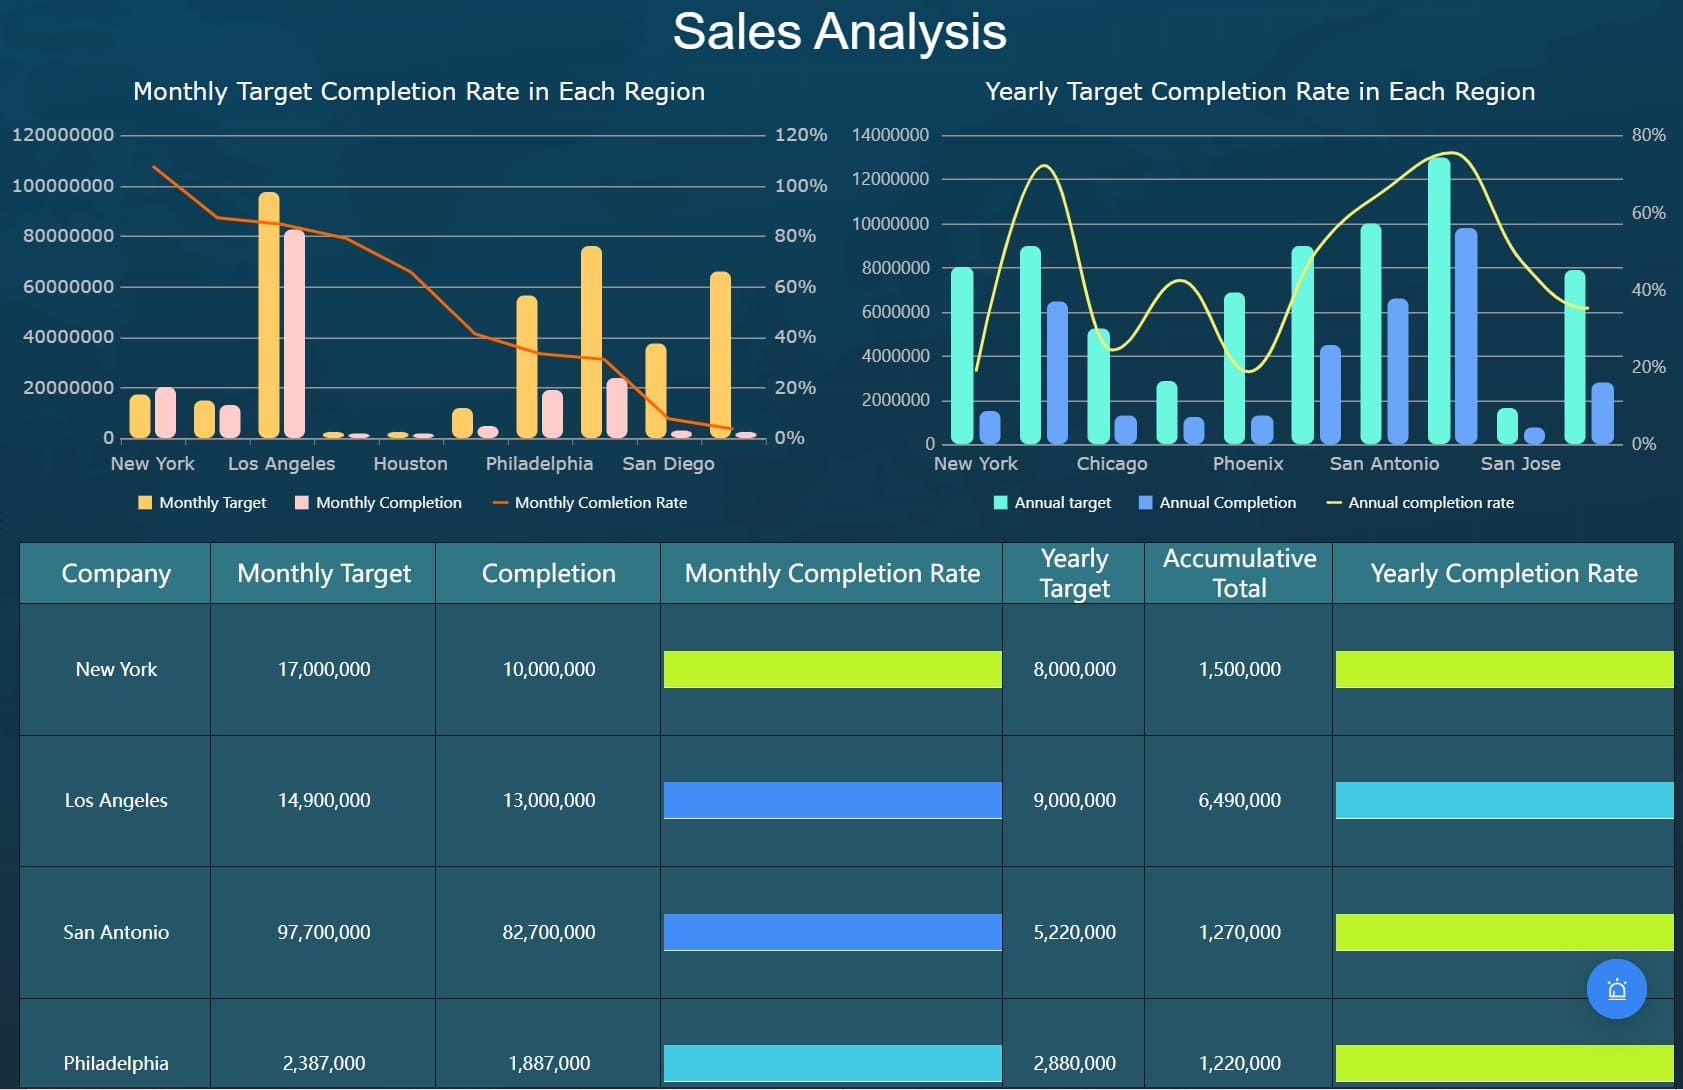
You need easy-to-read visuals to understand billing and cash flow. Dashboards use charts and graphs to show how billing is going. You can see trends and patterns in billing. You use bar charts, line charts, and pie charts to compare billing and cash flow. Here is a table that shows ways to see billing and cash flow:
| Section | Recommended Metric | Visualization Type |
|---|---|---|
| Billing Performance | Clean Claim Rate, Net Collection | Bar/Line Combo Chart |
| Denials | Denial Trends by Payer | Stacked Area Graph |
| A/R Aging | A/R by Bucket (0–30, 31–60…) | Pie Chart or Bar Graph |
You use these visuals to see how billing is getting better. You can spot billing problems and fix them. You track billing numbers and see where cash flow needs help. Visuals make billing easier to understand.
Monitoring Denials and Accounts Receivable
You watch denials and accounts receivable to keep billing strong. Dashboards give you real-time updates about denials. You see which claims get denied the most. You find codes that cause denials. Dashboards help you track denials and see if your fixes work. You spot accounts that need follow-up when they get old. You use dashboards to check if denial rates get better after changes. You see if billing changes help lower denials. Dashboards help you make billing better and cut down on denials.
- Dashboards show denial rates right away.
- You see which claims get denied most often.
- You find accounts that need fast follow-up.
- You track if denial rates get better.
- You use dashboards to see billing changes.
Dashboards help you make billing better, lower denials, and keep accounts receivable healthy. You see where billing needs help and take action. Dashboards help you reach your billing goals and get better every day.
Benefits of Revenue Cycle Management Dashboards
Improving Efficiency and Transparency
You use a revenue cycle management dashboard to work faster. The dashboard shows your billing and revenue in one place. You see updates right away, so you know what is happening. You track important numbers like claim statuses and denial rates. This helps you find problems early. You spot where money is lost and what needs fixing. You watch daily results and see billing trends. Dashboards use bar charts and pie charts to show patterns. You get a clear view of your billing and revenue. Hospitals and clinics use dashboards to check how they are doing. This makes billing easier to understand.
| Benefit | Description |
|---|---|
| Real-time visibility | Dashboards let you see important numbers right away. |
| Tracking metrics | They track claim statuses and denial rates for clear billing. |
| Identifying bottlenecks | Dashboards help you find problems in the revenue cycle. |
Supporting Informed Decision-Making with FanRuan-en Solutions
You make better choices with dashboards from FanRuan-en like FineBI. You see all your billing and revenue data together. You react fast to changes in billing and revenue. You use facts to help you decide what to do. Dashboards show you trends in billing and revenue. You see what needs to get better. You check performance every day. You use charts to compare billing and revenue. You find why denials happen, like coding mistakes or missing papers. Dashboards help you understand denial trends and make billing more accurate. FanRuan-en solutions help you keep your revenue cycle strong.
- Dashboards help you make smart choices using data.
- You find where money is lost and what needs fixing.
- You check performance with daily updates.
- Dashboards show you many sides of how your team is doing.
Enhancing Performance and Accountability
Dashboards help you do better and stay responsible. You track billing and revenue as it happens. You make quick choices to keep things running well. Dashboards let you change views to focus on your goals. You spot bad trends before they get worse. Teams use dashboards to check their billing and revenue. You see which claims need help. Dashboards help your team work toward revenue targets. Dashboards help you stay responsible and improve every day.
| Feature | Benefit |
|---|---|
| Real-time monitoring | Teams see results right away and fix problems fast. |
| Custom views | Dashboards let you focus on the numbers that matter most. |
| Proactive alerts | You spot bad trends early and protect your money. |
Best Practices for Using Revenue Cycle Management Dashboards
Customization for Organizational Needs
Your dashboard should fit your team’s needs. FineBI lets you change dashboards for each job. CFOs want to see big trends and tools for planning. CEOs like simple dashboards that show main trends. Finance team members need to watch how money moves and check process numbers. You can set up views so each person sees what they need. This helps you get quick results in billing and accounts receivable. You get useful tips to help you decide faster. Automated reports save time and stop extra work.
| Role | Dashboard Needs |
|---|---|
| CFOs and Finance Directors | High-level trends, detailed insights, variance analysis, forecasting tools |
| CEOs | Simplified dashboards highlighting major trends and exceptions |
| Finance Team Members | Operational dashboards tracking transaction flows and process metrics |
You should make dashboards match your business goals. Custom dashboards let you filter data and focus on what matters. When dashboards fit your work, everyone uses them more. This helps you reach your goals and improve accounts receivable.
Ensuring Data Quality and Security
You must keep your data safe and correct. Start by using strong access controls. Use usernames, passwords, and two-factor checks to protect billing data. Check your data often for mistakes. Fix any errors you find. Make sure data looks the same everywhere for better analytics. Data rules help you keep data good. You should use encryption to keep information safe when stored or sent. Access controls stop people who should not see billing data.
| Best Practice | Description |
|---|---|
| Data Governance Policies | Set rules for data quality, accuracy, and consistency, including access controls. |
| Data Quality Checks | Find and fix errors, standardize formats, and check data against rules. |
| Robust Data Security Measures | Use encryption and access controls to protect sensitive patient information. |
You should also check data often and fix any problems. This keeps your billing and accounts receivable data trustworthy.
Training Teams for Effective Use
You need to teach your team how to use the dashboard well. Ongoing lessons help staff learn new billing codes, payer rules, and system updates. Short trainings keep everyone’s skills fresh. Do regular checks to see if your workflow needs changes and get feedback. Well-trained teams do billing and accounts receivable better. They find important claims, spot late accounts, and give leaders a clear money picture.
| Training Method | Description |
|---|---|
| Ongoing Education | Continuous updates on CPT/HCPCS, ICD-10, payer policies, compliance, and system enhancements. |
| Micro-Trainings | Regular short training sessions to keep knowledge current across the team. |
| Workflow Audits | Regular reviews to adapt to changes and gather feedback for continuous improvement. |
You get better results when you train your team often. Teams with regular training do billing better and reach money goals faster.
You can see how revenue cycle management dashboards help your work. You keep track of patient billing and payments. You watch patient claims and denials. You notice patient trends and patterns. You find patient problems and bottlenecks. You fix patient mistakes and delays. You help patient cash flow and collections. You check patient accounts and receivables. You look at patient metrics and KPIs. You study patient data and reports. You use patient dashboards and charts. You look at patient graphs and tables. You compare patient numbers and results. You measure patient outcomes and improvements. You review patient processes and workflows. You handle patient billing and revenue. You make patient cycles and operations better. You boost patient efficiency and transparency. You help patient decisions and strategies. You push patient growth and success.
You see real changes after using dashboards. Here is a table that shows what gets better:
| Metric | Improvement |
|---|---|
| Gross days in A/R | Went down by more than half in a year |
| Insurance denial rates | Dropped by over 71% from last year |
| Cash collection | Grew from $1.5 million to $2.8 million each month |
You use FineBI from FanRuan for real-time insights. You get patient data faster. You use smart reporting for analytics. You trust AI agent decision support for alerts. Here is a table that shows the benefits:
| Application | Benefit |
|---|---|
| Q&A Data Retrieval | Makes query time 20× faster, so you get data quickly. |
| Smart Reporting | Uses big-model analysis for fast, interactive analytics. |
| AI Agent Decision Support | Mixes business logic and model thinking for automatic analysis and alert workflows. |
You use dashboards to make patient work faster, clearer, and stronger. You help your organization grow with tools that focus on patients.


FAQ

The Author
Lewis
Senior Data Analyst at FanRuan
Related Articles

Portfolio Reporting for PMOs: 9 Executive Metrics Every Weekly Portfolio Dashboard Should Include
Weekly portfolio reporting should help executives answer three questions fast: Are we delivering the right initiatives, are we putting outcomes at risk, and what decisions need leadership this week? For PMOs, that means
Yida Yin
Jul 01, 2026

How to Build an Investment Portfolio Reporting Dashboard for Executives: KPIs, Benchmarks, and Drill-Down Views
Investment portfolio reporting for executives is not about showing every holding, transaction, and chart your investment team can produce. It is about giving CEOs, CFOs, CIOs, boards, and investment committees a fast, re
Yida YIn
Jun 25, 2026

12 KPI Reporting Examples for Executive Dashboards: What to Show in Weekly, Monthly, and Quarterly Reviews
Executive leaders do not need more data. They need decision ready $1 examples that match how often they review the business and what actions they are expected to take. A weekly $1 should surface fast moving risks and per
Yida YIn
Jun 25, 2026